Press review - page 446

 
Sergey Golubev:

USD/CAD Intra-Day Fundamentals: Canada's Consumer Price Index and 92 pips range price movement

2016-10-21 12:30 GMT | [CAD - CPI]

if actual > forecast (or previous one) = good for currency (for CAD in our case)

[CAD - CPI] = Change in the price of goods and services purchased by consumers.

==========

From official report:

  • "The Consumer Price Index (CPI) rose 1.3% on a year-over-year basis in September, following a 1.1% gain in August."
  • "Excluding gasoline, the CPI was up 1.5% year over year in September, after posting a 1.7% increase in August."
  • "On a seasonally adjusted monthly basis, the CPI increased 0.2% in September, after declining 0.1% in August."
  • "In September, four major components increased on a seasonally adjusted monthly basis, while three declined. The shelter index was unchanged."

Seasonally adjusted monthly Consumer Price Index:


==========

USD/CAD M5: 92 pips range price movement by Canada's Consumer Price Index news event


What is the relation to to the Seasonally adjusted monthly Consumer Price Index?
 
PCWalker:
What is the relation to to the Seasonally adjusted monthly Consumer Price Index?
Seasonally adjusted CPI value (the other names are the following: CPI s.a.; CPI sa; CPI ex; and most popular name is CPI core or Core CPI) are more impacted compare with CPI.

Example: Core Durable Orders are more impacted news event than Dorable Orders, and so on.

The traders are lookibng for core values because those values are moving the price a lot.

I mean: CPI value is just for information only, CPI core is to understand why the price was moved like that to some direction for example. Same with other other news event: core value is more important for us.


Weekly Outlook: 2016, October 23 - October 30 (based on the article)

The US dollar took a break but eventually renewed its strength, with new seven month highs against the euro and the loonie. Mark Carney and Mario Draghi’s speeches, US Durable Goods Orders, and GDP data from the UK and the US. These are the major events on forex calendar.
  1. German Ifo Business Climate: Tuesday, 8:00. Economists expect a further rise to 109.6.
  2. US CB Consumer Confidence: Tuesday, 14:00. U.S. consumer confidence is expected to decline to 101.5 this time.
  3. Mark Carney speaks: Tuesday, 14:35. BOE Governor Mark Carney will speak in London before the House of Lords Economic Affairs Committee about the economic consequences of the Brexit Vote.
  4. Mario Draghi speaks: Tuesday, 15:30. ECB President Mario Draghi will make a speech in Berlin. Market volatility is expected.
  5. US Crude Oil Inventories: Wednesday, 14:30.
  6. UK GDP data: Thursday, 8:30. The third quarter growth rate is expected to reach 0.3%.
  7. US Durable Goods Orders: Thursday, 12:30. Orders for durable goods are expected to increase be 0.1% in September, while core orders are predicted to gain 0.2%.
  8. US Unemployment Claims: Thursday, 12:30. The number of new unemployment claims is expected to reach 261,000 this week.
  9. US GDP data: Friday, 12:30. The estimates for GDP growth in the third quarter are around 2.5%.
Forex Weekly Outlook October 24-28 | Forex Crunch
  • 2016.10.21
  • Anat Dror
  • www.forexcrunch.com
The US dollar took a break but eventually renewed its strength, with new seven month highs against the euro and the loonie. Mark Carney and Mario Draghi’s speeches, US Durable Goods Orders, and GDP data from the UK and the US. These are the major events on forex calendar. Join us as we explore the market movers of this week. US data were quite...
 

EUR: Weekly Outlook - Morgan Stanley (based on the article)


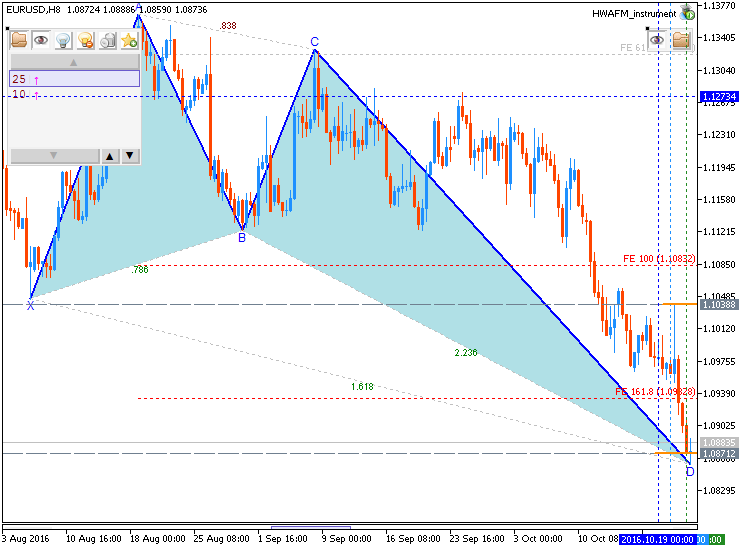
H4 price is continuing with the bearish breakdown by 1.0858 support level to be tested for the bearish trend to be resumed while Morgan Stanley is suggesting for the traders to be in neutral with this pair for the week:

"The latest ECB meeting did not reveal any new information and put all attention on the December meeting instead. EURUSD break below the Jun low of 1.0913 could open downside to the February/March low of around 1.0820. On the crosses, however, EUR is likely to remain supported. Should global and EMU inflation continue rising, ECB tapering talk could come back into focus and the current rate cut priced by the markets may be reduced, supporting the currency. In this scenario, global yield curves may also continue steepening, which could hit risk appetite, providing further support for EUR crosses."

Anyway, if H4 intra-day price breaks 1.0858 support to below on close bar so the bearish trend will be continuing, otherwise the price will be on bearish reanging within narrow s/r levels.

USD, EUR, JPY, GBP, CAD, AUD, NZD: Weekly Outlook - Morgan Stanley
  • www.efxnews.com
USD: Further Gains Expected. Bullish. We increasingly believe the USD is moving back to its long-term bullish trend, driven by two factors. First, the closing US output gap and its implications on monetary policy should move rate and yield differentials in favour of the USD. Second, should global yield curves continue steepening as inflation...
 

CAD: Weekly Outlook - Morgan Stanley (based on the article)


Daily price is on bullish breakout to be started in the end of the last week: the price is testing 1.3358 resistance level to above for the primary bullish trend to be continuing. For the week, the Morgan Stanley is suggesting for the traders to be in neutral with this pair for a week:

"In the latest meeting, the BoC revised their inflation and growth forecasts down and changed their wording on inflation risks to be "roughly balanced", which was less dovish than markets expected. However, Governor Poloz later said that the bank actively discussed the possibility of adding more stimulus, though it would require a shock or series of shocks for them to ease further. We think this means the Bank is willing to act if the economy takes another dip, but would need shocks such as a significant drop in oil, severe slowdown in the US economy or a US presidential outcome that could change NAFTA for them to deliver more easing. These scenarios look unlikely for now, therefore we turn neutral on CAD."

If D1 price breaks 1.3358 resistance to above on close bar so the bullish trend will be continuing.
If D1 price breaks 1.3090 support level to below so the reversal of the price movement from the bullish to the primary bearish market condition will be started.
If not so the price will be on bullish ranging within the levels.
USD, EUR, JPY, GBP, CAD, AUD, NZD: Weekly Outlook - Morgan Stanley
  • www.efxnews.com
USD: Further Gains Expected. Bullish. We increasingly believe the USD is moving back to its long-term bullish trend, driven by two factors. First, the closing US output gap and its implications on monetary policy should move rate and yield differentials in favour of the USD. Second, should global yield curves continue steepening as inflation...
 

Quick Technical Overview - S&P 500: Recovery Has Been The Strongest In History (based on the article)

Daily price is on ranging market condition located near and below Senkou Span line which is the virtual border between the primary bearish and the primary bullish trend on the chart. Symmetric triangle pattern was formed by the price to be crossed for the direction of the trend, and Absolute Strength indicator is estimating the ranging condition to be continuing in the near future.

Analyst Doug Short is comparring the next recovery with the past ones:


  1. The Crash of 1929, which eventually ushered in the Great Depression,
  2. The Oil Embargo of 1973, which was followed by a vicious bout of stagflation,
  3. The 2000 Tech Bubble bust and,
  4. The Financial Crisis following the record high in October 2007.
As we see from the daily chart so the recovery is already started by 2,144 resistance level to be testing for the daily bullish reversal.
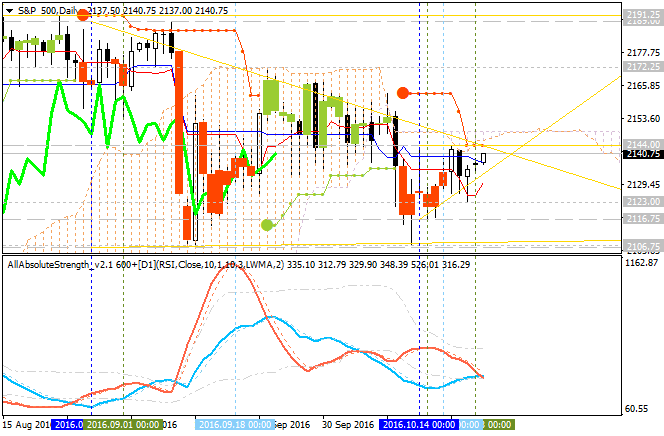

If W1 price will break 2,106 support level so the primary bearish trend will be resumed.
If W1 price will break 2,144 resistance level so the reversal to the primary bullish condition will be started.
If not so the price will be ranging within the levels.
S&P 500’s Recovery Has Been The Strongest In History
  • etfdailynews.com
This chart series features an overlay of the Four Bad Bears in U.S. history since the equity market peak in 1929. They are: The Crash of 1929, which eventually ushered in the Great Depression, The Oil Embargo of 1973, which was followed by a vicious bout of stagflation, The 2000 Tech Bubble bust and, The Financial Crisis following the record...
 

GBP/USD Intra-Day Fundamentals: Bank of England Bond-Buying Operation Results and 36 pips price movement

2016-10-24 13:50 GMT | [GBP - Bank of England Bond-Buying Operation Results]

  • past data is n/a
  • forecast data is n/a
  • actual data is n/a according to the latest press release

==========

GBP/USD M5: 36 pips price movement by Bank of England Bond-Buying Operation Results news event


Brent Crude Oil Intra-Day Technicals: possible ranging correction (adapted from the article)

H4 price is located above 100 SMA/200 SMA reversal levels in the bullish area of the chart:

  • The price is on ranging within 53.67 resistance level for the bullish trend continuation and 50.74 support level for the bearish reversal to be started.
  • "Crude oil turned into strong bullish mode in September which looks like an impulsive price move on the 4h chart. We see an extended and sharp leg from 44.14 to 51.50 that looks like wave 3 of an impulsive structure. If that’s true then we know that market is in new bullish phase so uptrend should continue after the wave 4 pullback which can be now in final stages of an Elliott Wave flat correction that can be looking for a base at 49.00-49.50 area."

Most likely intra-day scenario for the price movement in the near future: secondary correction within the primary bullish market condition.

Crude OIL Undergoing A Temporary Correction; More Upside Still In View
  • 2016.10.24
  • www.forexminute.com
Crude oil turned into strong bullish mode in September which looks like an impulsive price move on the 4h chart. We see an extended and sharp leg from 44.14 to 51.50 that looks like wave 3 of an impulsive structure. If that’s true then we know that market is in new bullish phase so uptrend should continue after the wave 4 pullback which can...
 

USD/CAD Intra-Day Fundamentals: BoC Gov Poloz Speaks and 112 pips range price movement

2016-10-24 19:30 GMT | [CAD - BoC Gov Poloz Speaks]

[CAD - BoC Gov Poloz Speaks] = speech before the House of Commons Standing Committee on Finance, in Ottawa.

==========

From official report:

  • "It is our normal practice to appear before this committee twice a year to discuss the Bank’s Monetary Policy Report (MPR). We published our latest MPR last week and are happy to answer questions about it and other economic topics. However, I suspect you may also want to ask about the agreement with the federal government that was announced this morning, which renews our inflation-control framework for another five years. So, before we respond to questions, allow me to say just a few words on both topics, beginning with the MPR."
  • "We expect the government’s measures will restrain residential investment by curbing resale activity in the near term and lead to a modest change in the composition of construction toward smaller units. We estimate that this will leave the level of GDP 0.3 per cent lower at the end of 2018 than projected in July."
  • "Now, it is fair to say that even after years of very low interest rates, the recovery from the Great Recession in many economies remains weak. So it is not really surprising that some are wondering if monetary policy has lost its power. Low interest rates are actually doing a great deal to support the economy. To illustrate this point, if we were to raise interest rates to pre-crisis levels, say 3 to 4 per cent, there would be a significant contraction in the economy, and it is these contractionary forces that we are offsetting with low interest rates."

==========

USD/CAD M5: 112 pips range price movement by BoC Gov Poloz Speaks news event


Opening Statement before the House of Commons Standing Committee on Finance
  • www.bankofcanada.ca
The Bank of Canada is the nation's central bank. We are not a commercial bank and do not offer banking services to the public. Rather, we have responsibilities for Canada's monetary policy, bank notes, financial system, and funds management. Our principal role, as defined in the Bank of Canada Act, is "to promote the economic and financial welfare of Canada."
 

Dax Index: Bullish breakout (adapted from the article)

Daily price is on bullish breakout with 10,815 resistance level to be tested for the bullish trend to be continuing.

  • Chinkou Span line of Ichimoku indicator is located above the price for the bullish breakout to be continuing in the near future.
  • Absolute Strength indicator is estimating the trend as the bullish to be continuing. 
  • "In the short-term, even if new year highs can’t be maintained there will still likely be support around 10700, which is also where the cross-through trend-line off the June lows lies. The trend-line off the June lows was broken on a couple of occasions, and while it passes through a lot of price action the market has still responded to it in recent weeks, so we will continue to view it with some importance."
  • "Ahead at 10860 lies the swing high created on Dec 29, and beyond there we will have to look to 11k (psychological level) and a top-side trend-line (~11050) spanning over the April and August peaks."


If the daily price breaks 10,815 resistance to above on close daily bar so the bullish trend will be continuing.
If the daily price breaks 10,336 support level to below on close bar so the bearish reversal will be started.
If not so the price will be on bullish ranging within the levels.

DAX: Trades to Best Levels of the Year
  • DailyFX
  • www.dailyfx.com
The DAX trades at best intra-day levels of year, looking for best closing prices Likely supported near 10700 on a short-term pullback Eyeing 10860/~11000 next on further strength The last time we discussed the DAX it was trading at the underside of the trend-line off the June lows and horizontal resistance near 10700 formed over the course of...
Reason: