 MetaTrader 5
 Experts
 Indicators
 Scripts
 Libraries
 Storage
Join our fan page

Range compression percentile - indicator for MetaTrader 5

- Views:
- 1070
- Rating:
- Published:
- Updated:
-
 You are missing trading opportunities:
- Free trading apps
- Over 8,000 signals for copying
- Economic news for exploring financial markets
Registration Log inYou agree to website policy and terms of use
If you do not have an account, please register -
 Need a robot or indicator based on this code? Order it on Freelance
Go to Freelance
Need a robot or indicator based on this code? Order it on Freelance
Go to Freelance
The idea behind it
The usual way to gauge "is today quiet or wild" is Average Daily Range percent — today's range divided by the average of the last N days. That's useful, but it only compares against the mean, which hides the shape of the distribution: a market that's mostly calm with occasional huge spike days will have an inflated average that makes ordinary compressed days look less extreme than they actually are. This indicator answers a sharper question instead: out of the last N completed periods, what percentage had a smaller range than today's range so far? That's a genuine percentile rank, built directly from the empirical distribution of historical ranges rather than a single average figure — the same idea used in statistics to describe where an observation falls within its own distribution, applied here to volatility.
Tight statistical compression (a low percentile) often precedes range expansion, which is why compression readings are commonly watched ahead of breakout setups; conversely a very high percentile flags a day that has already moved further than nearly all of its historical peers, which changes how much room may realistically be left.
How to interpret it
- Percentile value — the percentage of the last InpLookbackPeriods completed periods whose full range was smaller than the current period's range so far. 12% means today's range so far is smaller than 88% of the last 100 days.
- COMPRESSED (default blue) — percentile at or below InpCompressionPercentile; the current period is unusually quiet relative to its own history.
- EXPANDED (default red) — percentile at or above InpExpansionPercentile; the current period has already moved further than most of its historical peers.
- NORMAL (default silver) — anywhere between the two thresholds — an ordinary, unremarkable range so far.
- The gauge bar — a simple visual scale from 0 to 100; the marker's position along the track is the percentile itself, so compression and expansion are visible at a glance without reading the exact number.
External variables (inputs)
| Input | Default | Purpose |
|---|---|---|
| InpRangePeriod | D1 | Which timeframe defines one "range" — Daily is typical, but Weekly or H4 work the same way. |
| InpLookbackPeriods | 100 | How many completed historical periods make up the distribution the current range is ranked against. |
| InpCompressionPercentile | 20.0 | Percentile at or below which the status reads "COMPRESSED." |
| InpExpansionPercentile | 80.0 | Percentile at or above which the status reads "EXPANDED." |
| InpUpdateOnNewBarOnly | true | When true, refreshes once per new chart bar; when false, refreshes on every tick. |
| InpPanelCorner | Left Upper | Chart corner the panel is anchored to. |
| InpPanelXDistance / InpPanelYDistance | 12 / 18 | Panel offset from the chosen corner, in pixels. |
| InpFontSize | 9 | Font size used for every row. |
| InpGaugeWidth / InpGaugeHeight | 160 / 10 | Pixel dimensions of the percentile gauge track. |
| InpCompressedColor / InpNormalColor / InpExpandedColor | DeepSkyBlue / Silver / Red | Color used for the Status row and the gauge marker in each of the three states. |
| InpPanelTextColor / InpPanelBgColor | White / Dark Gray | Static text color and panel background color. |
Recommended use
Works on any symbol; the percentile is calculated purely from that symbol's own historical range distribution, so it self-calibrates to whatever volatility regime the instrument is currently in without needing manual recalibration. InpRangePeriod does not need to match the chart's own timeframe — a Daily range percentile can be read from an M15 chart just as easily as from a D1 chart, since the calculation pulls its own data directly via CopyRates() .
A percentile is a description of where today sits relative to its own history, not a prediction — a COMPRESSED reading raises the odds of expansion but does not guarantee it, and an EXPANDED reading does not mean the move is finished. This indicator only reads price data and never places, modifies, or closes any order, so it is safe to run on any account type.
This indicator draws only through its own panel objects and creates no per-bar chart clutter, so it is safe to run alongside any number of other overlays. All chart objects are created under a single internal name prefix and are fully removed via ObjectsDeleteAll() in OnDeinit() when the indicator is detached, so it leaves nothing behind on the chat
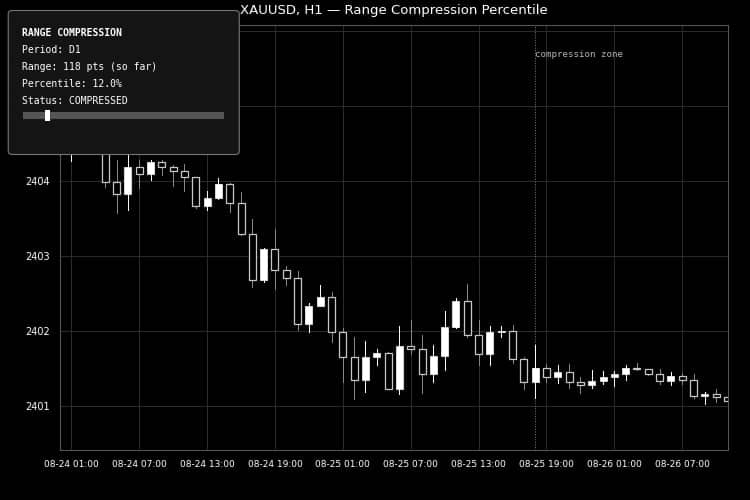
Fig. 1. The compression panel and percentile gauge on XAUUSD H1, flagging a compressed range. Rendered in black and white per the Code Base image guidelines
 PropFirm Defense
A library of 24 MQL5 classes that watches a prop-firm rulebook -- drawdown, daily loss, payout consistency, minimum trading days, news blackout -- against any account, and flattens on breach without ever opening a position of its own.
MSNR Key Levels MTF
MSNR KeyLevels MultiTF draws Malaysian SNR key levels from M5, M10, M15, H1, H4 and D1 at the same time, on any chart you have open. A built-in control panel lets you switch each timeframe on and off with a single click, so you go from a clean chart to full higher timeframe context in a second, and back again just as fast.
MT5 Symbol Changer Profit Display
EMTOrdersUtility is a Real-Time Trade Monitor & Symbol Changer Utility designed for active traders who demand Real-Time visibility into their open positions across multiple financial instruments.
 PulseStrike Scalper - Statistical Burst Detection EA
PulseStrike Scalper - Statistical Burst Detection EA