Join our fan page
- Views:
- 1347
- Rating:
- Published:
-
Need a robot or indicator based on this code? Order it on Freelance Go to Freelance
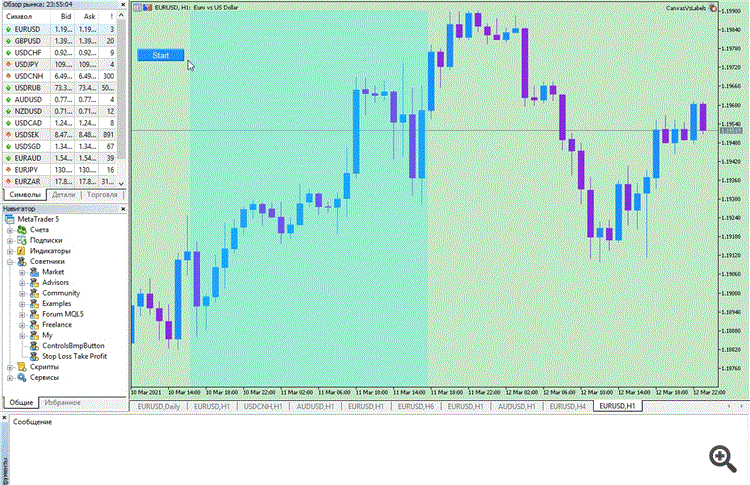
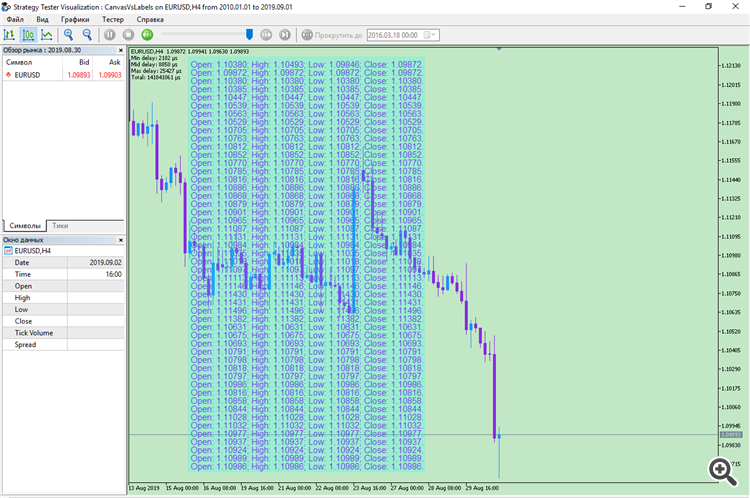
The library contains two types of displays. The first, LabelsDisplay, is based on CChartObjectLabel. The second, CanvasDisplay, is based on CCanvas. The displays are optimised for rendering frequency. Besides the main Expert Advisor demonstrating the work of displays Demo.mq5, there are two more variants, CanvasVsLabelsTester.mq5, to perform measurements exclusively in the tester, on ticks. And the universal CanvasVsLabels.mq5, which performs measurements both in the tester and on the chart. These measurements can be compared with each other. For more details on comparing the speed of displays, please see the link Canvas vs Labels.
//+------------------------------------------------------------------+
//|ChartDisplayDemo.mq5 |
//|Copyright 2021, © Cyberdev |
//| https://www.mql5.com/en/users/cyberdev/seller |
//+------------------------------------------------------------------+
#property copyright "Copyright 2021, © Cyberdev."
#property link      "https://www.mql5.com/en/users/cyberdev/seller"
#property version   "1.00"

//+------------------------------------------------------------------+
//||
//+------------------------------------------------------------------+
#include "cyberdev\ChartDisplay.mqh"

//+------------------------------------------------------------------+
//||
//+------------------------------------------------------------------+
enum OutType {
  otCanvas, // Canvas
  otLabels  // Labels
};

//+------------------------------------------------------------------+
//||
//+------------------------------------------------------------------+
input OutType outType = otLabels; // outType - display type
input int nLines = 50; // nLines - number of lines on the display
input bool optimizeUpdate = false; // optimiseUpdate - optimisation for Labels
input int bWidth = 406; // bWidth - display width
input int lY_Dist = 14; // lY_Dist - distance between lines
input bool back = false; // back - background for Labels

//+------------------------------------------------------------------+
//||
//+------------------------------------------------------------------+
Strings * display;
CChart Chart;

//+------------------------------------------------------------------+
//| Expert initialisation function|
//+------------------------------------------------------------------+
int OnInit() {
  Chart.Attach(ChartID());
  Chart.ShowGrid(false);
  Chart.ColorBackground(C'194,231,197');
  Chart.ColorBarUp(clrDodgerBlue);
  Chart.ColorBarDown(clrBlueViolet);
  Chart.ColorCandleBull(clrDodgerBlue);
  Chart.ColorCandleBear(clrBlueViolet);
  Chart.ColorForeground(clrBlack);
  switch (outType) {
  case otCanvas:
    display = new CanvasDisplay();
    break;
  case otLabels:
    display = new LabelsDisplay();
    break;
  default:
    return INIT_FAILED;
  }
  if ((outType == otLabels && back &&
       !dynamic_cast<LabelsDisplay *>(display).createExt(nLines, 10, 10, bWidth, lY_Dist)) ||
       !display.create(nLines, 10, 15, bWidth, lY_Dist))
    return INIT_FAILED;
  return(INIT_SUCCEEDED);
}
//+------------------------------------------------------------------+
//| Expert deinitialisation function|
//+------------------------------------------------------------------+
void OnDeinit(const int reason) {
  if (CheckPointer(display) == POINTER_DYNAMIC)
    delete display;
  Chart.Detach();
}

//+------------------------------------------------------------------+
//||
//+------------------------------------------------------------------+
#define  concatenate(_rate)                                                         \
 ("Open: " + DoubleToString(rates[_rate].open, digits) +                           \
  "; High: " + DoubleToString(rates[_rate].high, digits) +                         \
  "; Low: " + DoubleToString(rates[_rate].low, digits) +                           \
  "; Close: " + DoubleToString(rates[_rate].close, digits) + ".")


//+------------------------------------------------------------------+
//| Expert tick function|
//+------------------------------------------------------------------+
void OnTick() {
  MqlRates rates[];
  int digits = (int)SymbolInfoInteger(_Symbol, SYMBOL_DIGITS);
  static datetime time = 0;
  datetime cTime;
  static bool firstRun = true;
  bool triggered = false;
  if (CopyRates(NULL, PERIOD_CURRENT, 0, 2, rates) != 2)
    return;
  display.setText(concatenate(1));
  cTime = rates[0].time;
  if (cTime != time) {
    if (!firstRun) {
      display.push();
      display.setText(concatenate(0));
    }
    time = cTime;
    firstRun = false;
    triggered = true;
  }
  if(outType == otLabels && optimizeUpdate) {
    if (triggered)
      display.update();
    else
      dynamic_cast<LabelsDisplay *>(display).updateOne();
  }
  else
    display.update();
}
//+------------------------------------------------------------------+
To update the top line, you need to call the setText method of the class you are using. To shift the text to the line below, the push method of the used class is called . And to display the added/updated text on the display use the update method of any of the classes. In addition to this method, the LabelsDisplay class has an additional method updateOne, which can speed up the display more than 2 times. It is called only when the top line needs to be updated. If the push method was called, then after it you should call the update method instead of updateOne .
Input parameters
- outType - display type
- nLines - number of lines on the display
- optimiseUpdate -optimize for Labels
- bWidth - width of the display
- lY_Dist - distance between lines
- back - background for Labels
With outType you can select the display type from Canvas or Labels values. The nLines change sets the number of lines that will be saved after scrolling by the push method. The optimiseUpdate parameter enables economical updating of only one line, if the push method has not been called and therefore the rest of the lines do not need to be updated (see above). With bWidth you can set the width of the display (relevant for Canvas and Labels using background). With the lY_Dist parameter you can achieve the desired font size. The font size is taken from lY_Dist , from which the part set by the fDec coefficient is subtracted, which allows to change the real line height, not the font size, without taking into account the distance between lines. The back parameter enables the background in Labels mode.
Thus, it is possible to display information in the chart in 5 different modes.
- Canvas
- Labels
- Labels with optimised textoutput
- Labels with Canvas background
- Labels with background, plus, optimisation
Using a background in outType: Labels mode gives about the same load as using other additional chart objects. That is, it slightly increases the time it takes to output text to the display.
Translated from Russian by MetaQuotes Ltd.
Original code: https://www.mql5.com/ru/code/33898
 MultiTester
Multiple runs/optimisations in Tester.
 Pan PrizMA No leverage 72
Construct a moving line with a polynomial of 4 degrees. Extrapolates the sinusoidal and its axial. The constructed lines remove one value at each bar and a sliding line of extrapolated values is constructed which is not redrawn.
 Manual Position Tracking Panel
Panel based on CDialog class. Work on the current symbol. Deleting, setting Take Profit, setting Breakeven on a group of positions
 iCHO Trend CCIDualOnMA Filter
Strategy based on the standard indicator iCHO (Chaikin Oscillator, CHO) and custom indicator 'CCIDualOnMA'

