Join our fan page
- Views:
- 13556
- Rating:
- Published:
- Updated:
-
Need a robot or indicator based on this code? Order it on Freelance Go to Freelance
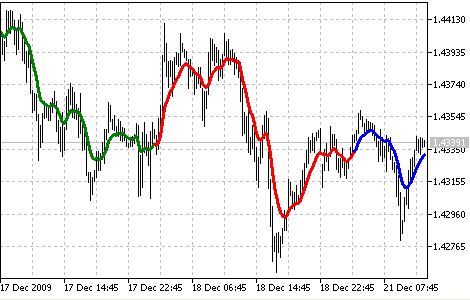
The ColorLine indicator shows the line of the price moving average on the chart.
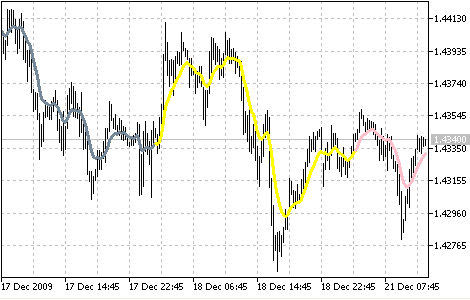
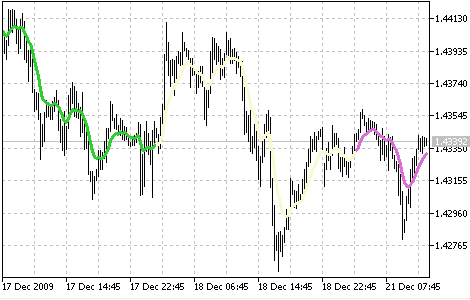
The line has diffrent colors (100 bars has the same color). The color settings of the line is changing every 5 ticks, there are 3 color schemes.

ColorLine, color scheme 1

ColorLine, color scheme 2

ColorLine, color scheme 3
Translated from Russian by MetaQuotes Ltd.
Original code: https://www.mql5.com/ru/code/23
 ColorBars
The ColorBars Indicator paints bars with different colors depending on the volume changes. If the volume has increased, the color is green, overwise the color is red.
 Chaikin Volatility (CHV)
Chaikin's volatility indicator calculates the spread between the maximum and minimum prices. It judges the value of volatility basing on the amplitude between the maximum and the minimum. Unlike Average True Range, Chaikin's indicator doesn't take gaps into account.
 Custom Moving Average
The Custom Moving Average is example of the Custom User Indicator - it calculates and shows the Moving Average.
 DeMarker (DeM)
The Demarker Indicator (DeM) is based on the comparison of the period maximum with the previous period maximum. When the indicator falls below 30, the bullish price reversal should be expected. When the indicator rises above 70, the bearish price reversal should be expected.