Join our fan page
- Views:
- 17026
- Rating:
- Published:
- Updated:
-
Need a robot or indicator based on this code? Order it on Freelance Go to Freelance
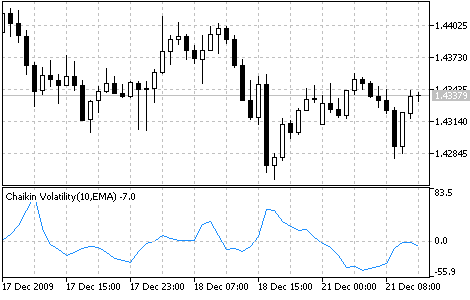
Chaikin's volatility indicator calculates the spread between the maximum and minimum prices.
It judges the value of volatility basing on the amplitude between the maximum and the minimum. Unlike Average True Range, Chaikin's indicator doesn't take gaps into account.
According to Chaikin's interpretation, a growth of volume indicator in a relatively short space of time means that the prices approach their minimum (like when the securities are sold in panic), while a decrease of volatility in a longer period of time indicates that the prices are on the peak (for example, in the conditions of a mature bull market).
We recommend using Moving Averages and Envelopes as a confirmation of Chaikin's indicator signals.
- A peak of indicator's reading appears when market prices rollaway from the new summit and the market turns flat.
- A flat market resembles low volatility. An exit from the side movement (from a flat) is not accompanied by a significant increase of volatility.
- Volatility grows along with the increase in price level over the previous maximum.
- A rise of Chaikin's indicator level continues till a new price peak is reached.
- A rapid decrease of volatility means that the movement is slowing down and that a back-roll is possible.

Chaikin Volatility Indicator
Calculation:
H-L (i) = HIGH (i) - LOW (i)
H-L (i - 10) = HIGH (i - 10) - LOW (i - 10)
CHV = (EMA (H-L (i), 10) - EMA (H-L (i - 10), 10)) / EMA (H-L (i - 10), 10) * 100
where:
- HIGH (i) - maximum price of current bar;
- LOW (i) - minimum price of current bar;
- HIGH (i - 10) - maximum price of the bar ten positions away from the current one;
- LOW (i - 10) - minimum price of the bar ten positions away from the current one;
- H-L (i) - difference between the maximum and the minimum price in the current bar;
- H-L (i - 10) - difference between the maximum and the minimum price ten bars ago;
- EMA - exponential moving average.
Translated from Russian by MetaQuotes Ltd.
Original code: https://www.mql5.com/ru/code/20
 Chaikin Oscillator (CHO)
The Chaikin's Oscillator (CHO) is the difference of moving averages of Accumulation/Distribution.
 Commodity Channel Index (CCI)
Commodity Channel Index (CCI) measures the deviation of the commodity price from its average statistical price.
 ColorBars
The ColorBars Indicator paints bars with different colors depending on the volume changes. If the volume has increased, the color is green, overwise the color is red.
 ColorLine
The ColorLine indicator shows the line of the price moving average on the chart. The line has diffrent colors (100 bars has the same color). The color settings of the line is changing every 5 ticks, there are 3 color schemes.