Join our fan page

i-OrdersMQL5 - indicator for MetaTrader 5
- Views:
- 10625
- Rating:
- Published:
- Updated:
-
 You are missing trading opportunities:
- Free trading apps
- Over 8,000 signals for copying
- Economic news for exploring financial markets
Registration Log inYou agree to website policy and terms of use
If you do not have an account, please register -
 Need a robot or indicator based on this code? Order it on Freelance
Go to Freelance
Need a robot or indicator based on this code? Order it on Freelance
Go to Freelance
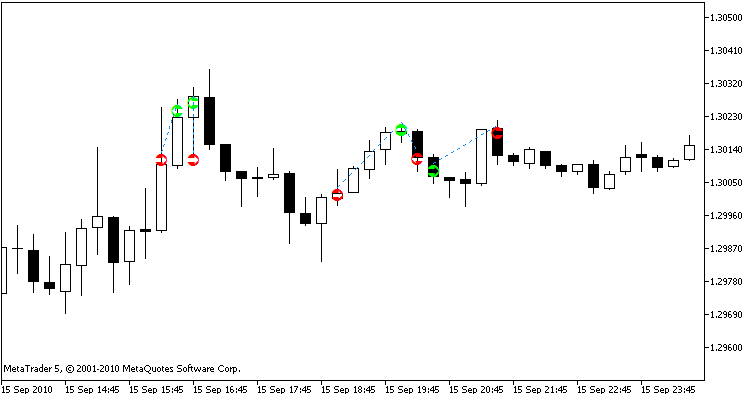
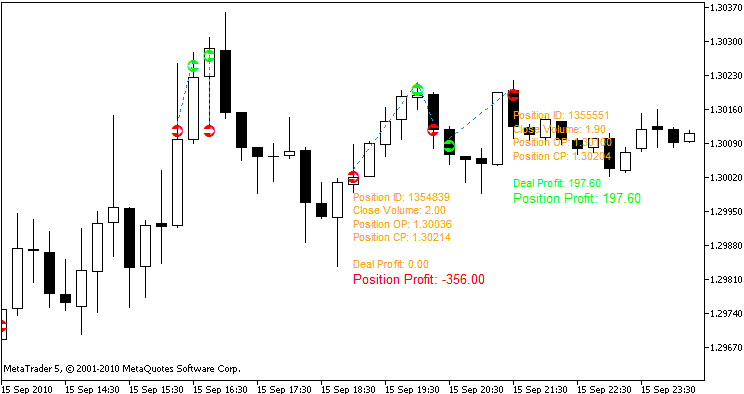
The indicator shows deals history on the chart. The suggestions are welcome.
The chart objects are clickable. The colors can be customized in input parameters of the indicator.
Input parameters:
Language
- Language - language for messages (in this version English and Russian languages are supported).
- ShowCurrentPostion - true - show additional info about the current position.
- CompactPositionInfo - true - show info about the profit only, false - show all info.
- ShowDealHistory - true - show deals history info.
Additional settings
- StartTime - starting time to proceed.
- BuyColor - color of long deals.
- SellColor - color of short deals.
- InfoColor - color of additional info.
- FontSize - font size.
Few figures to illustrate how does it looks:
Figure 1. Show deals history
If you click at any arrow, you can get more information. Click again to hide it.
Figure 2. Show additional info
Translated from Russian by MetaQuotes Ltd.
Original code: https://www.mql5.com/ru/code/208
ClearView - PricePointer, RoundNumberMarker, PeriodSeparator plus template
Enhance your charts by adding intelligent markers for important price points and the start/end of year/month/week/day/session Includes a price pointer that changes color whenever price is near an important price point (e.g. historical high/low)
 s-LastPinkEventDate
Since Terminal build 344 added display of economic calendar news using special graphical objects (OBJ_EVENT). A script that outputs as a demonstration of the Economic Calendar with current economic data, the date of the last major (Pink) event.
Adaptive Moving Average with Bollinger Bands ®
The indicator shows the trend and allows to see a price range.
 Multicurrency OnTickMarketWatch tick event handler
The OnTick event handler is designed to proceed the ticks for a certain symbol. This is the version of Multicurrency tick event handler.