거래 로봇을 무료로 다운로드 하는 법을 시청해보세요
당사를 Facebook에서 찾아주십시오!
당사 팬 페이지에 가입하십시오
당사 팬 페이지에 가입하십시오
스크립트가 마음에 드시나요? MetaTrader 5 터미널에서 시도해보십시오
- 조회수:
- 65
- 평가:
- 게시됨:
-
이 코드를 기반으로 한 로봇이나 지표가 필요하신가요? 프리랜스로 주문하세요 프리랜스로 이동
이 지표는 아직 원시적일 수 있지만 기본적인 아이디어를 실현하고 있습니다. 의견과 제안을 환영합니다.
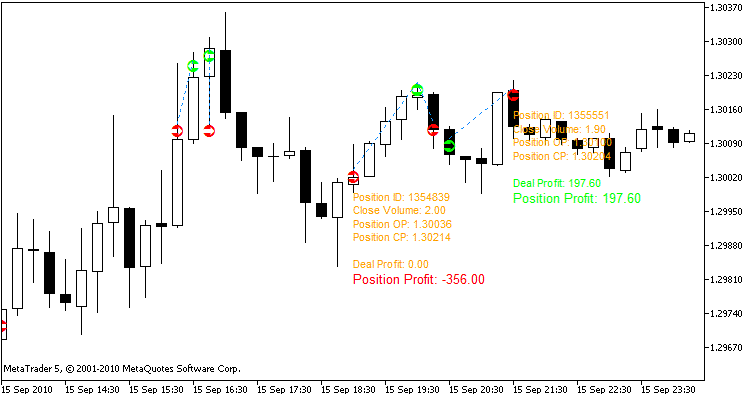
차트의 개체는 클릭할 수 있습니다(아래 설명 참조).
입력 매개변수:
언어
- 언어 - 메시지 언어(이 버전에서는 영어와 러시아어가 제공됩니다).
- ShowCurrentPosition - 참 - 현재 포지션에 대한 추가 정보를 표시합니다.
- CompactPositionInfo - 참 - 수익에 대한 정보만 표시, 거짓 - 더 많은 정보 메시지를 표시합니다.
- ShowDealHistory - true - 거래 내역에 대한 정보를 표시합니다.
추가 표시 설정
- 시작 시간 - 거래 내역을 표시할 시간입니다.
- 구매 색상 - 구매할 거래의 색상입니다.
- SellColor - 판매할 거래의 색상입니다.
- 정보 색상 - 추가 정보의 색상입니다.
- FontSize - 글꼴 크기.
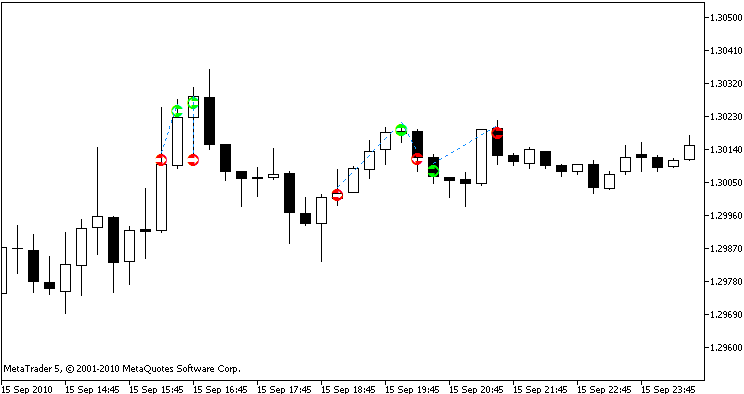
표시기 작동에 대한 몇 가지 예시입니다:
그림 1 - 거래 내역 표시:

화살표 중 하나를 클릭하면 추가 정보를 확인할 수 있습니다. 반복해서 클릭하면 추가 정보가 제거됩니다.
그림 2 - 추가 표시 옵션:

MetaQuotes Ltd에서 러시아어로 번역함.
원본 코드: https://www.mql5.com/ru/code/208
 Intrabar Volume Flow
각 막대 내에서 시간에 따른 볼륨 변화를 시각화한 표시기입니다. 롤링 히스토그램 형식으로 틱 볼륨을 표시합니다.
 A 3 line script that tells you how many bars are on your chart
차트에 드래그하면 전문가 창에 해당 차트에 있는 막대 수가 마법처럼 인쇄되는 스크립트입니다.
 볼린저 밴드를 사용한 적응 이동 평균 ®
볼린저선을 사용한 적응형 이동평균.
 다중 통화 틱 핸들러 온틱마켓워치
터미널의 표준 제공에는 단일 통화 틱 핸들러 OnTick()이 있습니다. 여기에서는 다중 통화 틱 핸들러의 변형을 제공합니다.