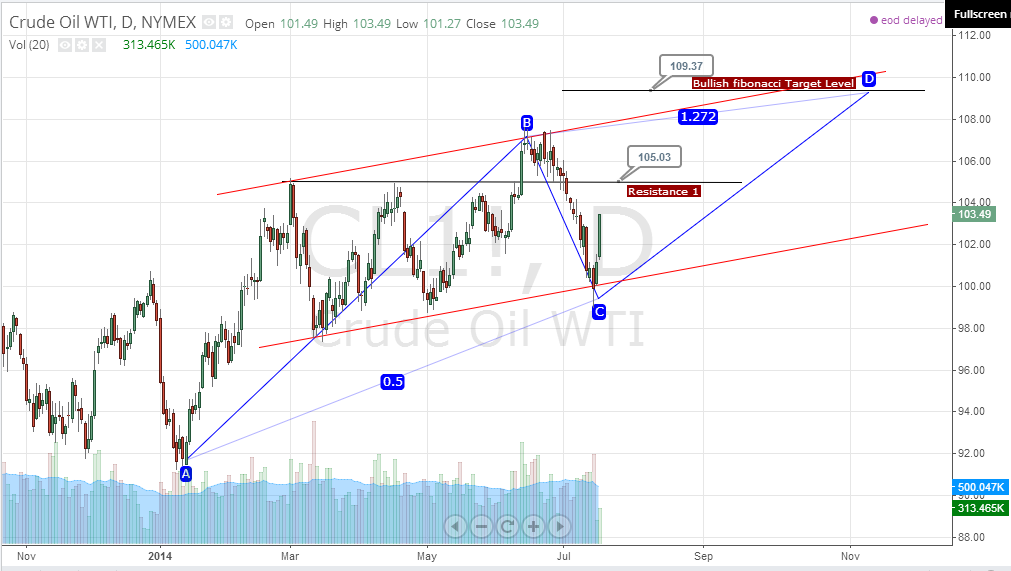
All Blogs / Analytics & Forecasts / Weekly Trends All Blogs Analytics & ForecastsWeekly TrendsForecastsTrading SystemsMy TradingChartsTrading StrategiesStatisticsTrading IdeasScalpingNeural NetworksWave CountMarket NewsCurrencyMetalsCrude OilCompany NewsEventsBanksBrokersLaw/RegulationsOther Rules Weekly Trends Technical Analysis Crude Oil, 18 July 17 July 2014, 22:48 Dian Kemala 0 160 CL found support level at fibonacci 50% inside channel up pattern. 105.03 will be resistance level, and if this level break Ideal target for this ABCD at level 109.37. To add comments, please log in or register Apex Drawdown Zero v7 — One Disciplined Trade a Day, Built on the Daily Box Trading Systems 21 0 Range Breakout Bot MT5 tutorial Trading Systems 28 0 Best Free MetaTrader 5 Tools for Trading Gold (XAUUSD) in 2026 Trading Systems 43 0 Indices rise on weak U.S. data Analytics & Forecasts 32 0 Multilayer Graph of Market Structure: Beyond Technical Analysis Analytics & Forecasts 38 0 Economic Calendar News Indicator for MT5 Analytics & Forecasts 32 0 1 Why a hardcoded account-number check isn't license protection Trading Systems 31 0 The Free EA Most Traders Sleep On Trading Systems 46 0 1 The Black Box Problem Trading Systems 29 0 2 78 EA Apex Trading 90 Fundamental Market Analysis for July 6, 2026 (EURUSD, GBPUSD, USDJPY) 41 Ares Quantum EA forex technical analysis eurusd EUR/USD gbpusd gold usdjpy GBP/USD usd/jpy usd Trading AUD/USD usd/chf S&P 500 forecast usd/cad Fed bitcoin Fxwirepro dax fundamental analysis VistaBrokers Gold spot ($) Silver spot ($) Crude Oil (WTI) USD/TRY audusd EUR forex news ECB


")
