You add a higher-timeframe filter and the average trade improves. Has the strategy improved enough to keep the filter? That question requires the trades it rejected as well as those it accepted. A filter can raise the average result per executed trade while reducing the total result over the same opportunity set. Here is a practical evaluation for a discretionary process supported by TrendLogic.
Define the opportunity before applying the filter
The TrendLogic method description combines a trend, a pullback and a momentum trigger, with higher-timeframe agreement and skip conditions. Its Navigator displays the method's progress and skipped signals. Use those observations to specify exactly which additional decision you want to evaluate, such as your own approval rule after a valid method signal.
Write a base entry, exit, initial stop, sizing rule, session and cost model before looking at outcomes. Then assign every qualifying base opportunity an identifier. At its original decision time, record whether the proposed filter passed or failed using information available at that moment. Keep the base rules intact while comparing the two groups.
For a manual approval process, your filter might be a written requirement that a nearby obstacle leaves enough room for the planned target. That is a research example. The tool's built-in rules remain the reference for identifying its own valid signals. Distinguish your added approval rule in the journal so you can attribute results to the decision being tested.
Follow the denominator through the comparison
Imagine 200 hypothetical base opportunities with simulated results after all modeled costs. Express every result in R, where 1R is that opportunity's initial planned cash loss. Suppose the filter accepts 80 opportunities that earn 24R in total and rejects 120 that would have earned 6R in the same simulation. The accepted average is 24 divided by 80, or 0.30R. The rejected average is 6 divided by 120, or 0.05R.
The base strategy earns 30R across 200 opportunities, averaging 0.15R. The filtered version earns 24R across that same set, averaging 0.12R per original opportunity when skipped trades contribute zero. It executes 40% of the opportunities and retains 80% of the simulated net total. Its average executed trade improved, and its total declined. Both observations belong in the report.
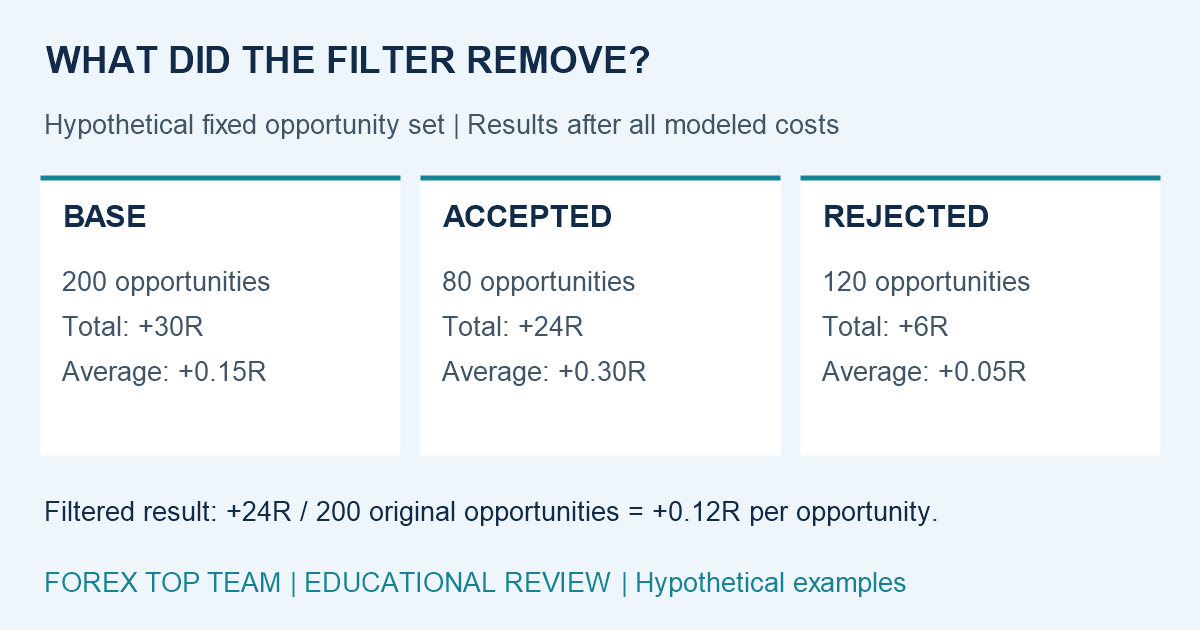 Hypothetical educational example. Values are illustrative.
Now change only the hypothetical rejected group's result to minus 12R. The base total becomes 12R, while the accepted group still contributes 24R. In this second scenario the filter adds 12R to the total by avoiding the rejected group. The difference between the two scenarios shows why the rejected outcomes determine what you can conclude about selection.
Keep rejected results honest
A rejected setup has a simulated counterfactual outcome, meaning an estimate of what would have happened under the base rules. It has no actual trade fill to verify. Preserve the bid and ask assumptions, commission, financing, order timing and cancellation rules used to simulate it. Label ambiguous bars where stop and target were both reachable and examine how alternative sequences affect the group result.
MetaTrader's strategy-testing and optimization settings provide controls for modeled account conditions and commissions. Record the actual configuration with the export. A filter that removes trades during wide spreads can appear to add substantial value when both groups were modeled with an unrealistically narrow fixed spread.
Some filters also change the entry time or price. In that case, keep separate outcomes for entering at the base trigger and entering later under the revised rule. Reusing the earlier entry for an observation approved only after a later close introduces information the original trade could not have used. The guide Trading Pullbacks With Closed-Bar Context shows how to timestamp those decisions.
Check how selection changes portfolio capacity
The simple arithmetic above assumes a fixed opportunity list and independently sized outcomes, with no account-capacity constraint. A deployed strategy can behave differently when one open position prevents another entry. Removing an early trade might free capital for a later one, change an exposure cap, or alter the balance used to size subsequent positions.
After the group comparison, run the full account process with its actual limits. Include simultaneous trades, maximum exposure, daily loss rules and changing position sizes. Compare equity drawdown and capital usage as well as totals. MetaTrader's testing-report documentation describes the platform's balance and equity drawdown measures. Keep the denominator and sizing basis explicit when presenting a comparison.
Freeze one rule for the next sample
Repeatedly editing a threshold until the rejected group looks poor turns the review into parameter selection. Save every version considered, choose a rule, and evaluate it on a later period that did not influence that choice. Inspect results across sessions and market conditions, including the size of each subgroup. A handful of event-driven outcomes can dominate a promising total.
The Forex Top Team Trading Toolkit supplies the TrendLogic Navigator and semi-automatic Assist EA for planning and approved execution. Use a separate research ledger to retain accepted and rejected opportunities. Before keeping an extra filter, explain its effect on average executed trade, total net result, drawdown, trade frequency and the original opportunity set. That makes the approval process something you can evaluate and refine with evidence.