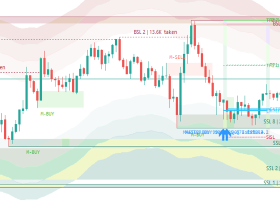
Where Am I Wrong? Using the Volatility Dots Trailing Line for Pullback Entries, Stops and Exits

A breakout is easy to buy out of fear of missing the move. The price of that fear is the stop: to survive the normal noise after a breakout, it has to sit far below the entry, and the target has to be just as far away before the trade is worth taking. Entering on the pullback to a trailing line changes the geometry. The entry moves next to the place where the trend would be broken, the stop gets short, and there is time to prepare the trade instead of chasing it. Volatility Dots draws that line.
A level that moves with the price
A horizontal level marks a price that mattered once, and it stays put. The dot line moves with the price instead, one dot per bar: white dots under the candles act as support while the trend is up, red dots above the candles act as resistance while it is down. Because the distance is a multiple of the average true range, the line scales with each symbol's own volatility; the multiplier is still an input worth checking on your market.
How the line is built
The middle of each bar is the average of its high and low. Around it, two bands are placed at a distance of the multiplier times the average true range, 4.5 times the average of the last 14 bars by default. The trend turns up when a bar closes above the upper band and down when a bar closes below the lower one. Inside a trend the active band can only move in the direction of the trend, never back. That band is the dot. The dot of a finished bar is fixed; the dot of the forming bar moves with each tick.
The entry: after a strong move, at the dots, with confirmation
The routine is simple to state. A market makes a strong move. Instead of buying the move, you wait for the correction back towards the dots. When price is near the dots, you wait for a candle that confirms the trend has resumed, typically a candle that closes beyond the previous candle's extreme in the trend direction, and only then you enter. A pullback that keeps going through the dots is not a pullback any more; when the dots flip, the setup is gone.
If you want this chain checked for you, with a momentum condition and time windows, that is what Signal Confirm does: it calculates its own dots inside and marks the entry candle when trigger, touch and confirmation are complete.
The stop: beyond the dots, set before the entry
For a buy the stop goes below the white dots; for a sell, above the red ones. This is not a matter of taste. The dots mark the price at which the current trend would be considered broken, so a stop beyond them is the shortest stop that still lets the idea be wrong in a meaningful way. And because the entry was taken near the dots, the distance is small and known before the order is placed.
The exit: let the dots trail the second position
In this routine the trade is run with two positions. The first takes a quick target, a modest multiple of the stop. The second has no fixed target: as the market moves in your favour, its stop is moved to the level of the dots, bar by bar. Each move of the stop cuts the risk left in the trade, and once the dots have passed the entry it also locks in part of the move, while the trade keeps room to develop until the dots are finally crossed. One rule has no exceptions: the stop is only ever moved towards the price, never further away from it.
Reading the settings
A larger multiplier gives a slower line with fewer flips and wider stops; a smaller one follows the price closer and flips more often. Nothing is drawn until the average true range has enough bars. For experts, three buffers are available: the dot under the price, the dot above it, and the active band on whichever side it is.
Volatility Dots does not trade and cannot predict the market; it marks where the current trend would break, and the decision is yours. The full workflow, including the risk limits, is in the strategy article. For static levels next to this dynamic one, see Range Zones M30 and Daily Range Ladder.