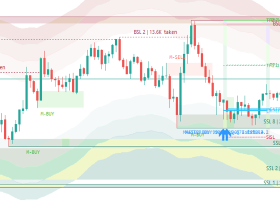
Buy the Pullback, Not the Breakout: An Intraday Trend Workflow Built From Four Indicators

A lot of intraday trouble starts not with the wrong direction but with a decision that had no structure: an entry that was a reaction, a stop that was placed after the fact, a target that was a hope. A workable routine answers three questions in the same order every time: what is on the chart, what it means, and what you are going to do about it. This article walks through one routine built that way and the four indicators that carry it: Signal Confirm, Volatility Dots, Range Zones M30 and Daily Range Ladder.
Step 1. Decide whether the market is worth trading at all
Not every hour of the day offers something worth trading. A quiet session, a range that has gone stale, the minutes right after a news release, a symbol whose spread has just widened: each of these is a reason to leave the chart alone. The routine starts by asking whether there is a clean picture at all. If there is no clear setup, there is no trade, and skipping a session costs nothing.
Step 2. Let strength come first, then wait for the pullback
The trend setup has three parts, and their order matters. First, strength: momentum is clearly on one side, price has closed beyond the previous day's high (or low) and the day has already moved far enough from the previous close to matter. Second, patience: instead of buying the breakout, wait for price to come back to the trailing dot line that follows the move. Third, proof: the first candle that closes beyond the previous candle's extreme in the direction of the trend. One condition finds the market, the next two find the moment.
Signal Confirm runs this chain on M1 with a momentum oscillator on M5 and marks the entry candle when all three steps are done, together with the stop and the target. It does not trade; it shows where a setup completed and, on the prices that followed, how it ended. The details are in the article on the three checks.
Step 3. Know where you are wrong before you enter
The pullback entry exists for one reason: it puts the entry close to the place where the idea is invalidated. Volatility Dots draw that place. White dots under the candles act as moving support in an uptrend, red dots above them act as moving resistance in a downtrend, and the line never steps back against the trend. The stop for a buy goes below the white dots, for a sell above the red ones. Because the entry sits next to the dots, the stop is short and it is known before the order goes in, not after the loss. More on this in the article on the dot line.
There are two other kinds of location worth having on the chart. Static levels are the places where price was already pushed back: Range Zones M30 draws them from 30-minute swing candles, with at most one live zone on each side of the market. Daily distance is the other: Daily Range Ladder measures how far the day has travelled in multiples of the symbol's own typical daily range, so you can see at a glance whether today is an ordinary day or a stretched one.
Step 4. For turns, ask for a level on the left
Reversal trades work on different logic. The checklist is short: a market that has been moving sideways, a fast move to one edge, a level on the left where price has already turned before, and a pattern at that level that confirms the rejection. If price arrives at the level and there is no pattern, there is no trade. The method grades a turn by how many facts line up: a stretched market, a level where price turned before, and a pattern at that level. A rejection zone supplies the level; the daily ladder shows how stretched the day is in terms of its usual range. The Range Zones M30 article and the Daily Range Ladder article show how to read each one.
Step 5. Exits and risk, decided before the entry
Every position carries its stop and its first target from the moment it is opened. The target is a modest multiple of the stop, 1.5 by default in Signal Confirm, not an open-ended hope. When the trade has moved a set distance in your favour, the stop goes to break-even and the planned risk on the position is off the table, apart from spread, slippage and gaps; Signal Confirm's replay uses half of the stop distance for that. A position that sits still for a quarter of an hour after the entry is telling you the move did not come; break-even or a close is a valid answer. If you run a second position on the same idea, it gets no fixed target: the stop follows the dots for as long as the trend lasts, and it is only ever moved toward the price, never away from it.
The risk side is deliberately dull. One to two percent of the account per trade, one percent as the default, and both positions together stay inside the limit you set. A daily loss limit of three to four percent ends the trading day. No averaging down, no martingale, no locking a position with its opposite.
Two honest notes
Execution is part of the method. Stops measured in a handful of points behave differently on a feed with a wider spread or slightly different quotes, so check the setup on your own broker's prices before trusting any distance. And this is a discretionary routine: the indicators show where the conditions are met, the trader decides whether the moment is good enough. Each of the four tools measures something, none of them opens orders, and nothing here promises that the routine will make money: test it on your own symbols and prices, on a demo account, before risking real funds.
The tools in this workflow:
- Signal Confirm - marks the trend setup when trigger, touch and confirmation are complete, with stop, target and lot size.
- Volatility Dots - the trailing dot line for entries on the pullback, stops and trailing exits.
- Range Zones M30 - rejection zones from M30 swing candles, the level on the left for turns.
- Daily Range Ladder - six daily levels scaled to the symbol's typical daily range.