

The backtest won. The account lost.Read this before you buy any EA, including ours. Every way a backtest can mislead you, by design or by accident, in plain language, with the numbers we measured on our own robots. |
We build trading robots. While building three of them for gold, Relay, Assay and Goldworks, we ran thousands of backtests and studied other products by watching how they trade. We learned that most robots which lose money live were never going to win. Some were built to look good in a screenshot. Many fooled their own developer first. Often nobody had to lie at all.
This post collects all of it, from the oldest trick to the newest machine-learning mistake, with the figures we measured ourselves. No product is named. What matters is the trick, so you can recognise it anywhere.
| Built to look good Grids and martingales, a big stop with a small target, a hand-picked date range, a small edge blown up, a manipulated record. | Fooling yourself Fitting the past, picking the best of a thousand tries, machine learning that memorises, a tester set up to flatter. | Nobody lied The broker, the costs, the delay, the start date, a changing market. Honest robots meet these too. |
1. Picking up coins in front of a steamroller
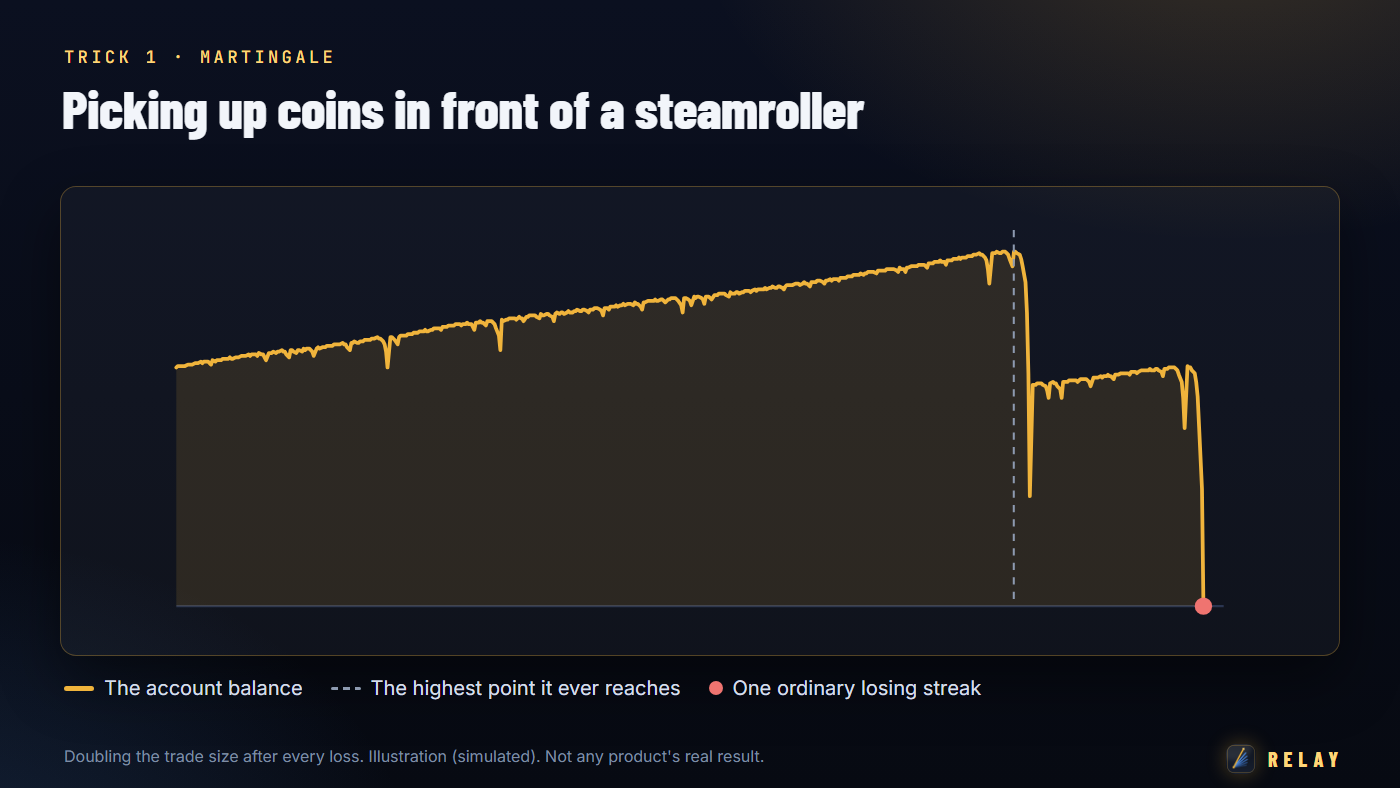
Martingale doubles the trade size after every loss, so the first win pays back everything plus a little. Grid opens another position each time price moves against the last one, and closes the whole basket on a small bounce. Both win almost every week, so the curve rises smoothly for months.
The catch is arithmetic. Each doubling makes the next loss twice as large, and the account can only pay a limited number of them. Sooner or later an ordinary run of losses, the kind every market produces, asks for more than the account has. Months of coins are returned in one afternoon, with the rest of the deposit. It is not a question of whether, only when.
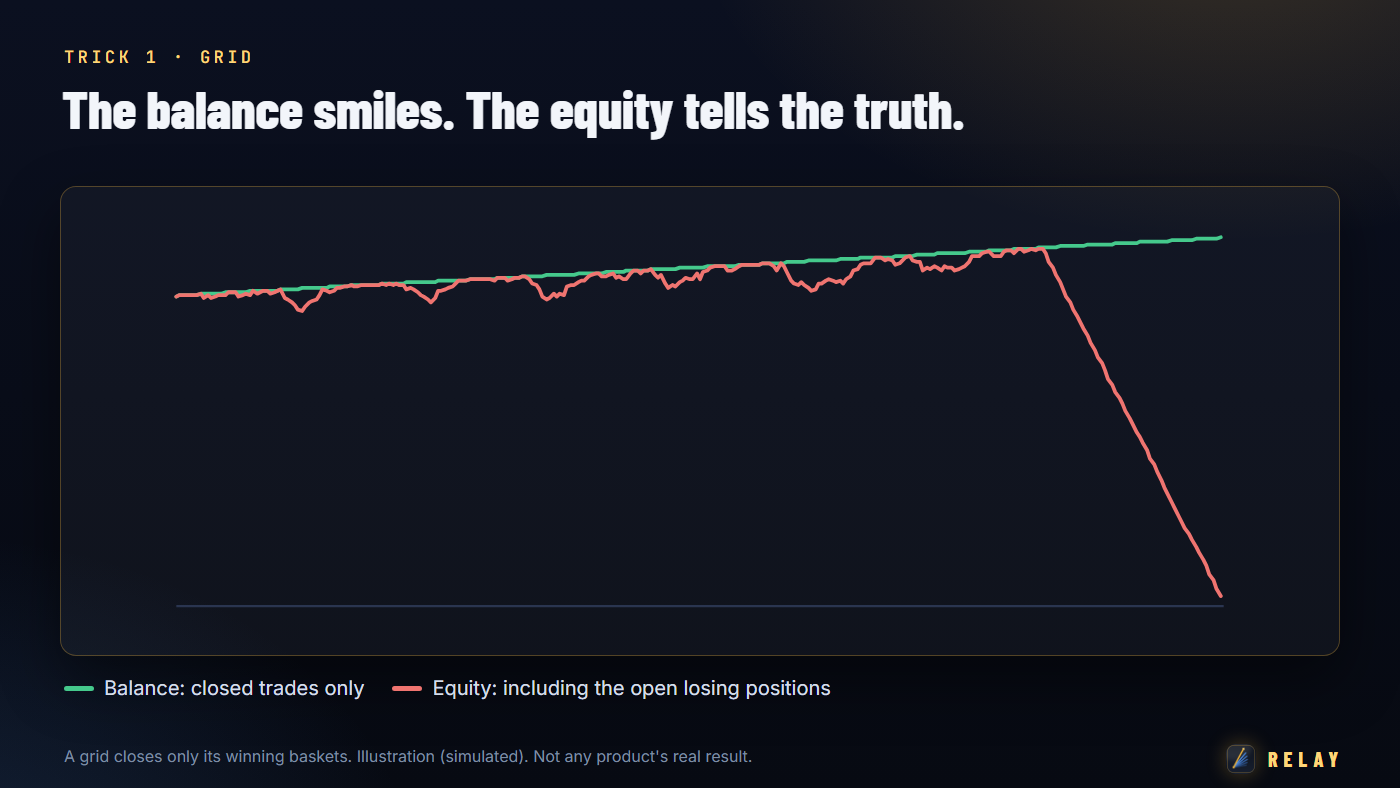
| Why the screenshot looks perfect. A grid closes only its winning baskets. The balance line, which counts closed trades only, rises like a ruler. The losing positions stay open and do not count yet. The equity line, which includes them, is the truth, and it is often far below. Many sales pages show only the balance. How to spot it: ask for the equity curve, not the balance curve. Look for trades with no stop loss, positions held for weeks, a lot size that grows after a loss, and a "maximum drawdown" quoted from the balance. |
2. 95% wins, and still losing money
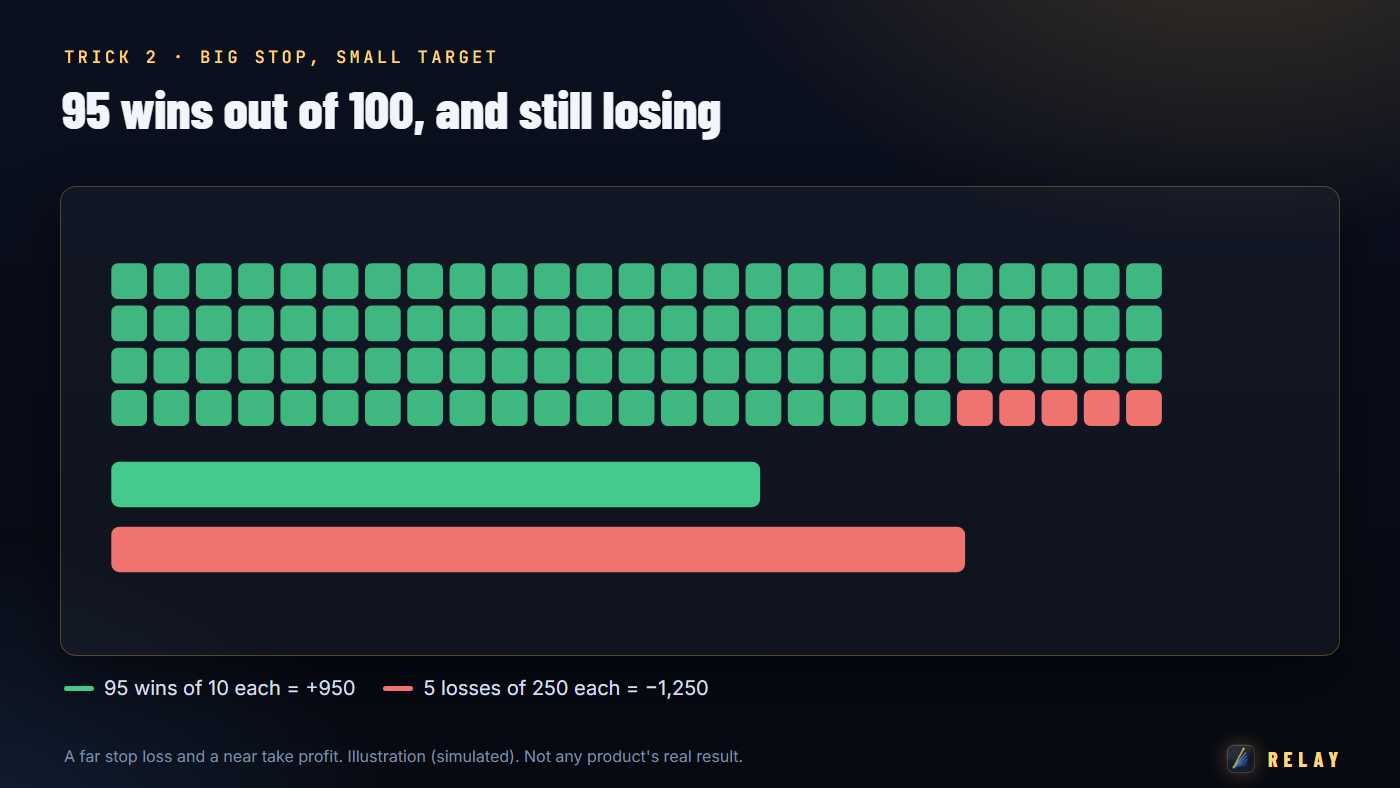
The easiest way to sell a robot is a high win rate. The easiest way to make one is a far stop loss and a near take profit. Price touches a near target most of the time, so the robot wins 95 trades out of 100. But each loss is 25 times the size of a win. Ninety-five wins of 10 make 950, five losses of 250 take 1,250, and the account is down 300 while the advertisement says "95% accurate".
What we measured. A dip-buying family we studied reached a win rate of 82 to 88 percent mechanically, and over ten years made between minus 240 and plus 269 dollars, statistically nothing. On one of our own robots, an exit that locked in small gains raised the win rate in all 68 settings we tried and lost money in all 68. An indicator's own panel showed 53.8% wins; counted honestly, with break-even exits not booked as wins, it was 21.1%.
| How to spot it: ignore the win rate. Ask for the average win and the average loss, and the largest single loss in the test. If one loss erases weeks of wins, the win rate is the product, not the profit. |
3. Date fixing: the window is the product
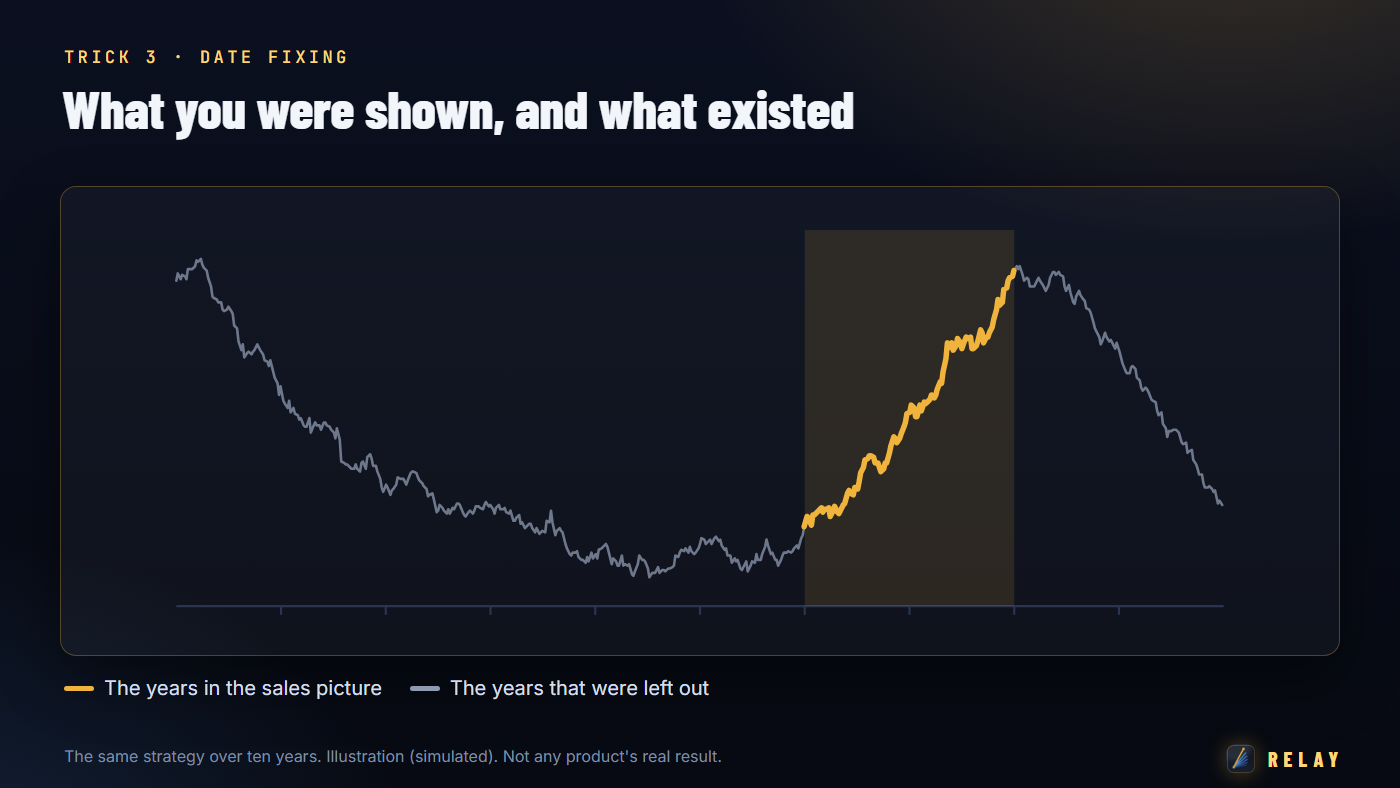
Every strategy has good years and bad years. A backtest can start and stop on any date, so a seller can simply show the stretch where the robot happened to work, and leave out the years before and after. The developer's own bad period disappears the same way: start the test the month after it.
What we measured. On one of our robots, the same settings started on 1 January instead of 27 January 2026 made 13,292 instead of 1,954 dollars. After an improvement, 2026 from 1 January showed plus 17,329; the same year from 1 February showed minus 447. Nothing about the robot changed, only the first day of the test.
| How to spot it: ask why the test starts and ends where it does. Ask for each year separately, and for the year before the one shown. Run the free demo in the Strategy Tester over a period the seller did not choose. |
4. A small edge, blown up to the sky
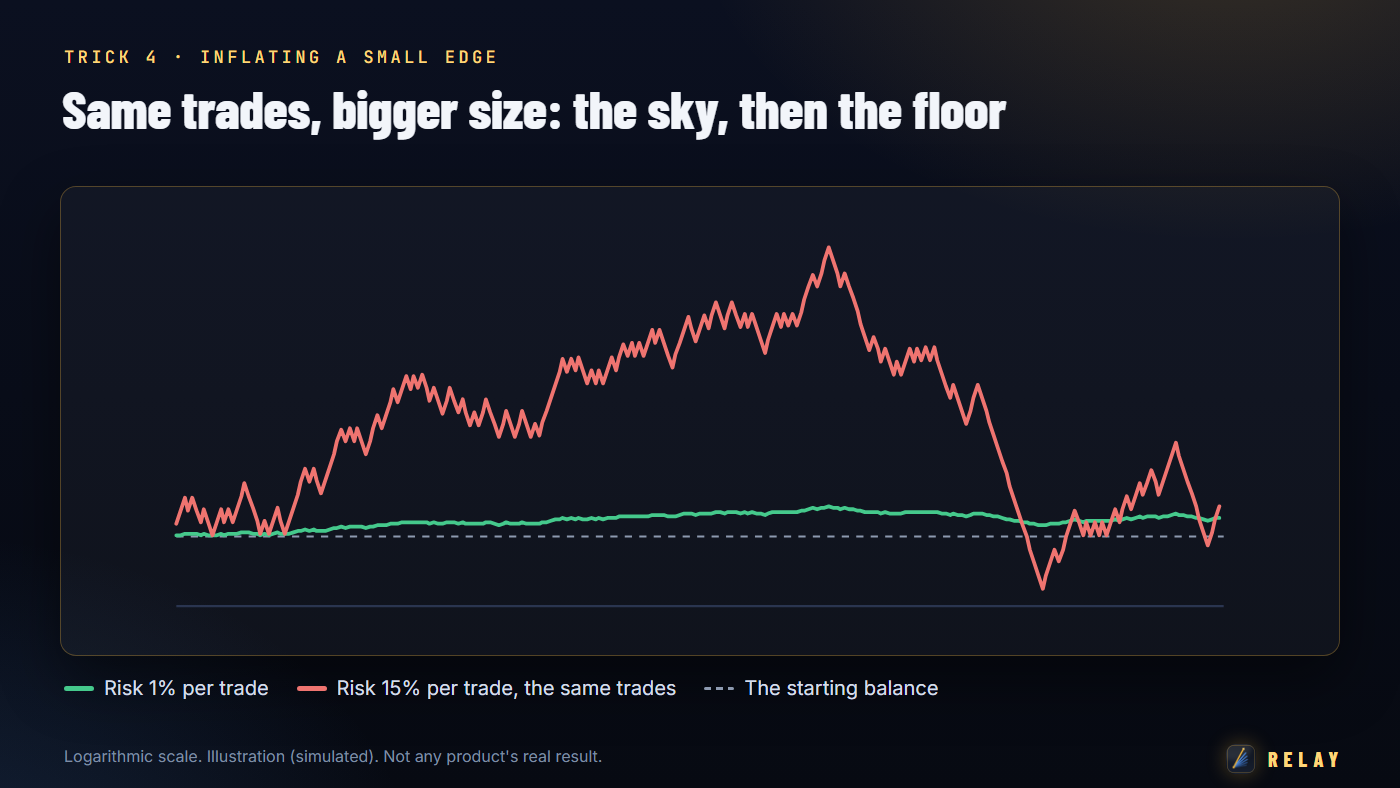
A robot with a thin real edge can be made to look spectacular. Raise the risk per trade and let the profits compound, and a modest result becomes "plus 1,800 percent". The same size that builds the curve destroys it at the first ordinary losing streak; the screenshot is taken before.
What we measured. One of our own robots showed plus 1,849 percent in a year on a 1,500-dollar account, with a worst equity drawdown of 61.6 percent behind it. The percentage stayed between 1,506 and 1,849 at every deposit from 1,500 to 25,000 dollars: it measured the lot-size rule, not a bigger edge.
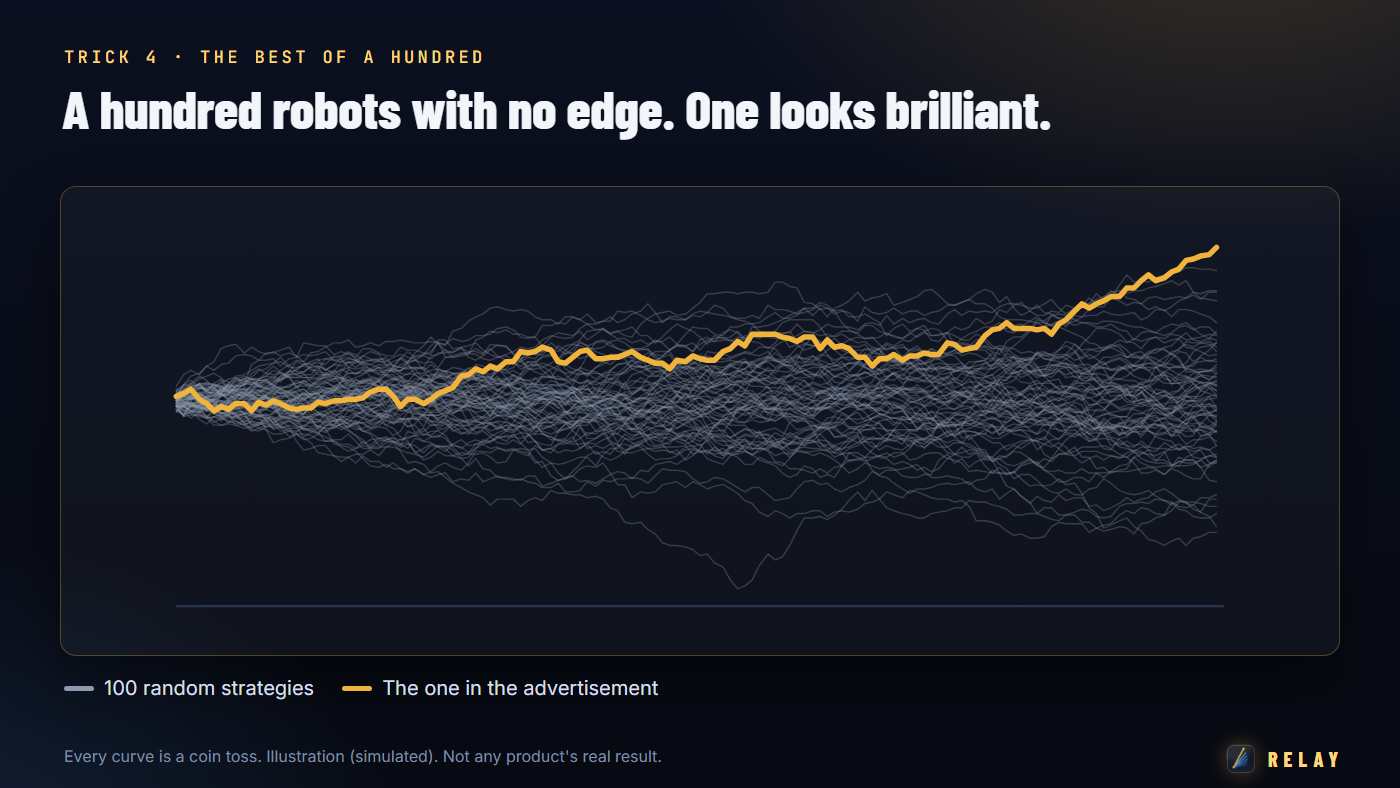
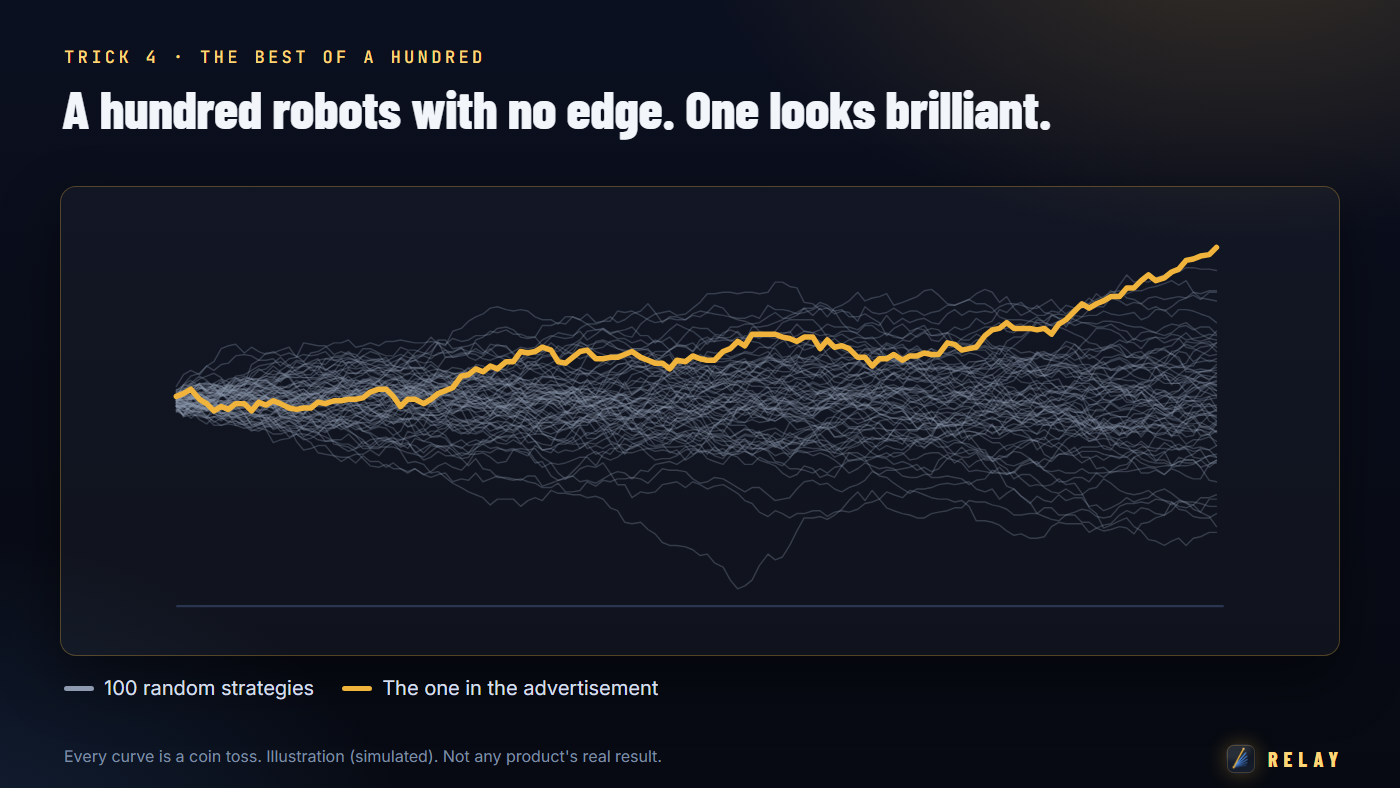
The best of a hundred coins. Test enough variations and one of them will look brilliant by pure chance. An optimizer does exactly this, thousands of times a minute. We tested all 420 combinations of two settings on each of two years: seven of the ten best settings for 2025 fell apart in 2026, earning 790 to 1,265 where our own values earned 2,833. When we searched thousands of trading rules, the best real rule was no better than the best rule found in shuffled, meaningless data. And a setting that looks perfect can sit next to a cliff: on one of our robots a size step of 400 earned 12,376, 350 earned 4,879, 300 earned 12,522 and 250 earned 4,938.
A robot that knew the past. One product we studied, by its behaviour only, won 81.2 percent of its trades where a fair game would give 38 percent. Moving the same trades by one day dropped it to 39.7 percent, and its timing broke down completely after a date in July 2026. It behaved less like a strategy than like a robot given the answers for the history it was tested on.
| How to spot it: a percentage return without the drawdown beside it means nothing. Ask how many versions were tested before this one. Ask for results on data that was not used to choose the settings, and for what happens to the result when each setting is moved one step. |
5. Machine learning: brilliant on known data, lost on new data
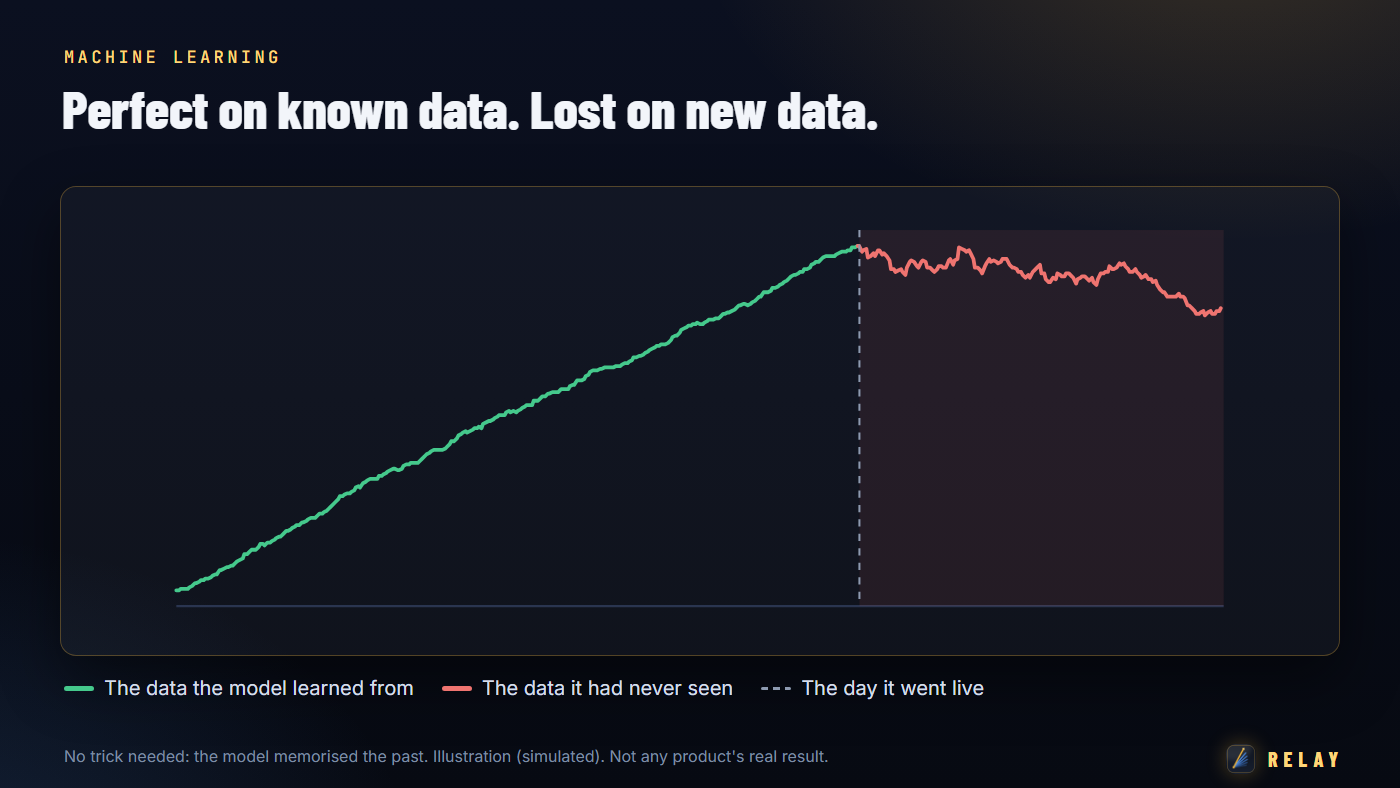
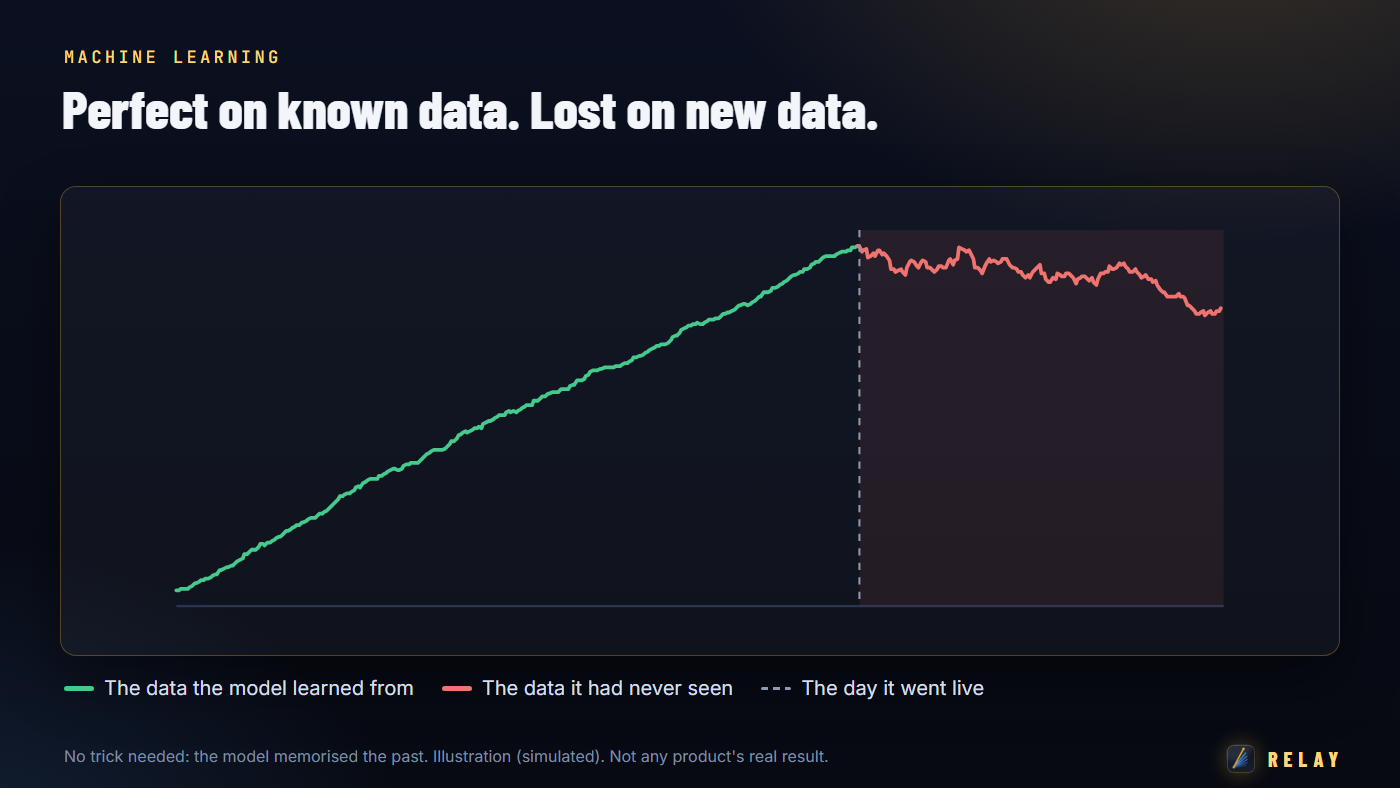
This one needs no dishonesty at all. A flexible model shown the past will learn the past, including its noise, perfectly. On data it has already seen it is almost never wrong. On the next month, which it has not seen, it is often no better than a coin. "AI" on the box is not evidence of anything.
What we measured. A boosted model fitted to our own trades scored a perfect 1.000 on the data it learned from and between minus 0.02 and minus 4.11 on data it had not seen. Its ability to tell good trades from bad on new data scored 0.38 to 0.51, where 0.50 is a coin flip. On Goldworks, an entry filter that multiplied profit 2.7 times on its training data lost money on both test periods. A price model that looked strong on known bars was flat on new ones, and its results changed sign with the holding time.
| How to spot it: ask for results on a period that came after the model was finished, untouched by any tuning. Be wary of near-perfect training scores, of tests that shuffle time, and of "it adapts to the market" with no out-of-sample proof. |
6. The tester can be told what to say
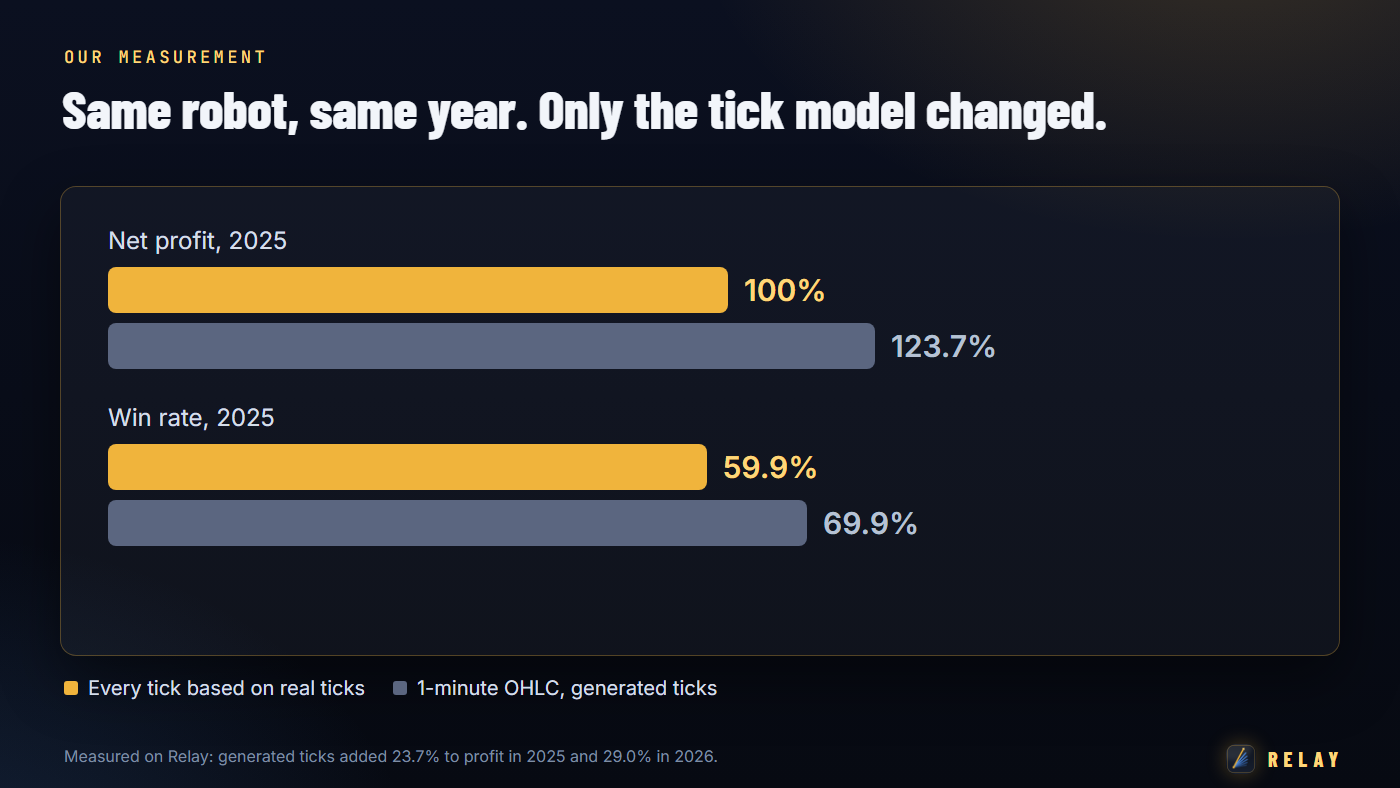
The MetaTrader Strategy Tester is honest, but it answers the question it is asked. Cheaper modelling, missing costs and perfect execution all make the same robot look better.
| Generated ticks. Same robot, same two years, only the tick model changed: the 1-minute model added 23.7 and 29.0 percent to net profit and 10 to 13.7 points to the win rate. | "Real ticks" that were not. A report we had treated as real ticks showed a history quality of 0 percent: the computer never had the data. Every result from it had to be re-run. |
| Costs left out. The tester's spread setting changed nothing in our runs. Priced by arithmetic, 20 extra points cost about 4 percent of a year and 45 points about 8 to 11 percent. | Perfect execution. With a delay of 500 milliseconds our trend robot lost 11.8 percent of a year; with 2 seconds, 53.5 percent, and drawdown tripled. |
| Two brokers, four times the dollars. Identical robot and settings: plus 2,210 on one broker's history and plus 550 on another's in the same year. | One bar of the future. A study that peeked one price bar ahead "proved" 76 percent accuracy. Fixed, it was a coin flip, 40 to 56 percent. |
A product we studied advertised a profit factor of 6.24. Re-run on the same machine it was below 1, and over 13 live weeks it made 1.94: in the backtest every loss was exactly one unit of risk, live the average loss was more than three. The backtest belonged to one download of tick data, not to the strategy.
| How to spot it: the report must say "every tick based on real ticks" and show a history quality near 100 percent. Check that spread, commission and swaps are included. Run the demo yourself on your broker's data. |
7. The mistakes we made ourselves
The honest kind is the most common, so here are ours. We publish them because each one would have reached a buyer if we had not caught it.
- We quoted the wrong drawdown. This very week, on our own sales images, we first read the "Maximal" drawdown row (19.9%) instead of the "Relative" one (29.6%), the true worst percentage. It was corrected before release.
- Our research tool read the future. A shortcut calculator said an idea improved every strategy. In the real tester it made 576 dollars where the shipped rules made 15,801. Three studies built on it were withdrawn.
- Comments that lied about the code. In one day six defects were introduced and caught, three of them in the fix for the previous three, and two were comments describing what the code did not do. None was found by a backtest; all were found by reading.
- A result that was one October. More than once, a promising rule turned out to be one good month. It was rejected because the next year disagreed.
8. How it empties accounts
| The business model behind most of this is simple: sell the curve, not the strategy. A smooth backtest, a high win rate and a large percentage are cheap to produce, and they sell. A launch price, "only a few copies left" and a countdown hurry the decision. A live signal with a few weeks of history, a demo account or a cent account stands in for proof. The buyer attaches the robot and, for a while, it does what the picture showed: the steamroller has not arrived yet. When the losing streak comes, the account goes with it, usually after any refund window has closed. The buyer blames his own broker, settings or luck. The seller sells the next robot, with the next perfect curve. |
9. Before you pay: a ten-point check
| 1 | Is every trade protected by a stop loss on the broker's server from the moment it opens? |
| 2 | Does the lot size ever grow after a loss? (That is martingale, whatever it is called.) |
| 3 | Are you shown the equity curve and the equity drawdown, not only the balance? |
| 4 | Average win against average loss, and the largest single loss: what does one bad trade erase? |
| 5 | Why does the test start and end where it does? Results year by year, including the bad ones? |
| 6 | "Every tick based on real ticks", history quality near 100%, spread and commission included? |
| 7 | Results on data that was not used to choose the settings? |
| 8 | The drawdown beside every percentage, and the risk setting it was made on? |
| 9 | A live record long enough to contain a bad month, on a real account? |
| 10 | Does the seller tell you when and how the robot loses? If not, assume nobody has looked. |
10. What we did differently with Relay
We wrote this post because Relay is sold next to products that use these tricks, and the only answer we have is to show our work. Here is each trick, and what Relay does instead.
| No steamroller. No grid, no martingale, no averaging down, no recovery multiplier. One trend position at a time, and a stop loss sent with every order. | No hidden window. Every backtest starts on 1 January 2025, the start of the market Relay was built for, and every year is shown in full, the weaker one included. Earlier years may test flat or negative, and the EA itself says so on the chart. |
| The bad number first. The worst drawdown, 29.6 percent of equity on the default very high risk settings, is printed in red beside the profit, from the correct report row. | Real ticks only. Every figure is "every tick based on real ticks", 99 percent history quality, and we tell you another broker's numbers will differ. |
| Predictions before results. Every experiment's expected outcome is written down before it runs, and every fix must reproduce the previous results deal for deal before it ships. | Our mistakes in public. The wrong drawdown row, the tool that read the future: we tell you, and the user guide marks every figure that came from an earlier build. |
| None of this means Relay cannot lose. It will have losing trades, losing weeks and drawdowns, and if gold's market regime changes it will be re-validated for the new one. What it does not do is hide them from you. Send us a message through MQL5 for the full user guide and a gift, and judge it on the numbers. |
Trading leveraged products carries a substantial risk of loss and is not suitable for every investor. Past performance, including any backtest, does not guarantee future results. This post is education, not financial advice.



