Ranking EAs by profit factor, return or drawdown is useful for comparing them individually. It is not enough to choose a portfolio. Several top-ranked strategies may all depend on the same market behavior and experience their worst losses together.
Portfolio construction adds a different question: what does each candidate contribute alongside the others? A strong addition needs credible standalone evidence, but it also needs to be assessed in relation to the weaknesses already present.
Different trading ideas have different weak conditions
Trend-following systems can benefit from sustained directional moves and struggle in choppy ranges. Mean-reversion systems can behave differently, finding opportunities in sideways conditions but suffering when a strong trend persists. Breakout systems may benefit from expanding volatility while losing through repeated false breaks.
These are general examples, not a specification of the modules in an EdgeDriven product. They show why one all-purpose EA is not the only possible objective. Strategies with different strengths and weaknesses may complement one another, without any promise that one will always offset another's loss.
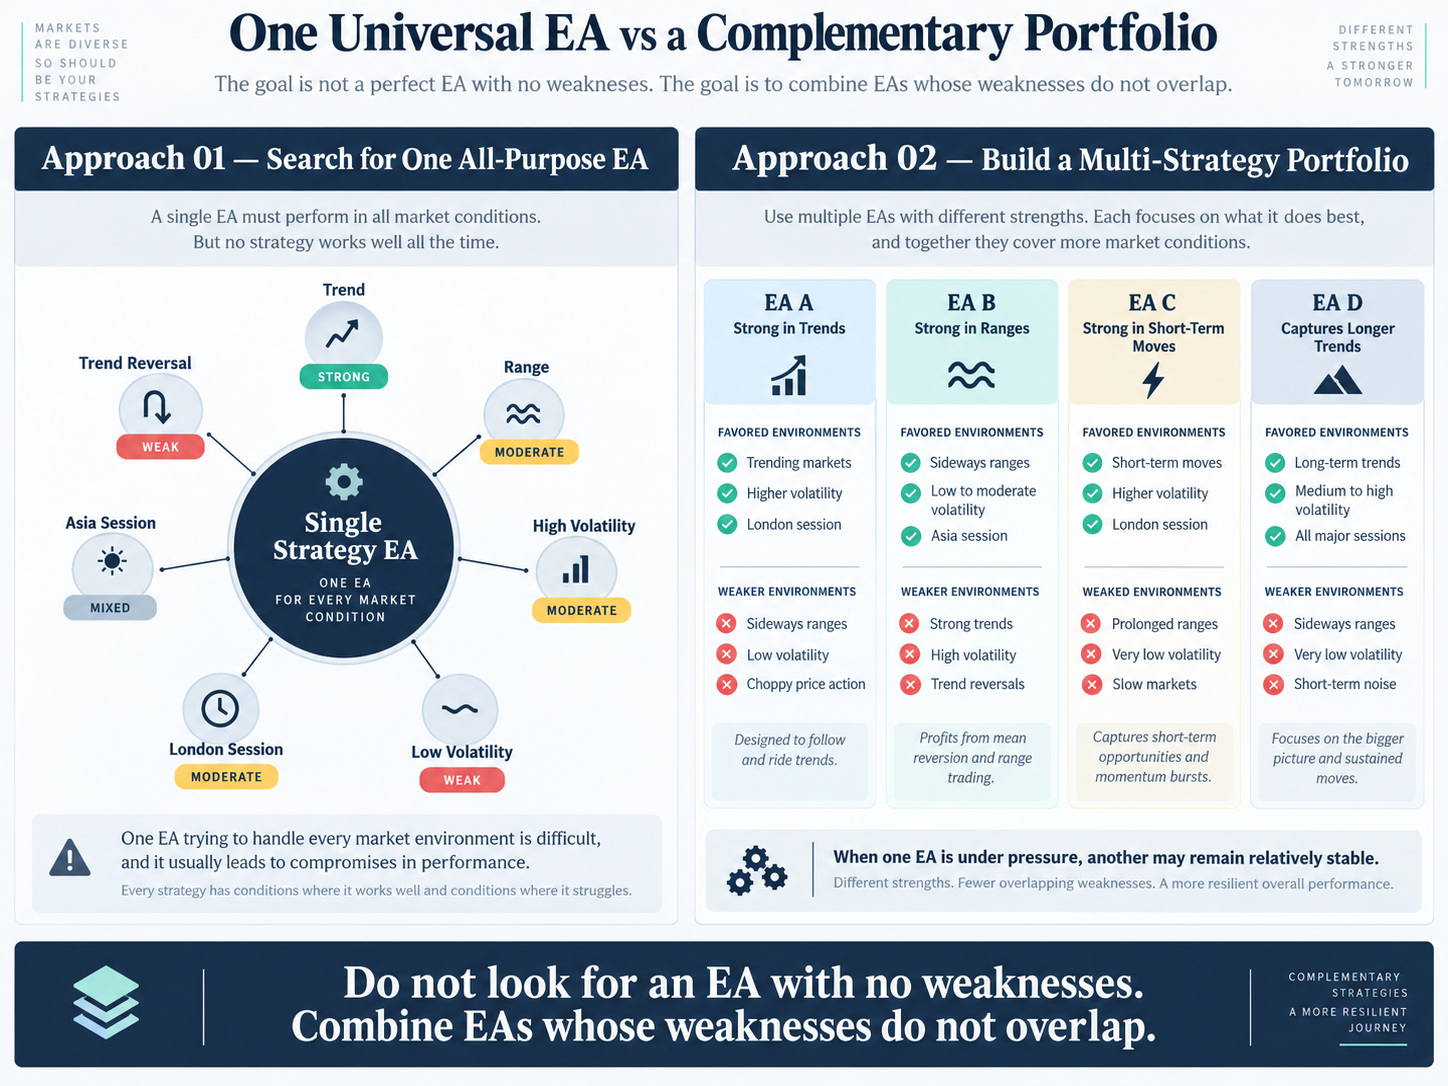
AI-generated illustration with hypothetical strategy profiles, not measured characteristics of product modules.
Compare the places where the strategies struggle
A market-regime matrix is one way to organize the comparison. Put strategies against trending markets, ranges, high and low volatility, and trend reversals. Examine where performance is stronger, weaker or uncertain. Treat the columns as conditions that can overlap, not as independent sources of risk: a trend can also be highly volatile.
The useful information is not only the number of favorable cells. It is whether the unfavorable cells line up. Three strategies that all struggle in reversals can leave the portfolio with a concentrated weakness, even if each has attractive average results. A group with difficulties in different conditions may offer a more useful combination.
The matrix is a starting hypothesis, not proof of diversification. Labels such as trend, range and breakout do not fully describe behavior. Holding period, entry and exit timing, session, symbol, directional bias and sensitivity to volatility or macro events can make similarly named strategies behave differently.
The proposed complementarity therefore needs to be checked against the actual profit-and-loss and exposure records.
The best addition need not have the highest standalone PF
A candidate with a somewhat weaker individual result may be more valuable if its drawdowns overlap less with the existing portfolio. Conversely, a higher-ranked candidate may add little if it repeats a risk already carried in size.
This is not a reason to relax standalone quality requirements merely to obtain a different curve. It is a reason to distinguish qualification as an EA from usefulness in a specific combination.
Nor should every constituent be expected to win in the same month. The objective is to limit overlapping losses, not to require synchronized profitability. A losing period needs to be interpreted in light of the strategy's role and the portfolio's behavior, rather than its isolated monthly ranking.
Evaluate the combined account, not just the approved components
Once the EAs are combined, reassess portfolio drawdown, return correlation, loss overlap and simultaneous exposure. Several strategies can become concentrated in the same symbol, currency, direction or market condition even though they passed individual tests.
Make the capital and risk assumptions explicit when reading the combined curve. The historical result needs to show the behavior of that combination under those assumptions, not merely place several attractive individual curves next to each other.
The next figure is a constructed example with four equal starting allocations of 25% and no rebalancing. The portfolio line is their point-by-point average. The staggered losses reduce its drawdown, but do not remove it: the combined maximum balance DD is about 0.71%. These are teaching calculations, not a product backtest.
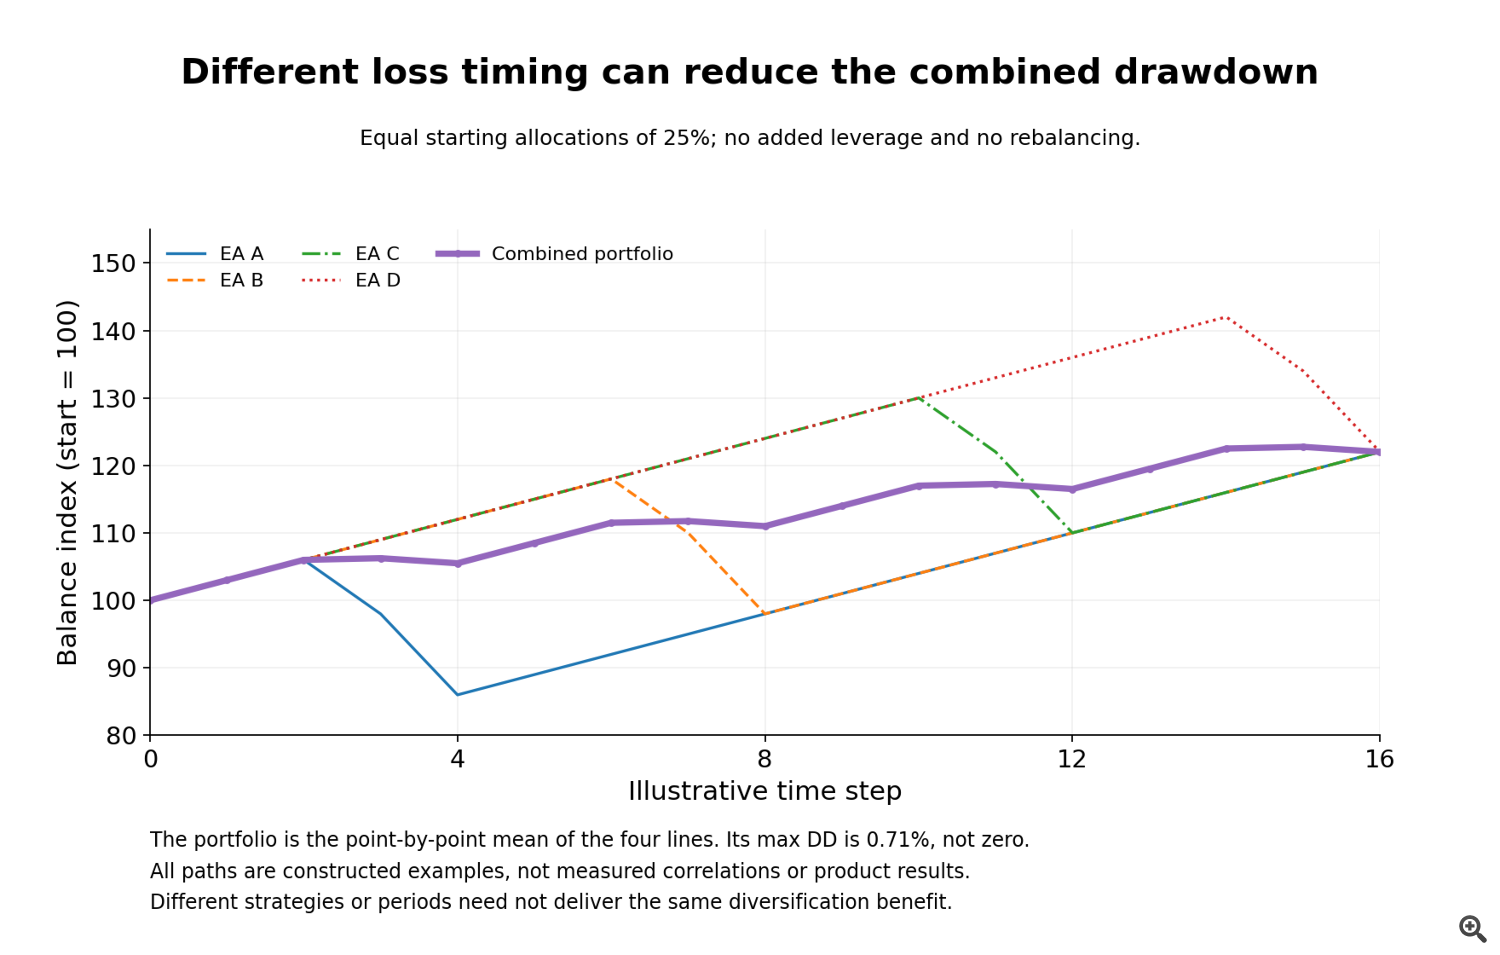
Calculated hypothetical example. The thick line is the mean of the four paths, with no added leverage. The allocation is illustrative, not a product setting or recommendation.
Staggered drawdowns can make a combined path shallower, but that outcome must be checked rather than assumed. Stress can increase correlation, liquidity can deteriorate, and strategies that usually behave differently can lose together.
Diversification and risk scaling are separate decisions
A smoother historical portfolio does not automatically justify larger risk per EA. The historical timing of losses may not persist, so increasing exposure because the curve looks smoother needs its own assessment.
Complementarity is better treated as a way to use a given risk budget with less concentration. The candidate question becomes: which existing weakness does this EA repeat, and which does it help diversify?
An informative portfolio description answers that question alongside the standalone results. It gives a reason for the combination beyond the fact that its constituents ranked well on their own.
Product details and testing conditions
For a portfolio EA, look for a result for the actual combination and its stated risk settings, not just its components.
Specifications, published historical results and operating limits: EdgeDriven Gold Portfolio — XAUUSD · EdgeDriven Dollar Yen Portfolio — USDJPY.
The examples in this article explain evaluation methods; they are not test results for those products. Historical simulations do not guarantee future results. Leveraged trading can cause substantial losses.