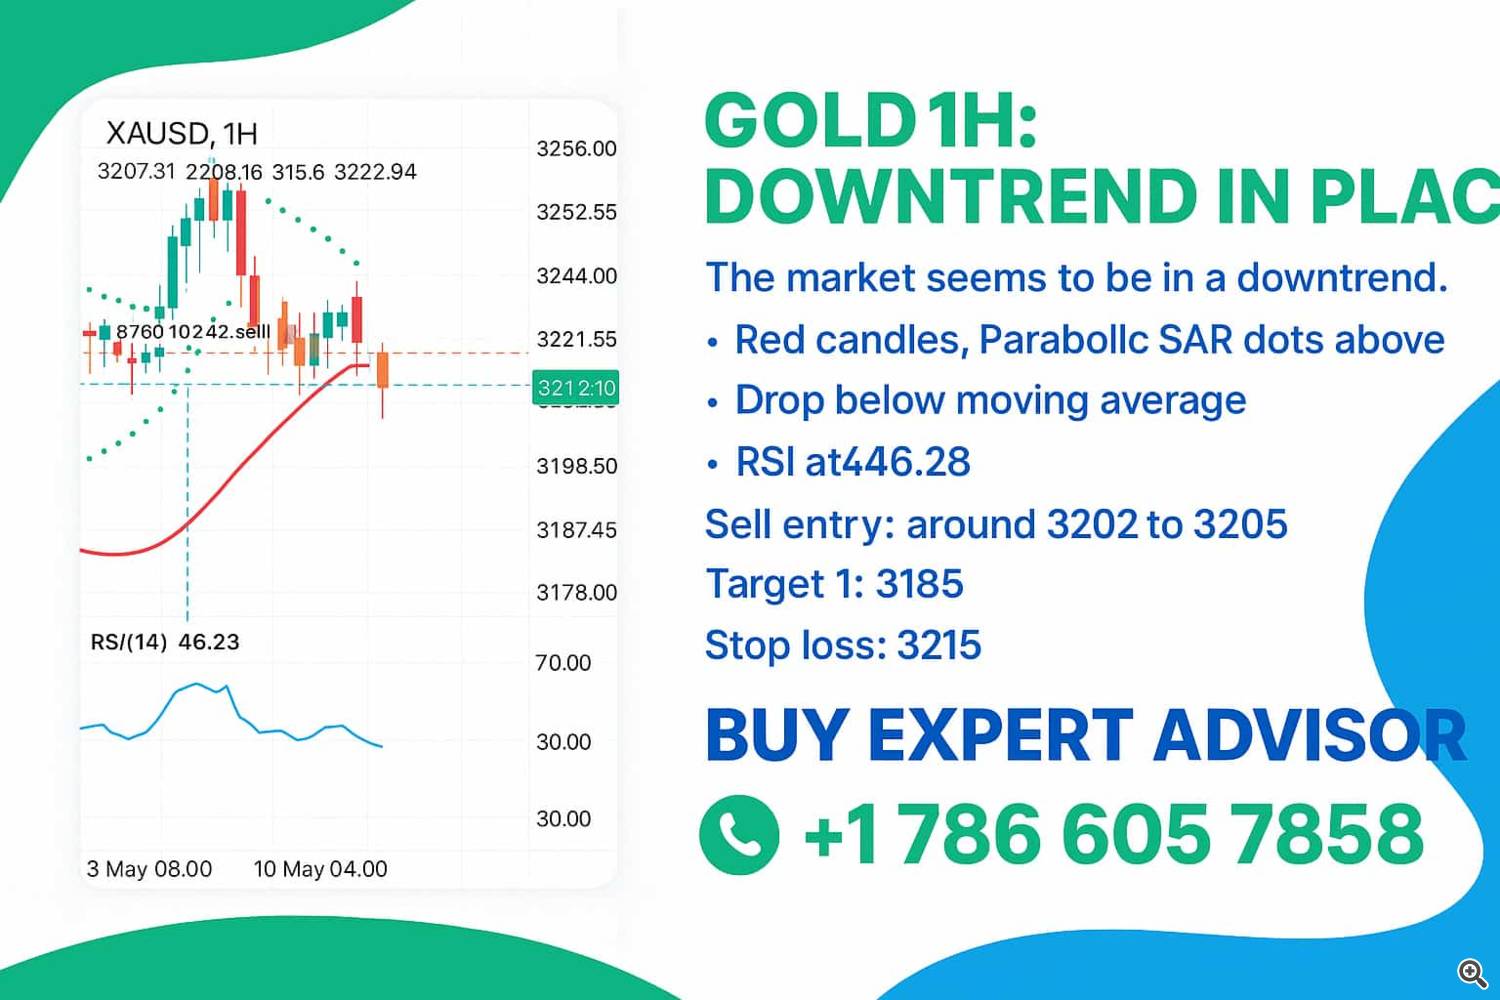
Looking at the Gold (XAUUSD) chart on the 1-hour timeframe, the market currently seems to be in a downtrend.
16 May 2025, 09:44
0
265

A few things stand out:
1. There are multiple red candles forming after a failed upward move, which shows selling pressure.
2. The Parabolic SAR dots are above the price, indicating a bearish trend.
3. The price has dropped below the red moving average line, which adds to the bearish confirmation.
4. RSI is around 46.28, which is below 50 and still has room to drop before reaching the oversold level.
Based on this, the market is showing signs of continuing downward movement.
Here’s a simple suggestion:
✅A sell entry could be considered around 3205 to 3210.
✅You can aim for targets like 3185 as the first level, and 3170 if the trend continues.
✅It would be wise to keep a stop loss around 3215, which is just above the recent swing high.


