Input Parameters: Fundamentals and Configuration
As detailed in the blog Introduction to SENTINEL Heikin-Ashi, the entry signals of this EA are generated by filtering trend reversals identified by Heikin-Ashi candles. This process can be carried out using up to four different methods.

The Strategy Direction field allows optimizing parameters for a specific direction or applying the same configuration for both directions. SENTINEL Heikin-Ashi supports the configuration of multiple instances within the same account, even operating on the same symbol. Each instance is identified by a unique magic number.

Enabling Heikin-Ashi Reinforcement ensures that Heikin-Ashi trend reversal signals are validated only when confirmed by a second candle of the same color, increasing the precision of entries.
Moving Average Crossover provides six different configurations for moving average crossovers, adapting to various strategies and trading styles.

These options are complemented by the Crossover Confirmation field, which defines how the moving average crossover is managed.

- Relative Position: The signal will be valid as long as the fast moving average is above the slow moving average in long trades, or below it in short trades.
- Crossover Event: Entry signals are validated if the upward (for longs) or downward (for shorts) crossover occurred within the last few candles.
- Momentum Alignment: This option, exclusive to SENTINEL Heikin-Ashi, combines the relative position of moving averages with their dynamics (whether they are converging or diverging). This approach seeks to anticipate imminent crossovers or discard late signals, maximizing the opportunity for optimal entries.
The entry signal is complemented by a precise adjustment of risk exposure. The expert advisor calculates the position size considering the distance between the initial stop loss and the entry price, following the values configured by the user in the VOLUME, RISK, and SPREAD parameter group. If the calculated size exceeds the available leverage, it will automatically reduce to fit the constraints. If the minimum size allowed by the broker for the symbol prevents the trade, the market entry will not be executed, even if a valid signal exists.

The Risk Management menu offers three options to define exposure: as a percentage of equity, balance, or as a fixed amount. By selecting Risk % of equity or Risk % of balance, the system interprets the value of the Risk Value or Fixed Volume field as the desired percentage. However, if Fixed volume is selected, this value is interpreted based on the "Volume" field in MetaTrader.

The third field in the group, Acceptable spread, defines the maximum spread allowed to execute trades, avoiding entries during market conditions with high spreads. The configured value represents the maximum spread accepted by the system to authorize an order. Users will likely opt for a higher value in higher timeframes and a tighter one in timeframes where lower range is expected.

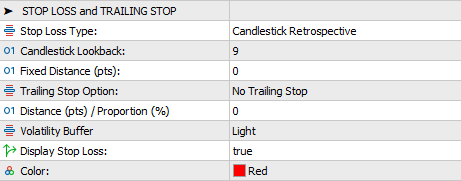
The Stop Loss Type field allows choosing between two methods to calculate the stop loss level: Candlestick Retrospective and Fixed Distance.
- Candlestick Retrospective sets the stop loss according to the high or low of a specific number of previous candles, configured in the Candlestick Lookback field.
- Fixed Distance uses a fixed distance defined in points in the Fixed Distance (pts) field.
Additionally, a volatility-based margin can be added by selecting one of the available options in the Volatility Buffer field.
The Trailing Stop Option field offers three methods for dynamically managing the stop loss:
- Classic (Fixed Distance): Based on a fixed distance in points.
- Follow Stop Loss Type: Applies the same criterion defined for the initial stop loss at the beginning of each new candle.
- SentinelFlow (Proportional): Calculates the trailing stop as a proportion of the price movement.
The field Distance (pts) / Proportion (%) is used to define the points in the case of Classic or the percentage in the case of SentinelFlow, with no relevance for the Follow Stop Loss Type option.
In all configurations, the stop loss level will only be adjusted in a favorable direction to the price. These movements will be graphically represented on the price chart if the field Display Stop Loss is activated (true).

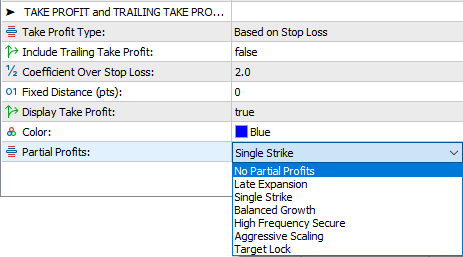
The field Take Profit Type offers two options: Based on Stop Loss and Fixed Distance.
By selecting the Based on Stop Loss option, the distance to the take profit is adjusted directly in relation to the defined stop loss. This relationship is determined as a fraction or multiple of the distance to the stop loss, according to the value specified in the field Coefficient Over Stop Loss.
With the Fixed Distance option, the take profit is set at a specific distance measured in points, defined by the value configured in the field Fixed Distance (pts).
The field Include Trailing Take Profit allows the Take Profit Type criterion to be updated at the start of each candle (this adjustment will only be effective if the change favors the price position). Movements of the take profit level will be represented on the price chart if the field Display Take Profit is set to true.
Practical Example: Trade Analysis
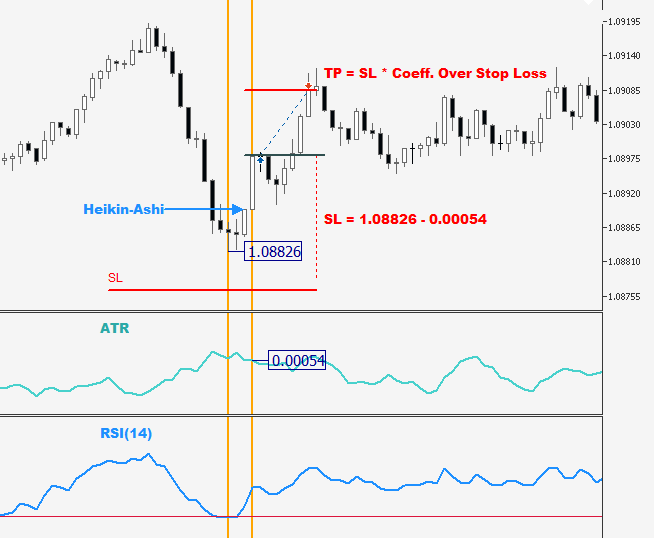
The following image shows a trade made by SENTINEL Heikin-Ashi, which we will use as an example to illustrate the use of some of the parameters described above. In addition to the candlestick chart with price levels, the ATR and RSI indicators are included. Let’s analyze the scheme.

The tip of the blue arrow indicates the area where the Heikin-Ashi reversal occurs, coinciding with the RSI exiting the oversold zone. This results in a long entry, accompanied by its respective stop loss (SL) and take profit (TP). Below, we explain how their values are determined. For simplicity, we assume that the fields Include Trailing Stop and Include Trailing Take Profit are set to false.
We can deduce that the field Candlestick Lookback has a minimum value of 3. Since the signal is a buy, the system used the low of the last three candles, marked on the chart as 1.08826. However, the stop loss (SL) level is below this value, indicating that Volatility Buffer takes a value different from No Buffer, specifically Light, as the extra coincides with the ATR value at the time of the entry signal. This is how SENTINEL calculated the SL level.
As for the take profit (TP) level, we observe that the Take Profit Type menu option selected is Based on Stop Loss. This implies that the field Coefficient Over Stop Loss cannot be zero. In this case, since the distance to the TP is clearly smaller than that of the SL, it is evident that the coefficient is less than 1. At a glance, it seems to be between 0.5 and 0.6.
If you have any questions about this explanation, feel free to leave a comment.


