
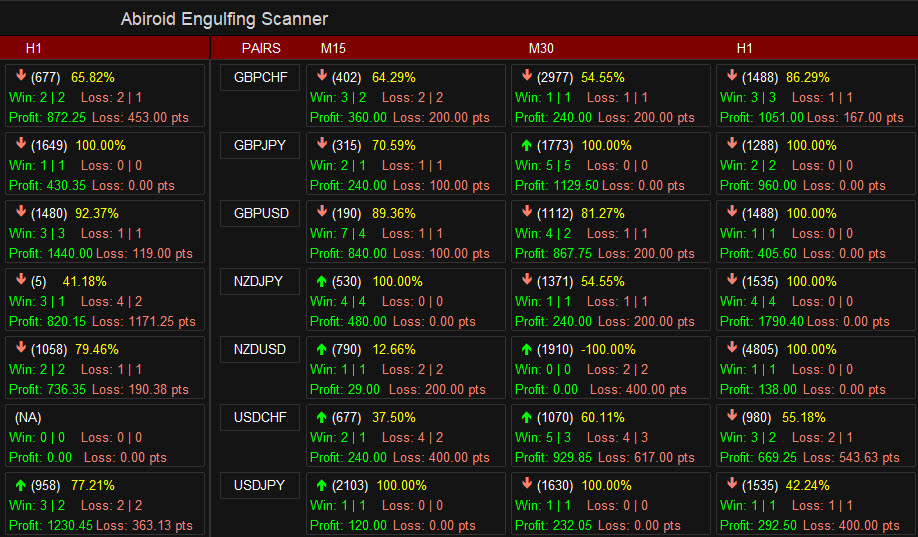
Engulfing Candles Price Action Arrows and Scanner Dashboard

Features:
The strategy looks for these engulfing candlestick pattern:
- Simple Engulf
- Stick Sandwich Engulf
- Three Line Strike
- Rising Three
- Morning Star Doji
Scanner is useful to make your strategy better. Don't always go by Win/Loss percentage. Because this tool is not based on past results.
Product:
https://www.mql5.com/en/market/product/78367
Video Tutorial
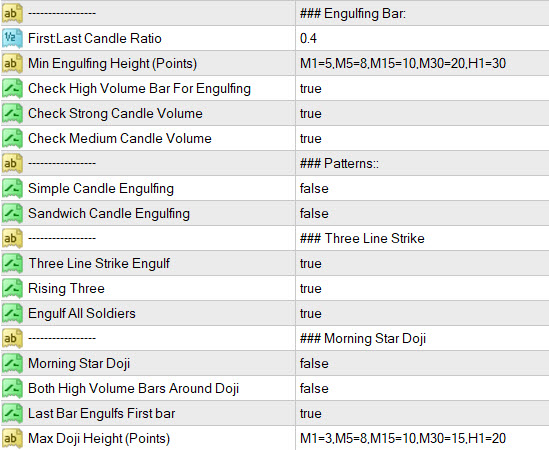
Basic Settings:
For All Patterns You can set:
- First:Last Candle Ratio
This will make sure that the earlier opposite candle is at least this given ratio in height as compared to the engulfing candle. This is not checked for Three Line Strike or Rising/Falling Three.
E.g.: 0.8 value
Suppose for "Bullish Stick sandwich", If Bullish engulfing candle is 100 points in height, then the middle Bearish candle should be at least 80 points in height.
Keep it 0 for no check.
- Min Engulfing Height (Points)
Minimum height in points for the engulfing candle based on timeframe.
Calculate all Min/Max Values using Cross Hair Tool:
e.g.: M1=5,M5=8,M15=10,M30=20,H1=30
Means for H1, the engulfing candle should be 30 or more in points.
- Check High Volume Bar For Engulfing: true
The engulfing candle should be at least medium (if medium true) or strong high Volume Candle
Pattern Settings:
1. Simple Engulfing Pattern:
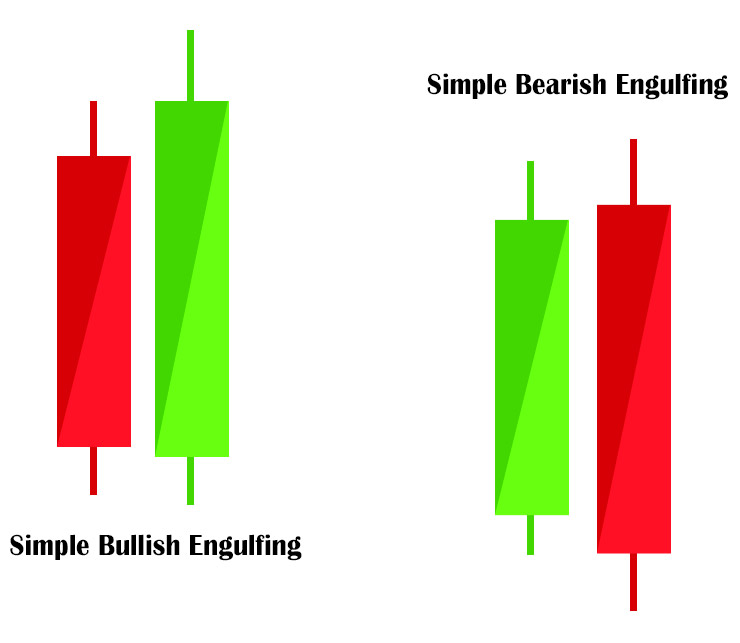
Pattern detected when a bullish candle engulfs a bearish candle.
Suppose " First:Last Candle Ratio" is 0.8
And that 1st bearish candle height is at least 0.8 ratio of the longer bullish candle. If this ratio is high, it will give fewer signals.
Keeping it low like 0.4 will give more signals.
Same, but vice versa for bearish engulfing.
2. Sandwich Engulfing Pattern:
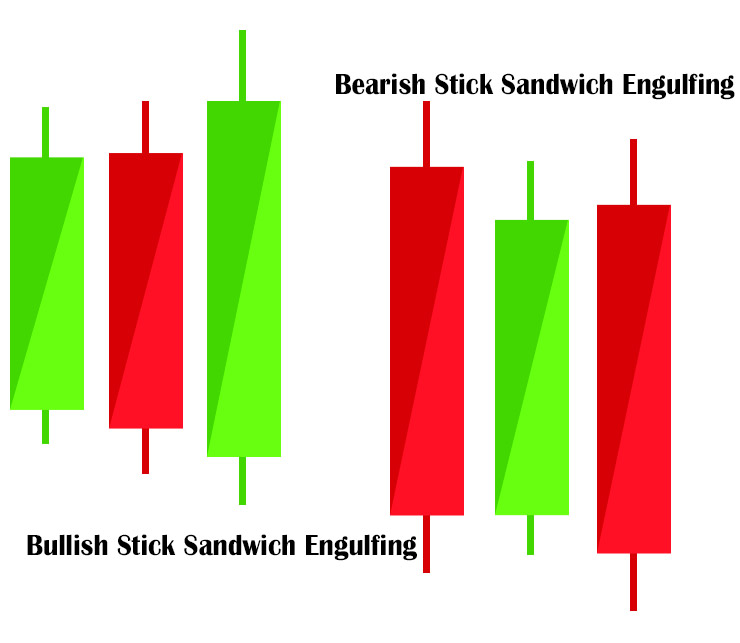
Similar to above pattern.
Bullish:the starting candle should be Bullish, then bearish. Then again an engulfing bullish.
Here, the First candle ratio will be checked between the middle bearish and last engulfing bullish candle.
3. Three Line Strike Engulfing Pattern:
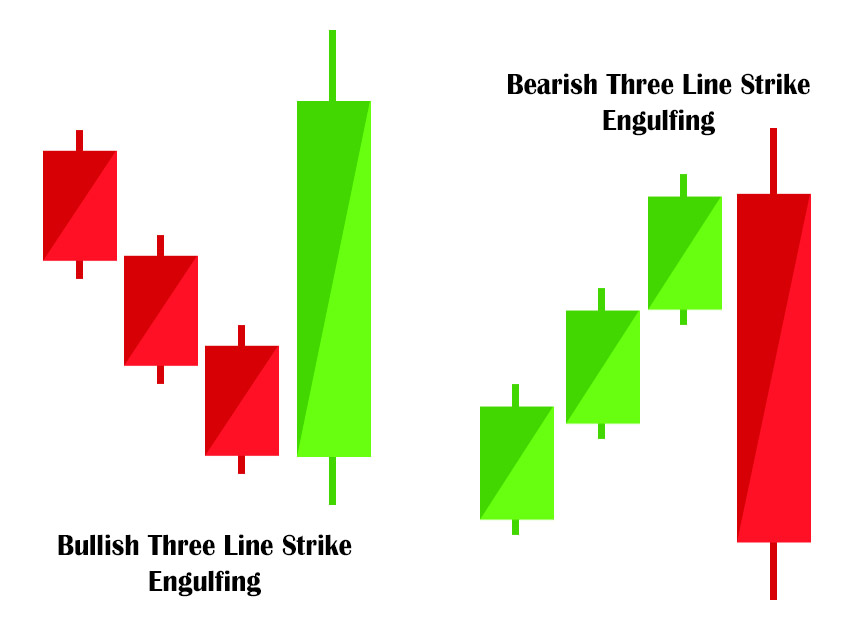
Bullish:This pattern will look for 3 continuous bearish candles and then one Bullish candle.
Same for bearish, it will look for 3 continuous bullish candles (called 3 soldiers). And then one bearish candle.
If "Engulf All Soldiers"is true, then the last candle should engulf all the previous 3 opposite candles.
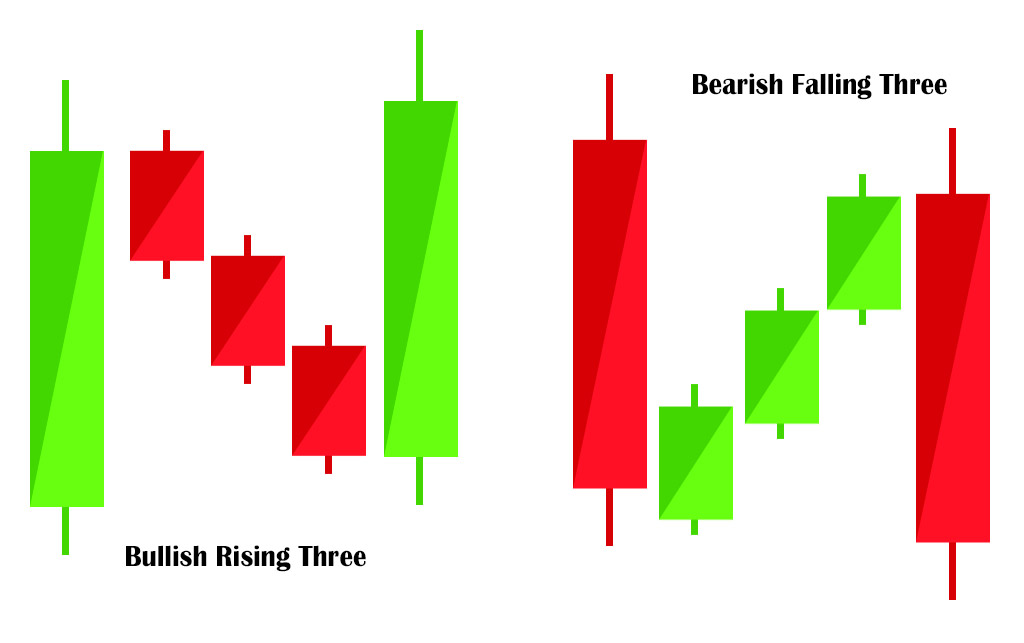
If "Rising Three"is true, then it will check for a bullish bar first, then 3 bearish bars, then finally a bullish engulfing bar again like this:
The 3-line strike pattern, only shows possible S/R areas.
And then it is best to wait to see if price crosses the 3-line strike engulfing bar above/below:
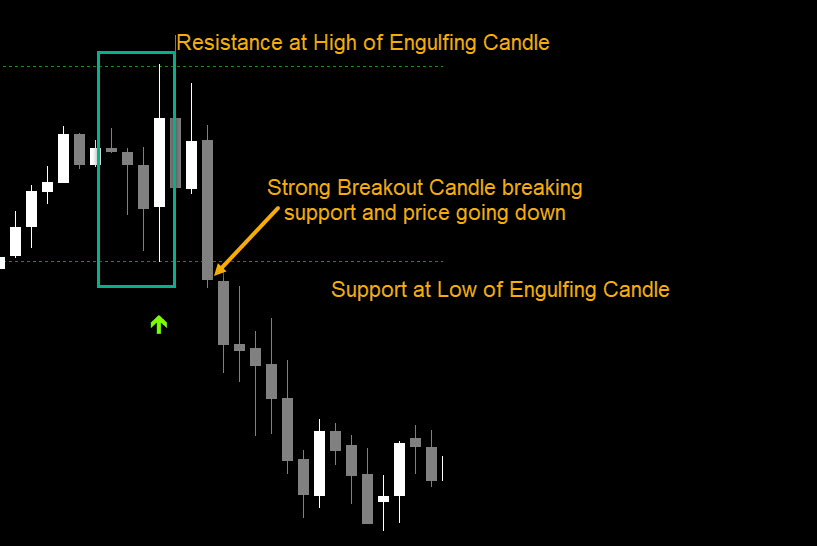
Because sometimes, after a Bullish 3 line strike, price might breakout and go down instead of up.
So, be careful and wait for a powerful breakout after this pattern. Preferably with a strong volume candle breaking out.
4. Morning/Evening Star Doji Pattern:
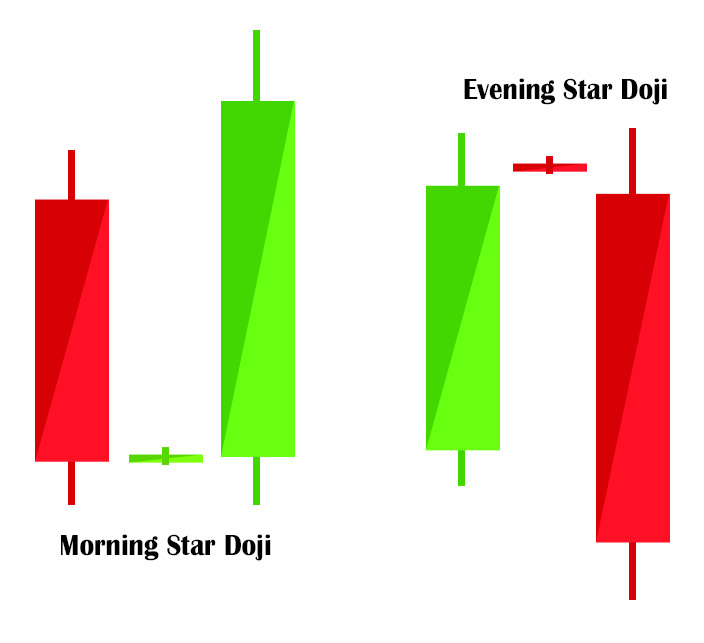
It's pretty clear from image above. Bearish candle, then doji and then bullish engulfing candle.
Doji can be bullish or bearish. But it's height should be less than "Max Doji Height"defined in points.
Use cross hair tool to find best Min/Max heights for all different timeframes:
https://www.mql5.com/en/blogs/post/747462
If "Both High Volume Bars Around Doji"is true, it will check both bars to be high/medium volume bars. Medium check only if medium is true in earlier Volume Setting.
And if "Last Bar Engulfs First Bar"is true, it will check if final bar engulfs the first opposite bar. Doji can be slightly above/below both bars as well.
Forming an abandoned baby pattern. But this pattern is not specifically checked for.
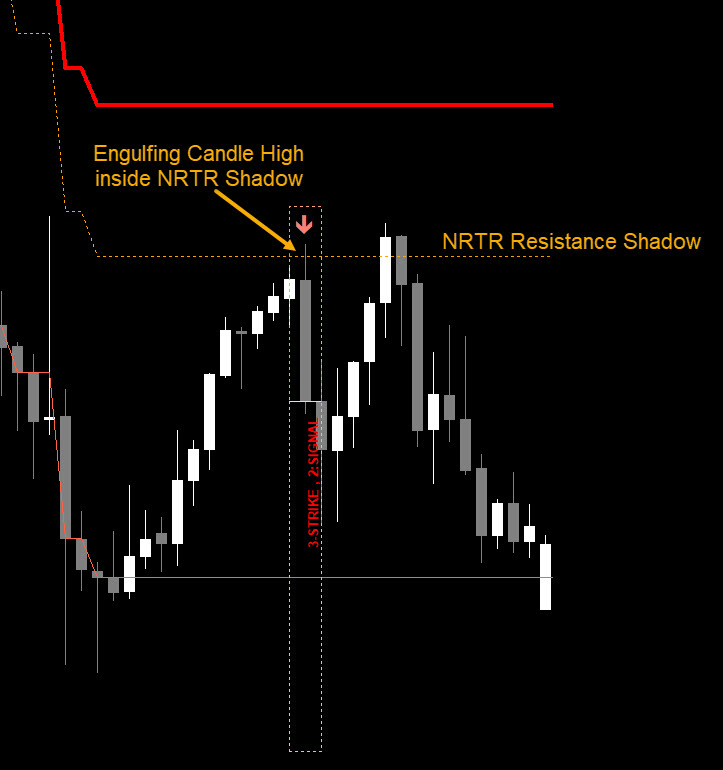
Support/Resistance with NRTR:
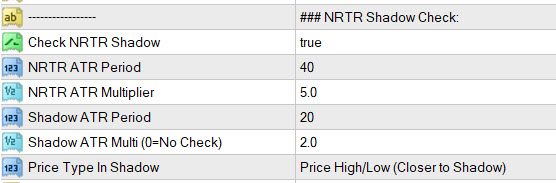
Engulfing patterns appear a lot, and they don't always signal reversal.
Which is why, if we use these patterns with SR Areas, they give a higher chance of being better reversal areas.
This indicator uses NRTR Shadow. Read more about NRTR:
https://abiroid.com/explained/nrtr-explained
NRTR will limit the signals a lot. And give fewer but very reliable signals. Keep NRTR Shadow multiplier higher. Like 2, to get more signals.
On lower timeframes be careful and keep it lower. Otherwise you might get unpredictable signals, as price ATR will be higher when volatility is very high.
And timeframes like M1,M5 will not give good results. So avoid those.
Higher Timeframe Trend (using SSL):
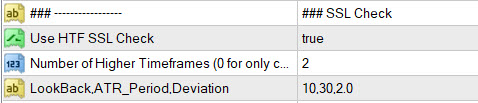
For Current and higher timeframes trend check, it uses SSL trend check: "SSL fast nrp atr bands.ex4"
Number of Higher TF:If you specify 0, it will only check current timeframe.
Or else suppose current is M30 and number is 2. It will check SSL Trend on current M30 and higher H1 and H4.
Keeping more HTF timeframes will limit signals even more.
Win Rate Calculations:
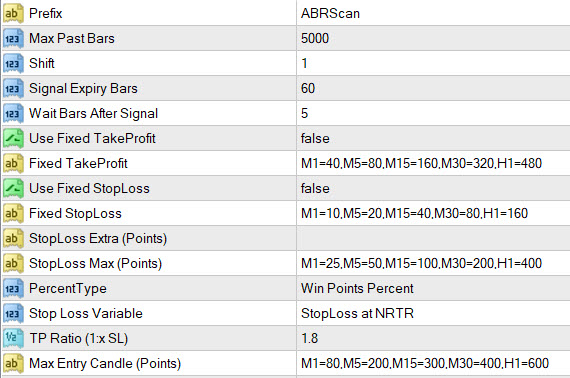
Check out this post to read more about Win Rate and other common Scalper settings:
https://www.mql5.com/en/blogs/post/748037
This indicator has variable SL at NRTR. And variable TP using TP_Ratio. Which is ratio of StopLoss. Read above post for more details.
Fixed SL/TP will be given preference if it is true.
Best Trades:
Trade on M15+
H1 will give best trades. Built for MT4 (Metatrader 4)
Only trade during good volatility. But don't use during unpredictable, whipsawing markets.
SSL checks can be heavy, especially if multiple higher timeframes are there. So don't use too many pairs if scanner seems to be slowing down.


")
")