

American stock indexes retain a positive dynamics, developing an upward correction.
Earlier in the week, the stock market saw a large-scale sale in the light of renewed fears about trade relations between the US and China.
As you know, the White House announced its intention to introduce additional 10-percent duties on Chinese goods worth $ 200 billion.
Previously, Trump threatened to impose duties on all exports from China, which is $ 505 billion a year.
Nevertheless, the threat of an escalation of trade contradictions between the US and China has so far come to the fore.
US Treasury Secretary Stephen Mnuchin on Thursday rejected the possibility of consequences of the introduction of duties announced by the administration of US President Donald Trump. Mnuchin said that the US economy will not suffer as a result of these duties.
Investors focus on the reports of the largest US companies and on positive macro statistics coming from the US, indicating the acceleration of the growth of the American economy.
The producer price index rose in June, which was another sign of increased inflationary pressures in the US. The index of final demand (PPI), which displays the cost of goods and services, appointed by companies, in June rose by 0.3%.
Compared to the same period of the previous year, PPI in June grew by 3.4%, which was the strongest annual growth since November 2011.
The consumer price index in June increased by 2.9% compared to the same period of the previous year, showing the strongest growth since 2012.
Even if the indices are down today, they will end the week in positive territory anyway.
*)An advanced fundamental analysis is available on the Tifia Forex Broker website at tifia.com/analytics
Support and resistance levels
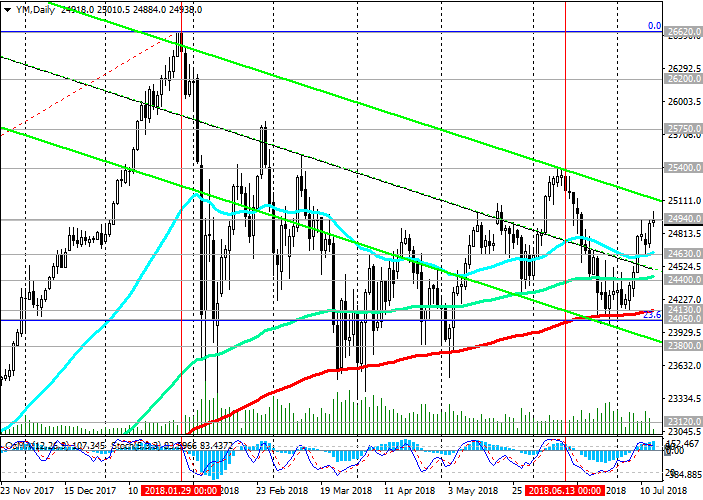
While DJIA is trading above the key support levels of 24130.0 (EMA200 on the daily chart), 24050.0 (the Fibonacci level of 23.6% of the correction to the growth from the level of 15650.0 in the wave, which began in January 2016. The maximum of this wave and the Fibonacci 0% level are near the mark of 26620.0), positive dynamics remain, and the bullish trend is not threatened.
Breakdown of the local resistance level of 24940.0 (July highs) will accelerate the recovery and growth of the DJIA. In the event of a breakdown of the resistance level 25400.0 (June highs), the DJIA will head towards the resistance levels 25750.0, 26620.0 (absolute and annual highs).
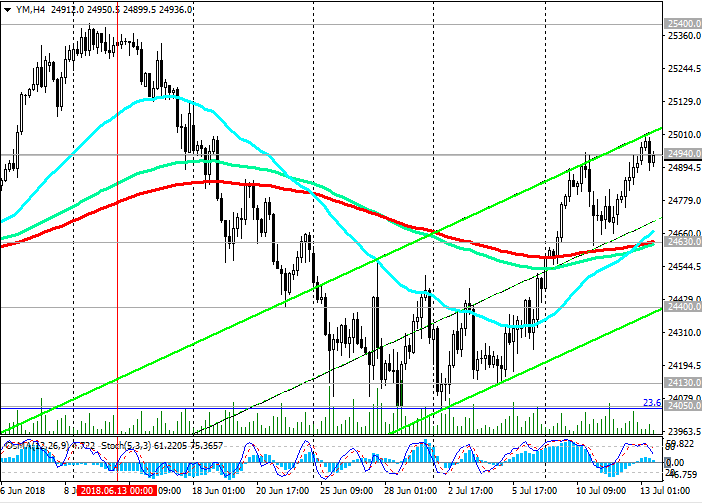
The signal for sales will be a breakdown of the short-term support level of 24630.0 (EMA200 on the 4-hour chart).
Support levels: 24630.0, 24400.0, 24130.0, 24050.0, 23800.0, 23120.0, 22450.0
Resistance levels: 24940.0, 25000.0, 25400.0, 25750.0, 26200.0, 26620.0
Trading Scenarios
Buy Stop 25020.0. Stop-Loss 24880.0. Take-Profit 25400.0, 25750.0, 26200.0, 26620.0
Sell Stop 24880.0. Stop-Loss 25020.0. Take-Profit 24600.0, 24400.0, 24130.0, 24050.0, 23800.0, 23120.0, 22450.0
*) For up-to-date and detailed analytics and news on the forex market visit Tifia Forex Broker website tifia.com


")
