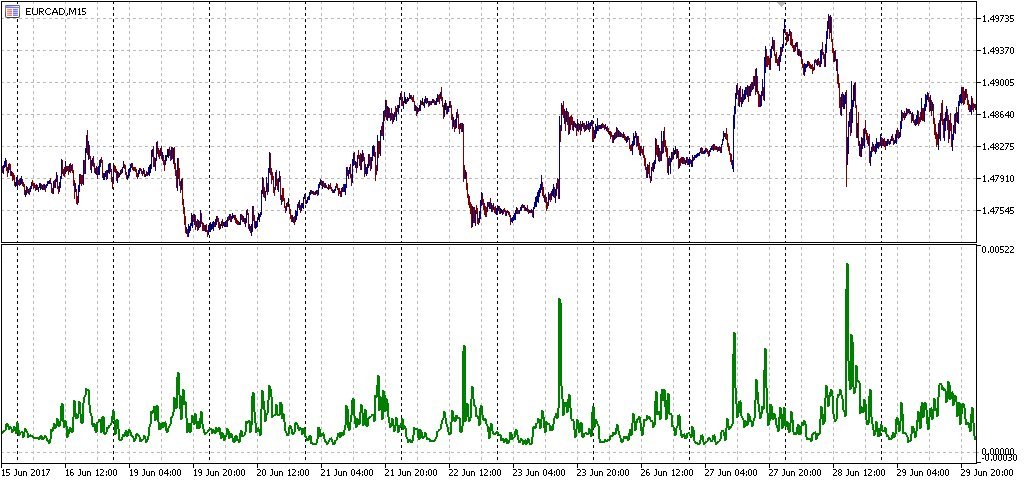
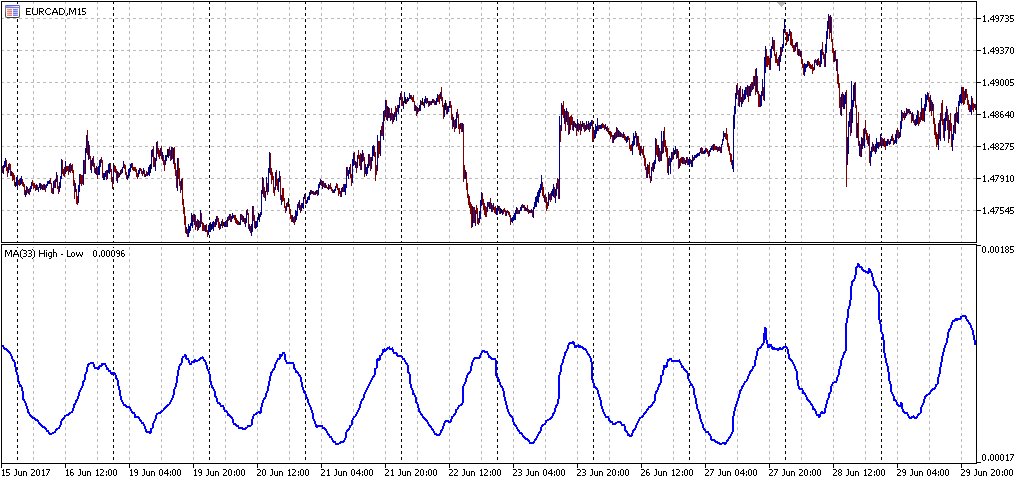
It seems High and Low are as independent as Open and Close of price candles. However, the graph of [ High minus Low ] shows a sinusoid pattern with constant period of 24 hours.

The above picture shows EURCAD price chart and HIGH-LOW chart below it. As we can see, a main sine wave exists. To filter the wave, I used SMA(33) and following picture is chart of SMA33(HIGH)-SMA33(LOW). The minimum point is at 7:00 GMT and maximum point at 18:00 GMT.

It is interesting that despite of price chart movements, H-L chart has a almost uniform form. I can not find any reason for this behavior.


