
FX Technical Weekly: Is EUR/USD 2016 the Opposite of EUR/USD 2004?

FX Technical Weekly: Is EUR/USD 2016 the Opposite of EUR/USD 2004?
EUR/USD
Weekly
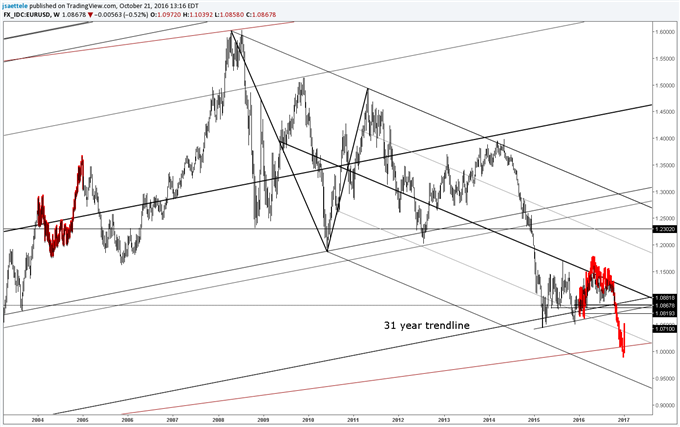
-Last week’s update noted that “EUR/USD has broken down on the daily but remains within a range on the weekly chart. The near term breakdown could certainly ‘launch’ a more important move but there are several levels to pay attention to in the event that this move is a trap. The notable level to watch is the 30 year trendline near 1.0880. The other spot to watch is 1.0820; the May and July 2015 lows.” That first level was reached today and price action offers no reason to suspect that the trend is not lower. Pay attention to the YTD low at 1.0710 too. There is a history of near term capitulation and even bigger reversals towards the end of October. Examples include 2013, 2011, 2009, 2008, 2004 and the all-time low in 2000. In fact, the 2004 market (flipped actually…it’s displayed on the chart above) might be the best template for what is about to transpire. That scenario and several other analogs will be explored in an upcoming report atSB Trade Desk.
Weekly
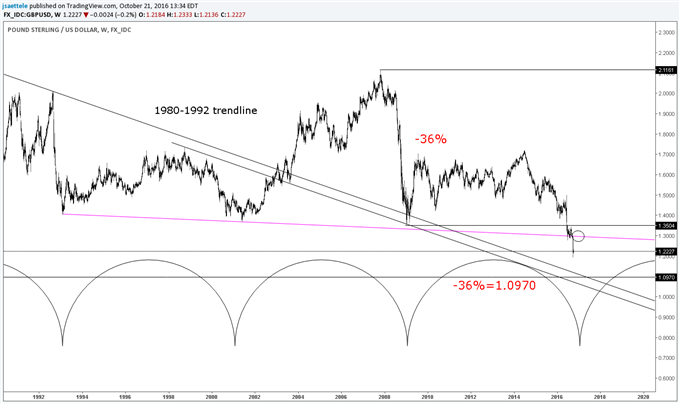
There is no change to the weekly Cable analysis. “There may be no real support until early 2017 based on the 96 month (8 year) cycle low count. That cycle count is shown on this chart. A price level of interest is where the decline from the 2014 high (1.7191) would be equal to the 2007-2009 decline in percentage terms (36% declines). The math produces 1.0970.”
AUD/USD
Weekly
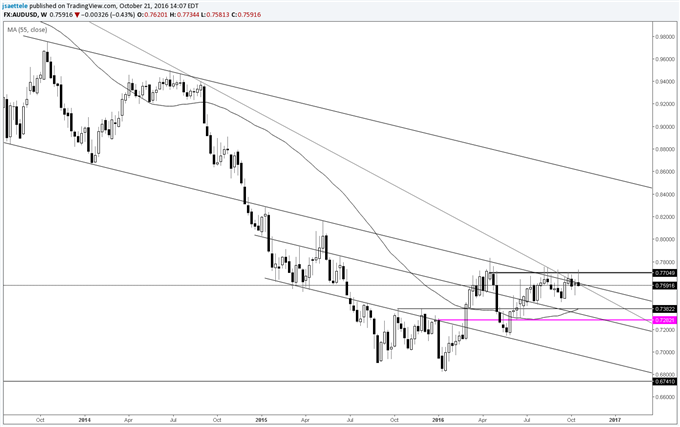
-AUD/USD broke out on Wednesday…and failed (I bought the breakout too). Thursday and Friday weakness leaves a nasty weekly bar near the top of the year’s range. To review, “AUD/USD remains capped by major slope resistance after finding low earlier in the year at ‘macro’ slope support (see the link to the quarterly charts at the beginning of the report). The bullish breakout level (weekly closing basis) is .7719. Strength through there would signal that a basing process is complete for a move to the mid-.80s. Until then, scope remains for additional range trade with support near .7380 (October and December 2015 highs).”
Weekly
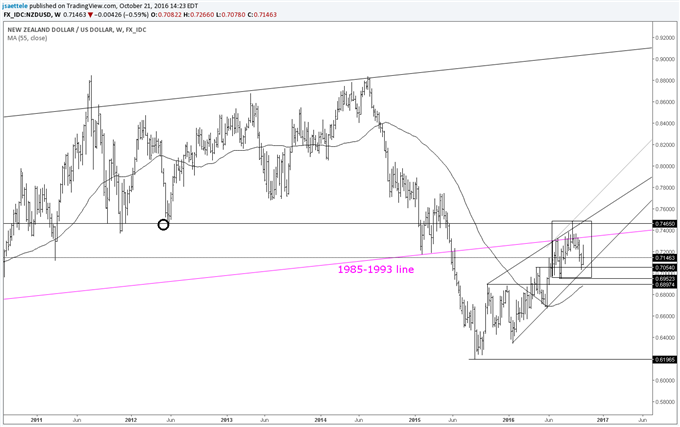
-The 1985-1993 line has been resistance since June. In fact, Kiwi was never able close above the line on a weekly basis (plenty of wicks above). The January-May trendline held on the first test but failure near the month open (and 55 day average) warns of something brewing on the downside. A break below .6950 would trigger a head and shoulders pattern AND a 14 month bearish wedge pattern.
Weekly
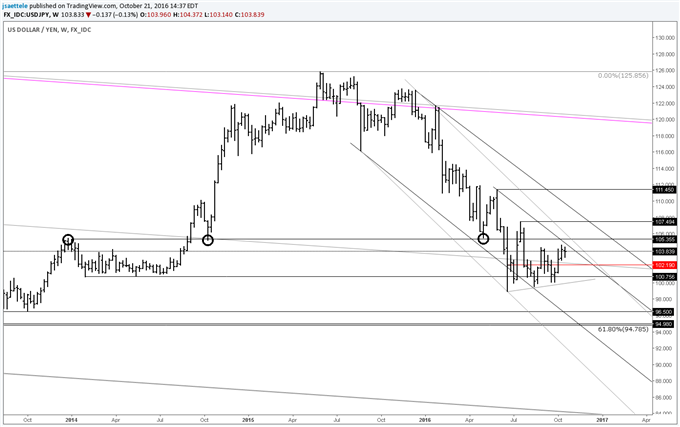
-The recent quarterly update remarked that “the area around 100 is clearly important (see lows in 1999, 2000, 2005, 2014, and the 2009 high)…don’t be shocked if USD/JPY surprises higher in Q4.” The big test for this rally is the May low at 105.44 (same area code as the January 2014 high and October 2014 low). Pattern wise, trade since the Brexit low may be a triangle (currently rallying into a c wave top).
USD/CAD
Weekly
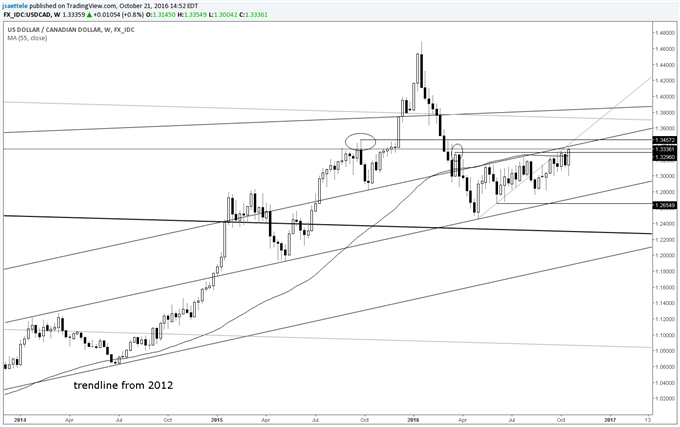
-I started last week’s comments with “USD/CAD might be about to fall off of a cliff. The 55 week average has been resistance since May. The average had been support since 2013 so the behavior change (former support becoming resistance) should be taken seriously. Further, action since the May low qualifies as a wedge.” That was wrong…the weakness scenario could be early but early is still wrong. With the rate failing at the 3/24 high (1.3296) twice earlier in the month, the push to new highs (and above the 55 week average) caught me off guard. The next spot to pay attention to is the September 2015 high at 1.3456.
Weekly

-USD/CHF remains subdued but its time will come (perhaps this quarter given the time symmetry described here). The shape of trade since 2011 is a wedge. Wedge support has held throughout 2016, thwarting the bear camp time and again. Near term, the rate continues to trade at resistance from the June high and November-January trendline. A push through there wouldn’t mean a whole lot in the grand scheme of things…the more important spot to pay attention to is the longer term parallel that ticked the November 2015 high. That line is near 1.0040.


 Trading Guide")
")
