
Analysis :
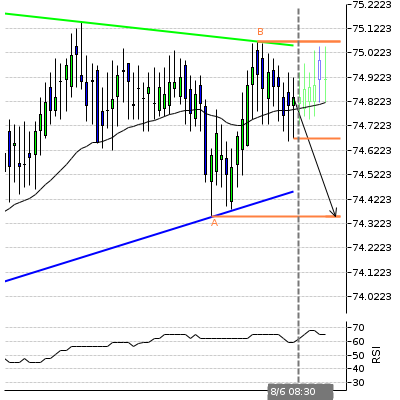
Triangle identified at 08-Jun-08:30 2016 GMT. This pattern is still in the process of forming. Possible bearish price movement towards the support 74.35 within the next 10 hours.
Supporting Indicators :
RSI above 60
Resistance Levels :
A ) 74.35Last support turning point of Triangle



![[iVISTscalp5]: XAUUSD. Forecast First. Market Reaction Afterwards](https://c.mql5.com/6/1035/splash-preview-777232.png "[iVISTscalp5]: XAUUSD. Forecast First. Market Reaction Afterwards")
