
Analysis :
Rising Wedge has broken through the support line at 08-Mar-02:00 2016 GMT. Possible bearish price movement forecast for the next 2 days towards 0.735.Resistance Levels :
( B ) 0.7488Last resistance turning point of Rising Wedge.Support Levels
( A ) 0.7389Last support turning point of Rising Wedge.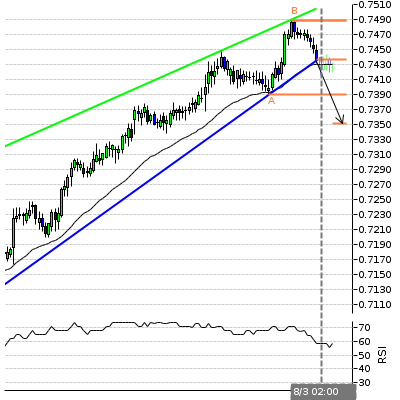


![[EURUSD]: Weekly Liquidity Activation Points (LAP), October 12-16, 2026](https://c.mql5.com/6/1035/splash-preview-777305.png "[EURUSD]: Weekly Liquidity Activation Points (LAP), October 12-16, 2026")
![[Nasdaq]: Weekly Liquidity Activation Points (LAP), October 12-16, 2026](https://c.mql5.com/6/1035/splash-preview-777311.png "[Nasdaq]: Weekly Liquidity Activation Points (LAP), October 12-16, 2026")
![[XAUUSD]: Weekly Liquidity Activation Points (LAP), October 12-16, 2026](https://c.mql5.com/6/1035/splash-preview-777299.png "[XAUUSD]: Weekly Liquidity Activation Points (LAP), October 12-16, 2026")