

Trading CFDs with MACD
The MACD entry trigger is used to initiate entries into CFD positions. The MACD is short for Moving Average Convergence Divergence and is a leading indicator, which means that buy/sell signals are generally given in advance of large swings to the upside/downside. In this article, the application of the MACD entry trigger is illustrated with respect to three different trading approaches; the fundamental, swing and scalper/day-trader approaches.
The Fundamental Approach
Fundamental analysis is concerned with ‘bigger picture’ moves that may last days, weeks or even months.Several economic indicators are closely watched, such as Consumer Price Index, Real GDP growth, interest rates, unemployment, etc., which affect the valuation of a currency pair. A fundamental trader looks for unrealized value in the marketplace at a given time. One fundamental technique is the carry trade. This type of trade is used when two economies have different interest rates. For example, the Canadian central bank has an interest rate of 1.0% at present while in Japan the Bank of Japan’s interest rate is 0.1%. A carry trade takes advantage of these differences in interest rates and a higher interest rate creates more demand for a currency (more money will be exchanged into Canadian dollars to earn a higher return on deposits in relation to Japanese Yen, therefore the CAD/JPY should appreciate over days/weeks/months). Therefore, a long position on CAD/JPY would be established.
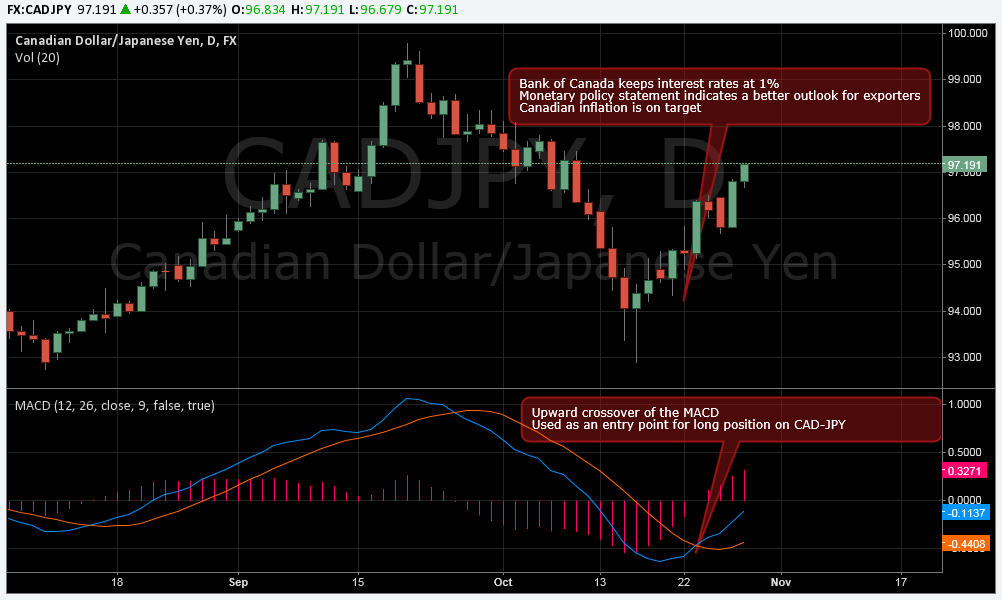
The MACD can be used to time such trades. It could take days, weeks or even months for a fundamental theme to play out and this is where a technical trigger can be of benefit. Using MACD to time entry allows for better trading opportunities. For example, the daily chart below shows the CAD/JPY rate and the MACD indicator.
Past performance is no guarantee of future results.
As the chart shows, the crossover of the MACD indicated the start of an upward trend after Bank of Canada kept interest rates at 1%. The continuation of the large interest rate differential between Japan and Canada, also a better outlook for Canada from the monetary policy statement that followed the interest rate decision, led to an upward move for the CAD/JPY. The upward crossover of the MACD would have been used to trigger an entry into a long position in the CAD/JPY pair. This trade would have seen a huge move upwards, in favour of the fundamental trading idea.
Suppose you bought 1 CFD’s of CAD/JPY at the bid price of 95.315 and closed the position at 97.015 by selling the 1 CFD’s. The difference in the value from open to close of the CFD would have a net profit for this contract. You would have gone long 1 CFD at 95.315 and then sold this CFD at 97.015. Since the pair moved 1,700 pips/points in your favour you would have netted a profit of 1,700 x 1 = $1,700 CAD before commission and other charges.
The Swing Trader Approach
The swing trader can also incorporate MACD triggers into their analysis after determining the longer-term trend. Swing traders can identify trends at the daily timeframe to decide which direction they may want to trade in a particular market. For example, if a currency pair is in an upward trend, then the swing trader will look for MACD triggers that signal to go long on the currency pair. Trends can be identified in many different ways; for example, using a series higher highs or higher lows to denote an upward trend or the use of moving averages.
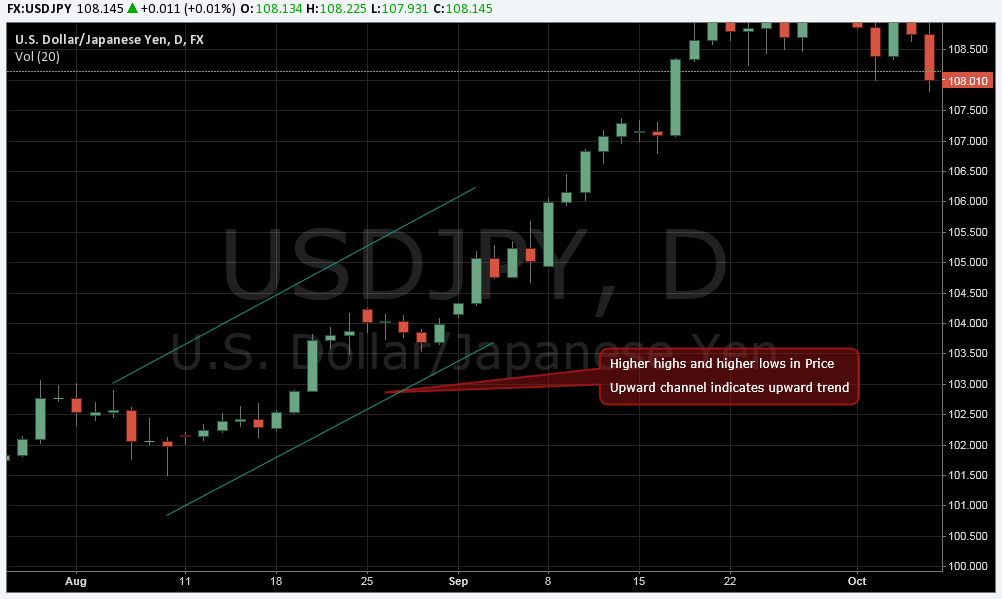
When the trend is determined, the trader can make use of the MACD at the 4 hour timeframe and look for MACD cross-overs. For example, in August 2014 to the end of September 2014, the USD/JPY rate was experiencing a strong upward trend. The daily chart below shows the upward trend over the month of August and an upward channel is drawn onto the graph.
Past performance is no guarantee of future results.
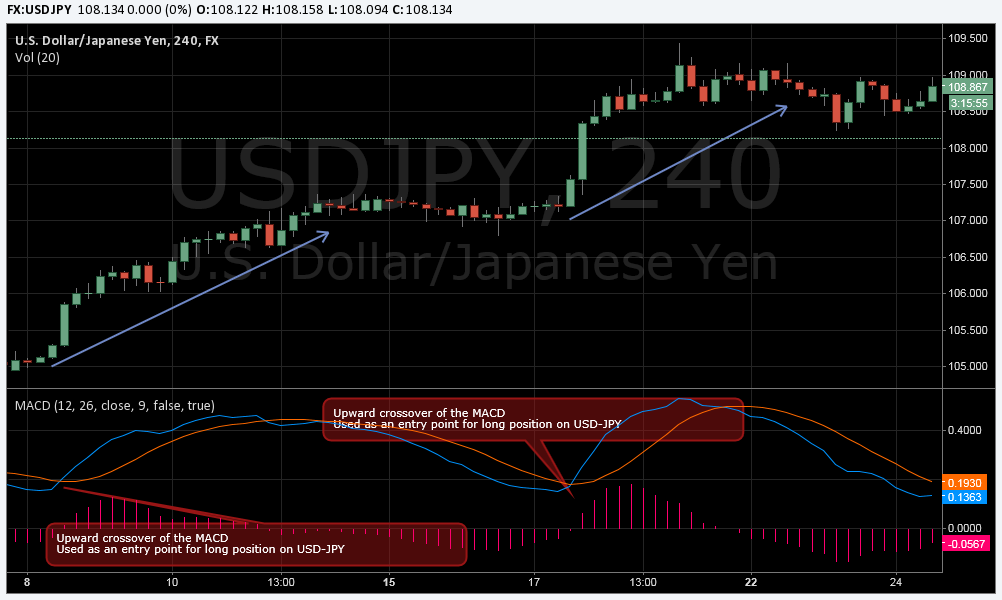
Say a trader observed the rising trend throughout August and decided to trade in mid-September. Since the trend is upward, the trader would look for an upward cross-over of the MACD at the 4 hour timeframe. The chart below shows the 4 hour price action. Between the 8th and 22nd of September, there would have been two opportunities to go long on the USD/JPY, as indicated by the MACD. Once the MACD displays an upward cross, this would be time to enter a long position on USD/JPY. If both of these opportunities were taken, the trend would have continued upward and the trader would have made a profit on two successful trades.
Past performance is no guarantee of future results.
The Scalper/Day-trader Approach
Scalpers and shorter term traders can use the MACD trigger as an entry in a similar way to swing traders, but with a much shorter-term focus for their entries. Traders can identify trends using the hourly or the four hour chart to determine the direction that they want to scalp in a market. For example, if a downward trend is present at the hourly timeframe, the trader will want to use downward cross-overs of the MACD at the 30-minute or 15-minute timeframe as an entry signal. On the other hand, if an upward trend is present at the hourly/4-hour timeframe, the trader will want to use upward cross-overs of the MACD at shorter timeframes as an entry signal.
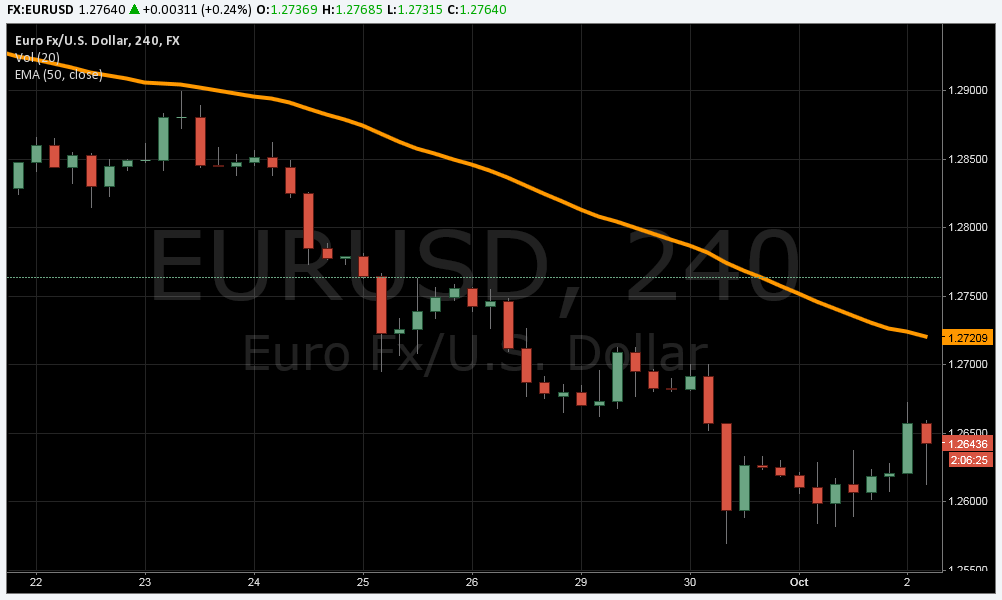
For example, the 4 hour chart below shows a downward trend in the EUR/USD rate and the 50 period exponential moving average is above the price action, also indicating a downward trend. The 50 period exponential moving average can be used as well as other moving averages, to determine the trend. If the price is above the moving average, then there is an uptrend and if the price is below the moving average, then a downtrend is in progress. Once the trader has identified this trend, the short-term charts will be used in conjunction with the MACD to enter a short position for the EUR/USD.
Past performance is no guarantee of future results.
Looking at the 30-minute chart below, the MACD indicates an entry signal when a downward cross-over is displayed. This means a trader will enter a short position and sell 1 CFD for the EUR/USD pair, since the longer term trend is a downward trend according to the exponential moving average. When the MACD displays a signal in the direction of the trader’s bias, in this case downward direction, the trader enters a short position. After opening a position, the trader can then hold this position until the MACD displays a signal in the opposite direction of the trader’s bias. For example, after shorting the EUR/USD, the trader would hold this position until the MACD displays an upward cross. At this point, the trader should exit the position and take the profits. Two possible trades are shown in the graph below using this technique.
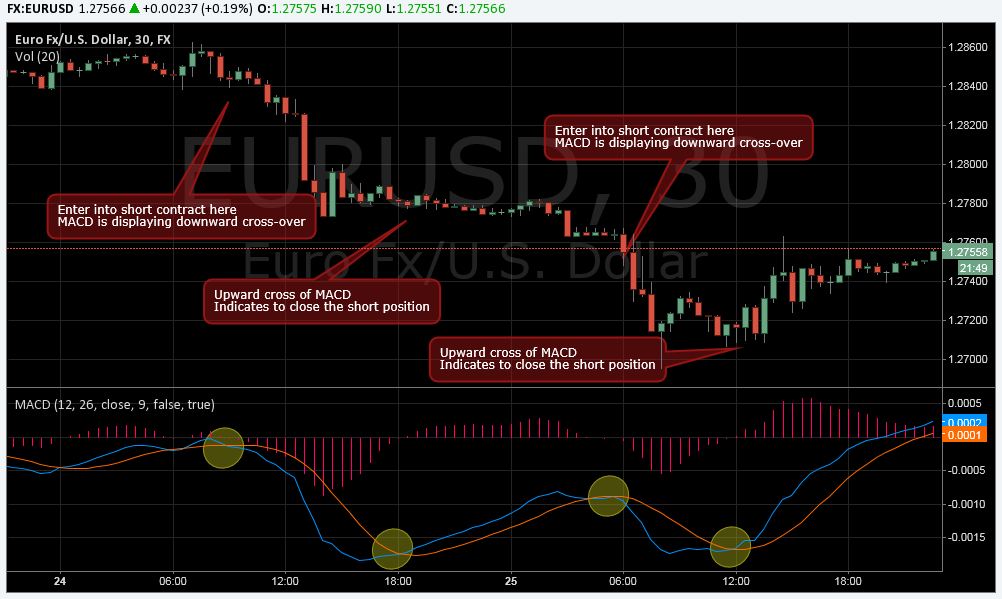 Past performance is no guarantee of future results.


")
![[XAUUSD]: Weekly Liquidity Activation Points (timings), June 22-26, 2026](https://c.mql5.com/6/1013/splash-preview-771790.png "[XAUUSD]: Weekly Liquidity Activation Points (timings), June 22-26, 2026")
