
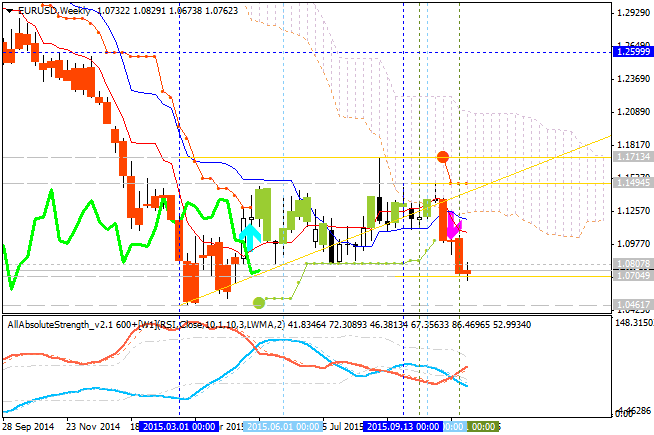
EURUSD Technical Analysis 2015, 15.11 - 22.11: daily ranging bearish, weekly bearish breakdown

Daily price is on the primary bearish market condition for the secondary ranging to be located below Ichimoku cloud and 'reversal' Senkou Span lines within the following key support/resistance levels:
- 1.1029 key resistance level located near the border between the primary bearish and the primary bullish trend on the chart;
- 1.0672 key support level located far below Ichimoku cloud in the primary bearish area of the chart.
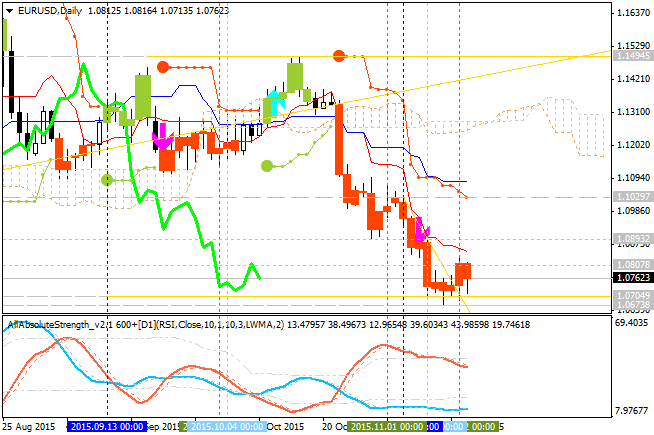
D1 price - ranging bearish:
- Tenkan-sen line is below Kijun-sen line for the bearish trend to be continuing.
- Absolute Strength indicator's data is estimating the secondary ranging.
- Chinkou Span line is located to be below the price and indicating the ranging bearish market condition by the direction.
- 'Reversal' Senkou Span line (as the border between the primary bullish and the primary bearish on the chart) is located far above the price.
- Nearest support levels are 1.0704 and 1.0672.
- Nearest resistance levels are 1.1029 and 1.1494.
If D1 price will break 1.0672
support level on close D1 bar so the bearish trend will be continuing
with possible breakdown up to 1.0461 as the next bearish target.
If D1 price will break 1.1029
resistance level on close D1 bar so we may see the local uptrend as the
bear market rally with the good possibility to the reversal of the
price movement to the bullish market condition.
If D1 price will break 1.1494
resistance level on close D1 bar so the price will be fully reversed to
the bullish condition located to be above Ichimoku cloud in the bullish
area of the chart.
If not so the price will be on ranging within the levels.
- Recommendation for long: watch close D1 price to break 1.1029 for possible buy trade
- Recommendation
to go short: watch D1 price to break 1.0672 support level for possible sell trade
- Trading Summary: bearish
| Resistance | Support |
|---|---|
| 1.1029 | 1.0704 |
| 1.1494 | 1.0672 |
SUMMARY : bearish


")