

In 1967, Benoît B. Mandelbrot published a paper. This paper, titled How Long Is the Coast of Britain? Statistical Self-Similarity and Fractional Dimension, discussed what is known as the coastline paradox, first posited by mathematician Lewis Fry Richardson: if you were to measure the coastline of Britain with a yardstick, you would get a value less than if you were to measure the coastline with a one-foot ruler. This is due to the fact that, with a one-foot ruler, you would be able to account for curvature of the coast which would have otherwise been passed over with the yardstick. Further, if you were to measure the coastline with a six-inch ruler, you would get a greater value than that of the one-foot ruler, and a three-inch ruler would give you a greater value still. In this sense, the length of a coastline becomes a function of the measurement scale used.
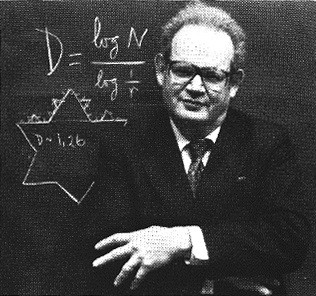
Benoît B. MandelbrotThough there was no term to describe this self-similar pattern at the time, Mandelbrot would later term this phenomenon “fractal” in his 1975 book Les Objects Fractals: Forme, Hasard et Dimension. In fact, Mandelbrot observed this peculiarity of self-similar patterns almost everywhere in nature: crystals, the shapes of mountains, the structures of plants, the clustering of galaxies, lightning, anything with a “rough” look and feel to it. Even the arrangement of neurons in the brain is not exempt from this fractal organization. Not limited to the strictly physical, fractal patterns have been observed in everything from music to paintings to, as nature would have it, the movement of financial market prices.
Fractal Theory in the Financial Markets
In the context of financial markets, the look and feel of the chart is relative to the timeframe being observed. When looking at the market from a perspective of several years, the period from one month to the next may look relatively smooth. When the focus is narrowed to a particular year, the prices from month to month look increasingly rough. As the view becomes increasingly myopic, the charts become increasingly rough, similar to the aforementioned coastlines. Despite this increasing roughness, at each viewing dimension, these prices exhibit some form of self-similarity in that they are directing themselves in a manner akin to those of greater viewing dimensions.
This observation is nothing new to many involved in market analysis; in 1991 and 1994, Edgar E. Peters published Chaos and Order in the Capital Markets and Fractal Market Analysis: Applying Chaos Theory to Investment and Economics, respectively, expanding upon this fractal market hypothesis. Benoît Mandelbrot and Richard L. Hudson explore the world of finance from a fractal perspective in The Misbehavior of Markets: A Fractal View of Financial Turbulence.
Application of Fractal Theory
To use this information in the context of the foreign exchange market, trader and author Bill M. Williams proposed, among other things, a fractal indicator which is included in all copies of the MetaTrader platform. This indicator locates series of consecutive bars where either the highest high is preceded and followed by two or more lower highs, marked as a buy fractal, or the lowest low is preceded and followed by two or more higher lows, marked as a sell fractal. These markers become valuable indicators of support and resistance levels.
Knowing the support and resistance levels is arguably the most valuable knowledge a spot trader can have, as they represent prices where the supply meets the demand. When the price breaks these levels, it is known as a breakout, and traders may expect that the price will continue in that direction. When the price tests the levels but does not break them, it is known as a retracement, and traders may expect that the price will continue to revert away from the support or resistance level it had previously been near.
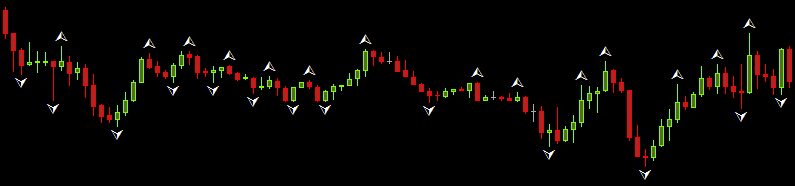
Figure 1: EURUSD M15 chart with the Fractals indicator applied.
The fractal indicator is a powerful tool to identify where these support and resistance levels are located. Many existing indicators augment the standard fractal indicator and draw line placements for traders to more easily relate the price to previous fractals marked on the chart. A common issue with fractal trading, however, is knowing which fractal levels continue to be relevant to the most recent market conditions. For example, a fractal observed hundreds of bars ago may still be relevant to the price due to its location, while a fractal observed only ten bars ago may no longer be relevant due to swings in the market. Being able to identify these relevant fractals while filtering the noise would be of a great benefit to traders looking to incorporate price action into their trading strategies.
Relevant Fractals
All fractals have what can be seen as a source fractal. A source fractal is the previous fractal in the opposing direction. For example, if there were a buy fractal at some arbitrary location on the chart, then its source fractal would be the most recent sell fractal prior to said buy fractal. This source fractal is of great importance, as its location indicates whether the fractal itself is still a relevant marker of a support or resistance level; if the price were to pass the point of a source fractal, then the fractal to which it sources may be seen as irrelevant to current market conditions, as the starting swing to the fractal had been broken.
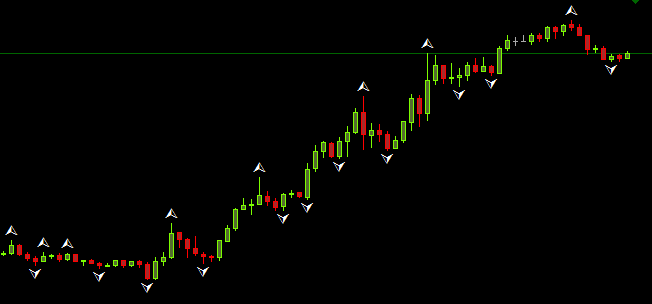
Figure 2: USDCHF M15 with the Fractals indicator applied.
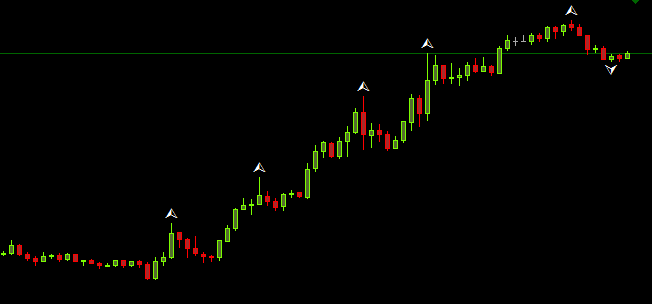
Figure 3: USDCHF M15 with only the relevant fractals visible.
Figure 2 shows the fractals for the USDCHF pair on the M15 timeframe. Figure 3 shows the same chart without the fractals whose sources have been broken by the price. As the short-term trend is up, the majority of the relevant fractals are buy fractals, where the resistance has become the support.
Taking this concept one step further, relevant fractals located within the same region of each other suggest that this price zone is a significant area of support or resistance, more so than a fractal found at a price distant from other relevant fractals. Identification of these regions is of great use to a trader, as it suggests that the region is of greater significance and, subsequently, more likely to indicate where breakouts are likely to occur.
Identification of Fractal Clusters
Deducing the boundaries for a region of relevant fractals may appear subjective at first glance, but there are in fact mathematically-driven approaches to grouping known as clustering algorithms. Among these algorithms is the density-based spatial clustering of applications with noise (DBSCAN) data clustering algorithm. The general idea behind DBSCAN is to iterate over each data point, in this case the relevant fractals, and locate all additional relevant fractals within a set distance. For each fractal within that distance, perform the distance check from that fractal and continue until there are no new fractals within range of another. Putting these fractals together produces a cluster of fractals and, it follows, the support or resistance region of interest to the trader.
The last step to the process is determining what distance should be used when seeking neighboring fractals. Again, no subjectivity here, as the standard deviation of the price provides that distance for us. In statistics, the standard deviation quantifies how much dispersion from the average of a data set exists; the greater the standard deviation, the greater the variance in the data set. Translated to financial markets, the standard deviation of the price quantifies how volatile the market is; the greater the standard deviation, the more volatile the market.
Using the standard deviation of the price as the distance from which neighboring fractals should be sought closes the mathematical circle of the DBSCAN algorithm, allowing us to objectively cluster relevant fractals into key zones of support and resistance.
Making the Trade
With all of this information to take into consideration, performing the calculations by hand may prove tedious; identification of relevant fractals requires going back hundreds of bars, drawing lines from these points may be tedious, and the standard deviation (and clusters of fractals) are constantly changing due to fluctuation of market conditions. This process can be automated using an indicator I have written for MetaTrader 4. Figure 4 shows how this view appears to the user.
Figure 4: The Fractal SR Clusters indicator applied to the EURJPY M15 chart. Relevant fractals within the price’s standard deviation of each other are grouped within the thin orange lines.
Finally, when trading breakouts or retracements, consideration of the trend has to be taken. MetaTrader 4 provides an Average Directional Index indicator, which quantifies the strength of the trend, as well as the option to draw trendlines on the chart. Whether you use trendlines or your eyes to gauge the trend, always make sure that the Average Directional Indexvalue is of moderate strength (as a rule of thumb, greater than 25) and the breakout or retracement observed by the movement of price within fractal clusters is in the direction of the observed trend before making a trade.
From there, the rest is up to you. Money management is key when trading; setting take profit levels at neighboring clusters is a good approach to take, using Fibonacci levels when no such neighboring cluster exists, while using a risk/reward ratio of 1:2 or 1:3 when setting stop losses allows you to minimize losses and maximize gains. As always, money management is integral to a good trading strategy.
When Benoît Mandelbrot popularized the concept of fractals by introducing the term and its mathematics to the world in 1975, he offered an approach to financial markets upon which many have built in the decades since. Using these properties of fractals as regions of support and resistance, foreign exchange market traders can identify areas of likely price breakout or retracement with greater precision than otherwise possible.

")
![[XAUUSD]: Weekly Liquidity Activation Points (timings), June 22-26, 2026](https://c.mql5.com/6/1013/splash-preview-771790.png "[XAUUSD]: Weekly Liquidity Activation Points (timings), June 22-26, 2026")
