Qiyas Baghirov / Profil
- Information
|
nein
Erfahrung
|
22
Produkte
|
7
Demoversionen
|
|
0
Jobs
|
0
Signale
|
0
Abonnenten
|
Ich bin Entwickler mit Spezialisierung auf algorithmische Handelssysteme und Expert Advisors (EA) für MetaTrader-Plattformen.
Meine Arbeit konzentriert sich auf risikokontrollierte Strategien, wobei der Schwerpunkt auf Drawdown-Management, Kapitalschutz (Equity Protection) und der Anpassung an reale Marktbedingungen liegt.
Ich entwickle und teste meine Expert Advisors hauptsächlich auf Echtgeld- und Cent-Konten und verzichte dabei auf Überoptimierung sowie unrealistische Versprechen.
Mein Ziel ist es, stabile, transparente und langfristig nutzbare Handelssysteme zu entwickeln – nicht kurzfristige Hype-Systeme.
⚙️ Spezialisierung:
Entwicklung von Expert Advisors (MT4 / MT5)
Risiko- und Kapitalschutzsysteme (Equity Protection)
Auf XAUUSD spezialisierte Handelsstrategien
Tests unter realen Marktbedingungen und Performance-Überwachung
📊 Transparenz und ein verantwortungsbewusstes Risikomanagement sind die Grundprinzipien all meiner Projekte.
QB Institutional Bands NR
https://www.mql5.com/en/market/product/180187?source=Site+Market+MT4+Indicator+New+Rating006
Recomedation Setting:
QB Institutional Bands NR – User Guide
Introduction
QB Institutional Bands NR is a professional MetaTrader 4 indicator designed for trend analysis, market direction filtering, volatility detection, and institutional-style trading visualization.
The indicator combines:
Dynamic trend bands
Non-Repaint / Repaint modes
Multi-Timeframe Dashboard
BUY / SELL signal system
Signal statistics engine
Volatility and probability analysis
Institutional market structure visualization
The indicator is optimized for:
XAUUSD (Gold)
Forex pairs
Indices
Crypto markets
Main Features
• Non-Repaint Mode
Uses only closed higher timeframe candles for safer and more stable signals.
• Repaint Mode
Updates signals dynamically using the live higher timeframe candle for more aggressive trading.
• Institutional Bands
Displays:
Outer volatility bands
Inner trend bands
Trend blocks
• BUY / SELL Signal System
When market trend changes:
BUY signal appears
SELL signal appears
The indicator automatically draws:
Vertical signal lines
BUY / SELL labels
• Multi-Timeframe Dashboard
Displays trend direction from:
M5
M15
H1
H4
D1
• Statistics Panel
Tracks:
Total BUY signals
Total SELL signals
Positive signals
Negative signals
Positive pips
Negative pips
Net difference
Installation
Step 1:
Open MetaTrader 4.
Step 2:
Go to:
File → Open Data Folder
Step 3:
Open:
MQL4 → Indicators
Step 4:
Copy:
QB Institutional Bands NR.ex4
into the Indicators folder.
Step 5:
Restart MT4 or refresh Navigator.
Step 6:
Drag the indicator onto the chart.
Understanding the Bands
Outer Gold Bands:
Extreme volatility zones
Possible take profit or exhaustion zones
Inner Blue Bands:
Main trend direction area
Dynamic market structure
Blue Blocks:
Bullish market structure
Red Blocks:
Bearish market structure
Signal Logic
BUY Signal:
Generated when trend changes from bearish to bullish.
SELL Signal:
Generated when trend changes from bullish to bearish.
Signals are displayed using:
Vertical lines
BUY / SELL labels
Dashboard Explanation
The dashboard appears on the right side of the chart.
Current Trend:
Shows:
BUY
SELL
NEUTRAL
Mode:
Shows:
NON-REPAINT
REPAINT
Current TF:
Current chart timeframe.
Higher TF:
Higher timeframe used for calculations.
Trend Strength:
WEAK TREND
NORMAL BUY/SELL
STRONG BUY/SELL
Volatility:
LOW
NORMAL
HIGH
BUY Probability:
Estimated directional probability based on MTF alignment.
Continuation:
Trend continuation strength percentage.
Session:
ASIA
LONDON
NEW YORK
MTF Matrix:
Displays trend direction for:
M5
M15
H1
H4
D1
Statistics Panel
The statistics section tracks historical signal performance.
Total BUY:
Number of BUY signals detected.
Total SELL:
Number of SELL signals detected.
Positive Signals:
Signals that produced positive movement.
Negative Signals:
Signals that produced negative movement.
Positive Pips:
Total accumulated profitable points.
Negative Pips:
Total accumulated losing points.
Net Difference:
Positive pips minus negative pips.
Repaint vs Non-Repaint
NON-REPAINT Mode:
Safer
Stable
Recommended for live trading
Signals do not change after candle close
REPAINT Mode:
Faster
More responsive
Signals can update dynamically
More aggressive style
Recommended Timeframes
Recommended:
M15
M30
H1
H4
Scalping:
M1
M5
Swing Trading:
H1
H4
D1
Best Trading Conditions
Best sessions:
London
New York
Avoid:
Extremely low volatility markets
Major news spikes without confirmation
Trading Tips
• Use higher timeframe confirmation.
• Strong BUY/SELL signals are safer.
• Use Non-Repaint mode for professional execution.
• Combine with proper risk management.
• Always test settings on demo first.
Important Notes
This indicator is a technical analysis tool.
It does not guarantee profits.
Trading involves risk.
Always use:
Stop Loss
Risk management
Proper lot sizing
Author
QB Institutional Bands NR
Developed by:
Qiyas Baghirov
© 2026 All Rights Reserved.
I am currently preparing a new professional liquidity-based indicator for MetaTrader 4.
This tool is designed to help traders understand the market step by step, without guessing.
The indicator will visually show:
BUY setup sequence:
1. Price moved below sell-side liquidity
2. Liquidity sweep confirmed
3. Strong bullish candle appeared
4. BOS confirmed
5. BUY signal
SELL setup sequence:
1. Price moved above buy-side liquidity
2. Stop hunt confirmed
3. Strong bearish rejection candle appeared
4. CHOCH / BOS confirmed
5. SELL signal
The goal is simple:
See it. Understand it. Trade it.
The product will be published soon on MQL5 Market.
QB Institutional Bands NR QB Institutional Bands NR ist ein Premium-Indikator für die technische Analyse in MetaTrader 4 (MT4), der von Qiyas Baghirov entwickelt wurde, um Trends, Volatilitätszonen und institutionelle Marktstrukturen zu identifizieren. Er bietet algorithmische Handelsvisualisierungen in Echtzeit für verschiedene Anlageklassen wie Gold (XAUUSD), Devisen, Indizes und Kryptomärkte. Wichtige technische Mechanismen Zweischichtige Volatilitätsverfolgung: Besteht aus äußeren goldenen
https://www.mql5.com/en/market/product/180014?source=Site+Market+MT4+Indicator+New+Rating006
https://www.mql5.com/en/market/product/180018?source=Site+Market+MT5+Indicator+New+Rating006
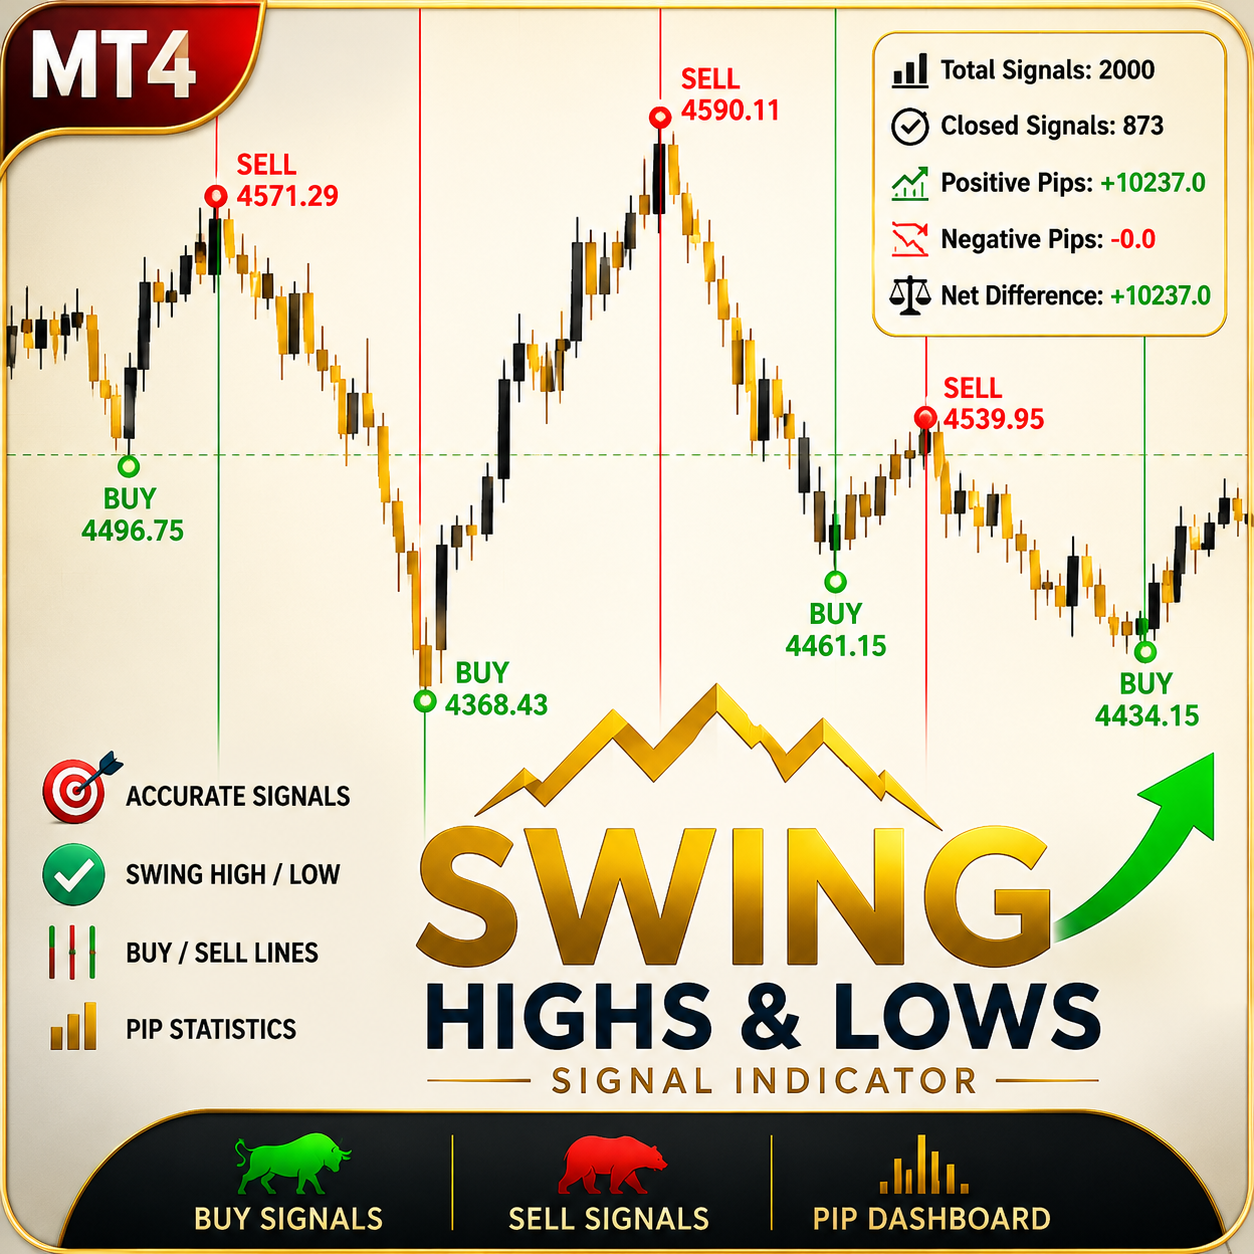
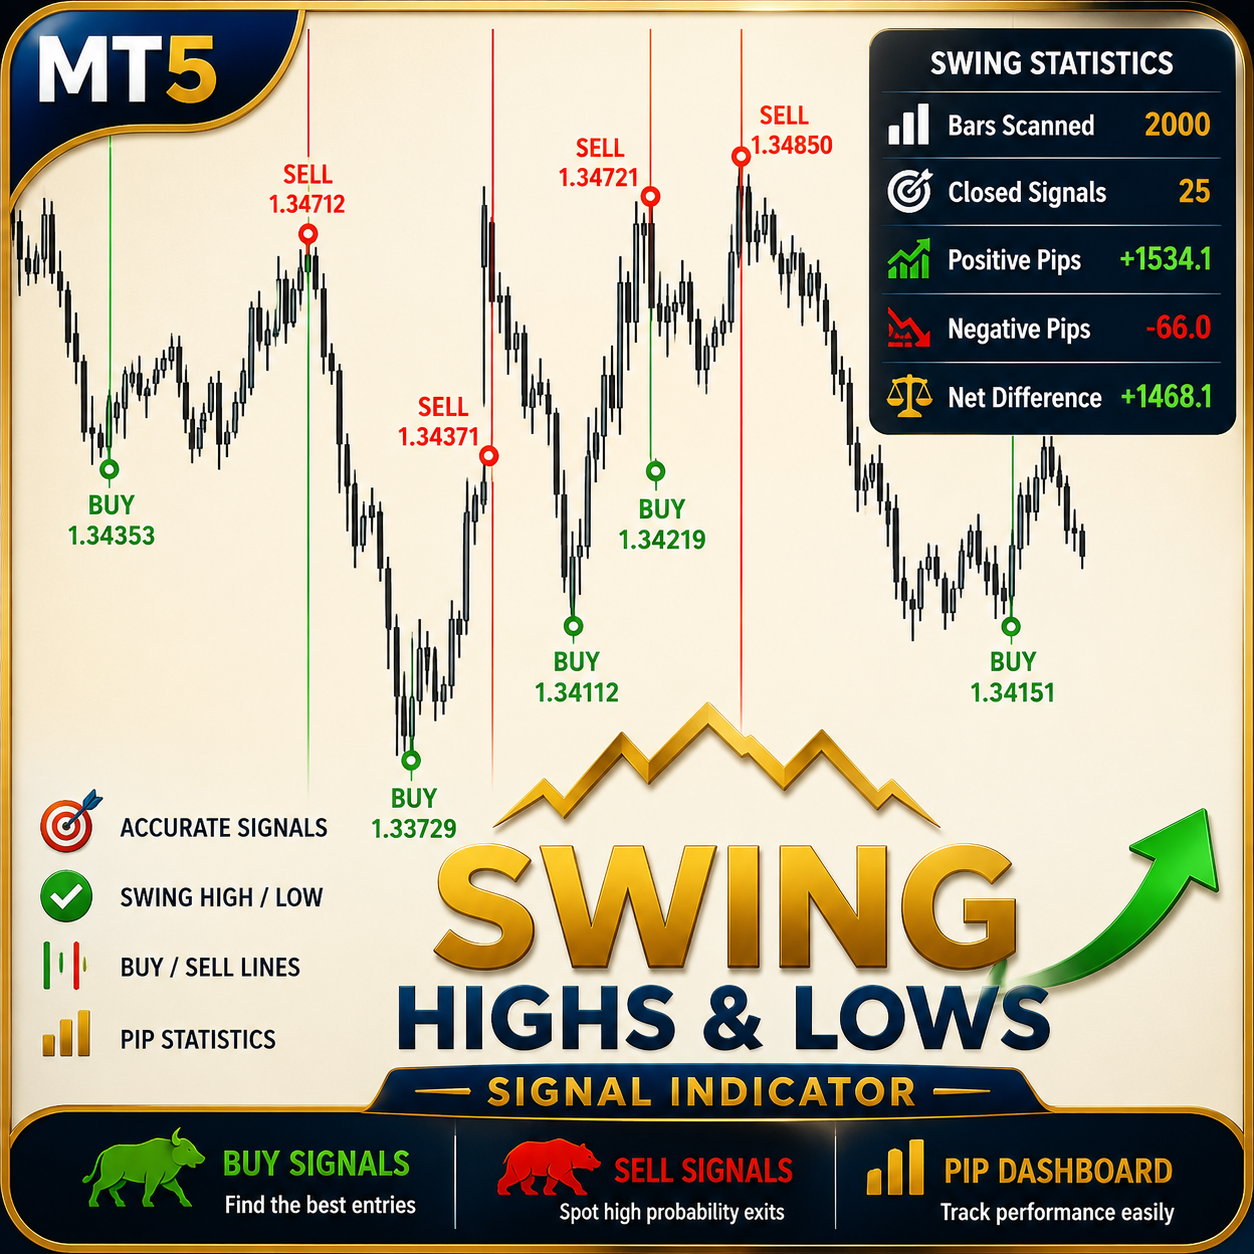
Hochs, Tiefs und Kerzenmuster – Pro „Swing Highs Lows Candle Patterns Pro“ ist ein professioneller Price-Action-Indikator, der entwickelt wurde, um wichtige Swing-Hochs, Swing-Tiefs und Candlestick-Muster mit hoher Umkehrwahrscheinlichkeit automatisch zu identifizieren. Der Indikator kombiniert die Analyse der Marktstruktur mit einer Bestätigung durch Kerzenmuster, um Tradern dabei zu helfen, potenzielle Kauf- und Verkaufschancen zu erkennen, ohne den Chart zu überladen. Im Gegensatz zu
Smart Multi Timeframe Fractals - Benutzerhandbuch Übersicht Smart Multi Timeframe Fractals ist ein MetaTrader 4-Indikator, der bestätigte Fraktalsignale direkt auf dem Chart anzeigt. Der Indikator kann sowohl Fraktale für den aktuellen Zeitrahmen als auch Fraktale für höhere Zeitrahmen wie M5, M15, M30, H1, H4 und D1 anzeigen. Der Hauptzweck dieses Indikators besteht darin, Händlern dabei zu helfen, wichtige Marktumkehrpunkte, Unterstützungs- und Widerstandszonen sowie Bestätigungsbereiche auf
1. Installation
Open your MetaTrader 4 platform.
Go to File → Open Data Folder.
Open the folder:
MQL4 → Indicators
Copy the indicator file into this folder.
Restart MetaTrader 4 or refresh the Navigator panel.
Find SMART REVERSAL PATTERN INDICATOR in the Navigator.
Drag and drop it onto your chart.
2. How the Indicator Works
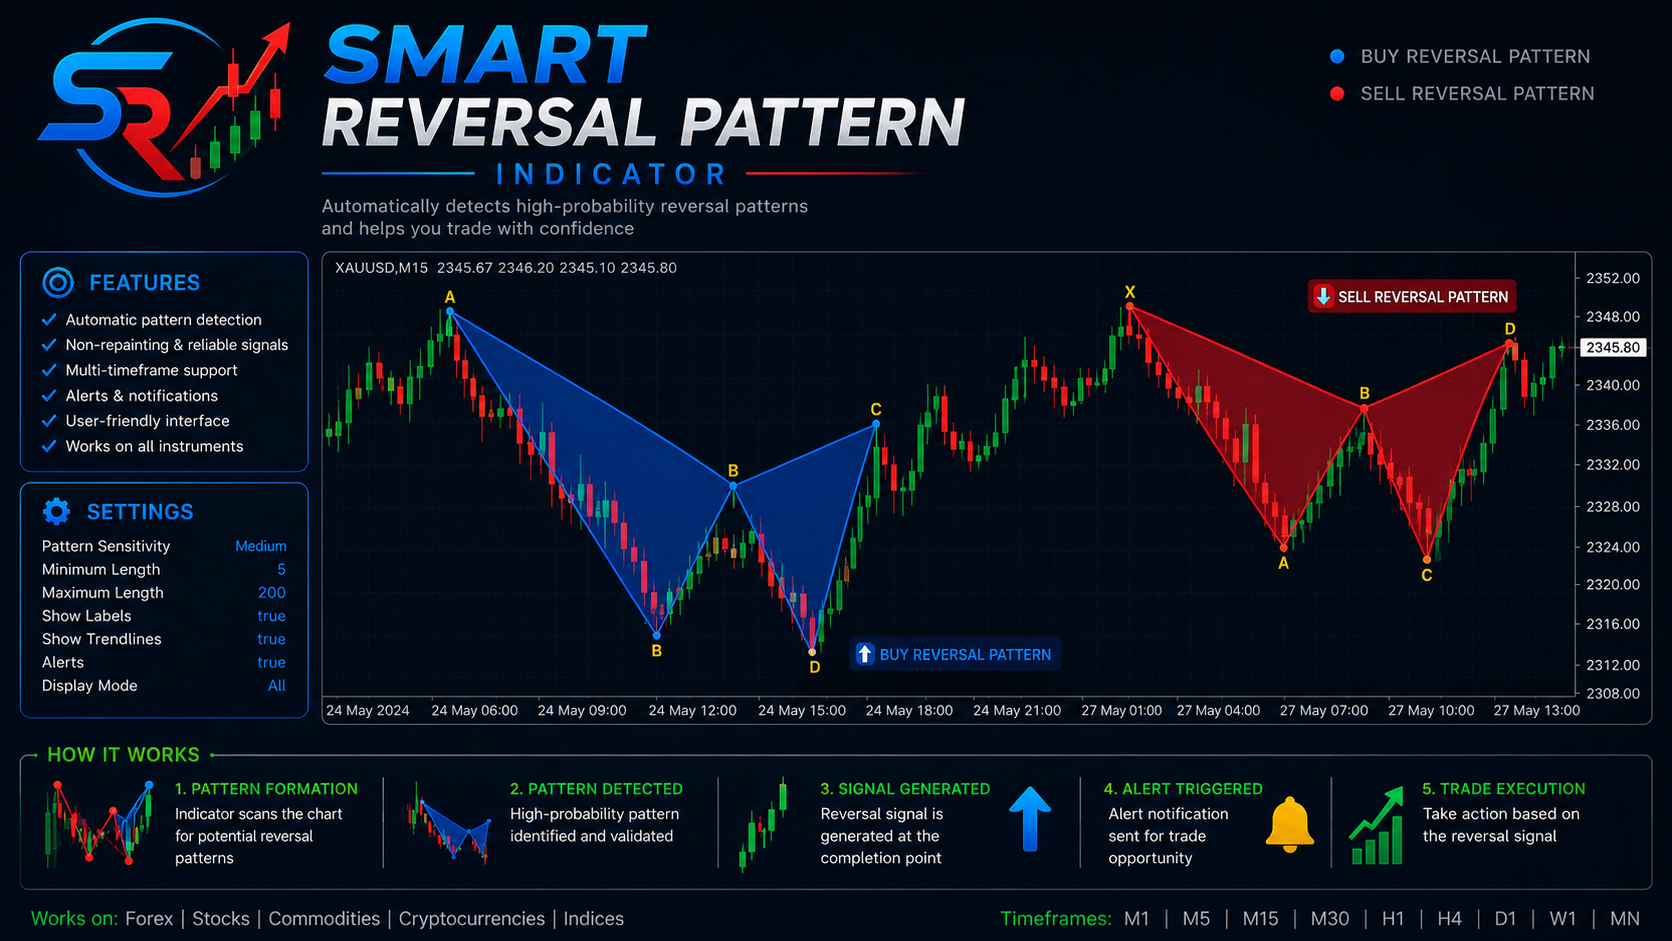
SMART REVERSAL PATTERN INDICATOR detects reversal pattern structures based on ZigZag swing points.
The indicator marks the latest reversal formation directly on the chart using trendlines, filled pattern zones, and X-A-B-C-D labels.
When a bullish reversal structure is detected, the pattern is displayed in blue.
When a bearish reversal structure is detected, the pattern is displayed in red.
The indicator can also send alerts when a new reversal pattern is detected.
3. Main Inputs
ZigZagDepth
Controls the sensitivity of swing detection. Higher values detect larger market swings.
ZigZagDeviation
Defines the minimum price deviation required for ZigZag movement.
ZigZagBackstep
Controls how close ZigZag points can be to each other.
LookbackBars
Defines how many candles the indicator scans for pattern detection.
BuyPatternColor
Color of bullish reversal patterns.
SellPatternColor
Color of bearish reversal patterns.
BuyTextColor
Text color for bullish reversal signal labels.
SellTextColor
Text color for bearish reversal signal labels.
PointTextColor
Color of X, A, B, C, and D labels.
ShowLabels
Shows or hides chart labels.
EnableAlert
Turns platform popup alerts on or off.
EnablePush
Enables mobile push notifications.
EnableEmail
Enables email notifications.
4. Signal Interpretation
BUY Reversal Pattern
A blue pattern means the indicator has detected a potential bullish reversal structure.
SELL Reversal Pattern
A red pattern means the indicator has detected a potential bearish reversal structure.
The signal should not be used alone. It is recommended to confirm the signal with market structure, support and resistance, trend direction, volatility, and risk management.
5. Recommended Usage
Use the indicator on liquid trading instruments such as Forex pairs, Gold, indices, or other active markets.
Recommended timeframes:
M15, M30, H1, H4
For scalping, lower timeframes can be used, but signals may be more frequent and require stronger confirmation.
6. Alerts
When alerts are enabled, the indicator notifies you when a new reversal pattern appears.
To use mobile push notifications:
Open MetaTrader 4.
Go to Tools → Options → Notifications.
Enable Push Notifications.
Enter your MetaQuotes ID.
Enable EnablePush = true in the indicator settings.
To use email alerts:
Go to Tools → Options → Email.
Configure your email settings.
Enable EnableEmail = true in the indicator settings.
7. Important Notes
This indicator is a technical analysis tool and does not guarantee future market movement.
Always use proper risk management.
Backtest and forward test the indicator on a demo account before using it on a real trading account.
Market conditions, spread, volatility, and broker execution may affect trading results.
https://www.mql5.com/en/market/product/178753?source=Site+Market+MT4+Indicator+New+Rating006
SMART REVERSAL PATTERN INDICATOR - Benutzerhandbuch 1. Installation Öffnen Sie Ihre MetaTrader 4-Plattform. Gehen Sie zu Datei → Datenordner öffnen . Öffnen Sie den Ordner: MQL4 → Indikatoren Kopieren Sie die Indikator-Datei in diesen Ordner. Starten Sie MetaTrader 4 neu oder aktualisieren Sie das Navigator-Panel. Suchen Sie SMART REVERSAL PATTERN INDICATOR im Navigator. Ziehen Sie ihn auf Ihr Diagramm und legen Sie ihn dort ab. 2. Wie der Indikator funktioniert SMART REVERSAL PATTERN INDICATOR
FVG iFVG Smart Zones ist ein professioneller MetaTrader 4 Indikator zur automatischen Erkennung und Visualisierung von Fair Value Gaps (FVG) und Inverse Fair Value Gaps (iFVG) direkt auf dem Chart. Der Indikator erkennt automatisch bullische und bärische Ungleichgewichtsbereiche basierend auf Marktstruktur und Preisineffizienzen. Die Zonen werden in Echtzeit mit sauberen Smart-Rechtecken und optionalen Labels dargestellt, um die Chartanalyse zu verbessern. Hauptfunktionen: • Automatische
Благодаря тебе у меня получилось всё нормально настроить. Очень ценю твою помощь и поддержку!