|
8+ Jahre
Erfahrung
|
32
Produkte
|
147
Demoversionen
|
|
0
Jobs
|
0
Signale
|
0
Abonnenten
|
👑 Theoretischer Physiker, Programmierer, Händler mit 15 Jahren Erfahrung.
------------------------------------------------------------------------------------------
💰 Präsentierte Produkte:
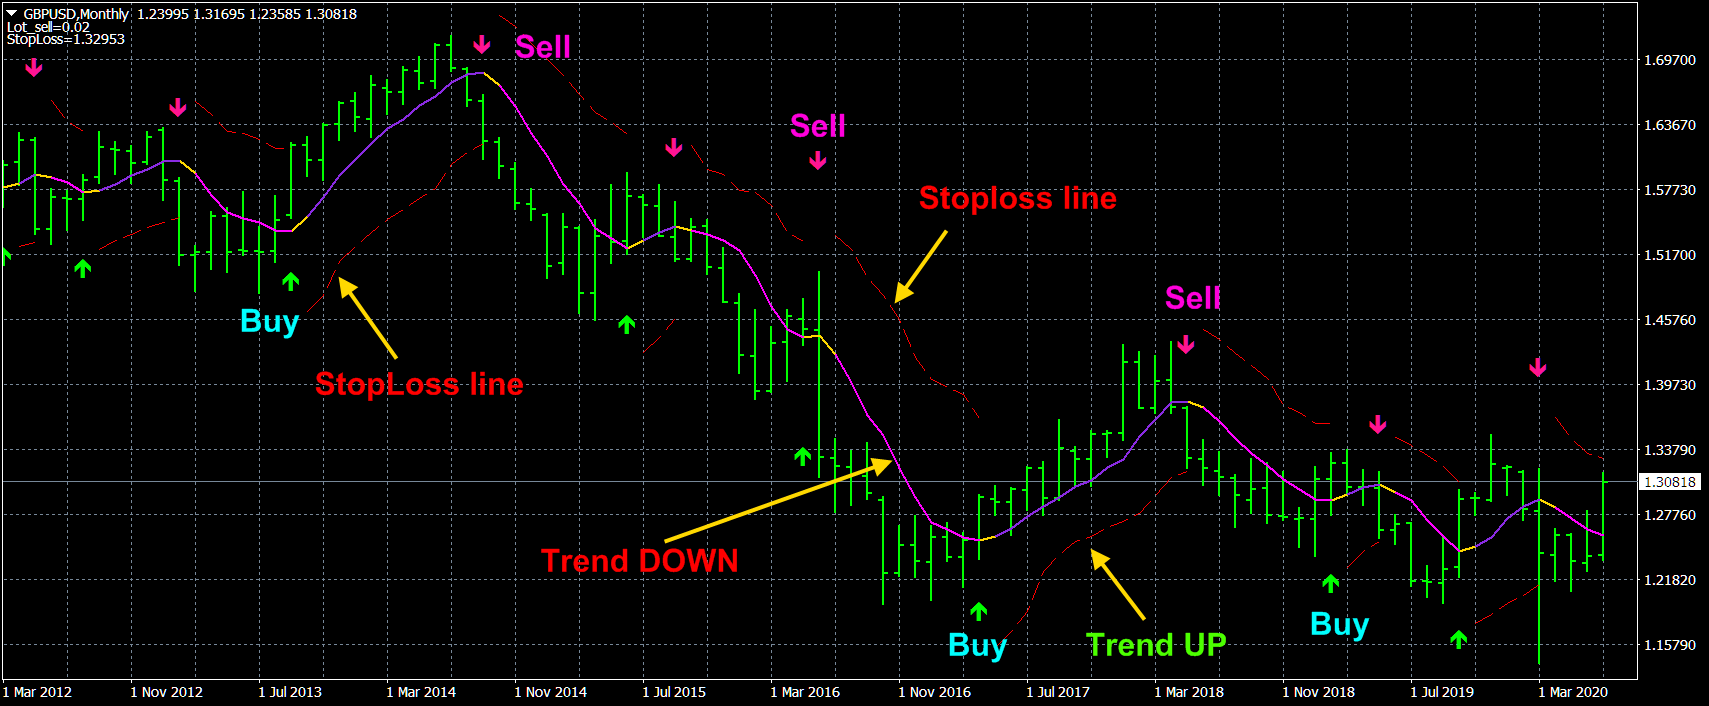
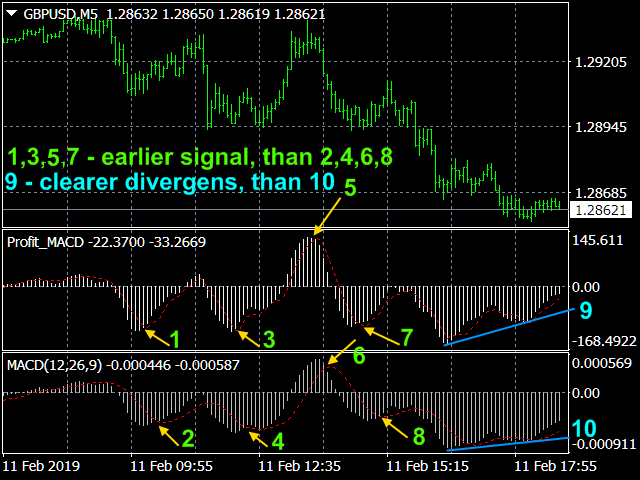
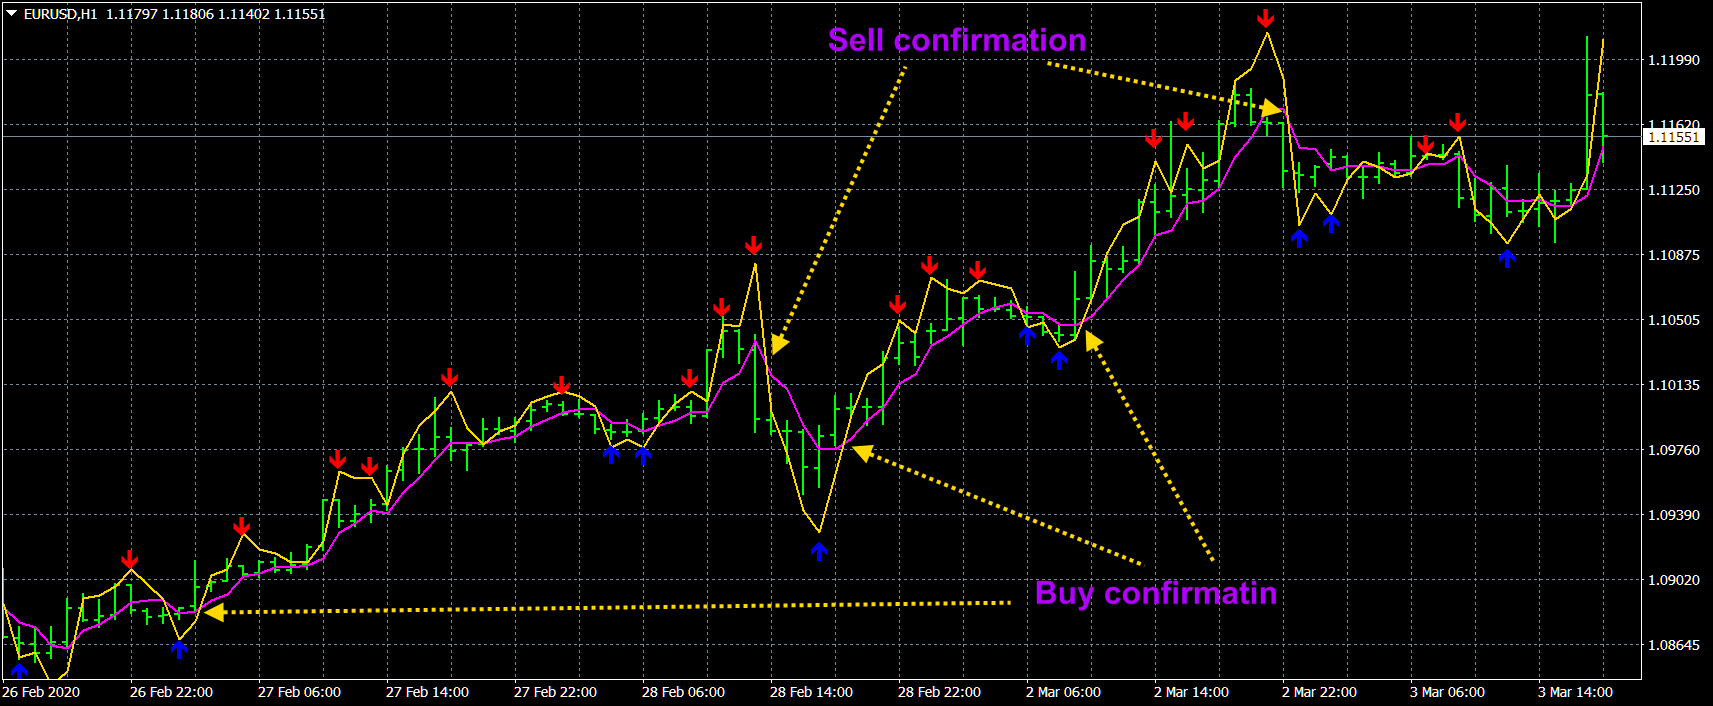
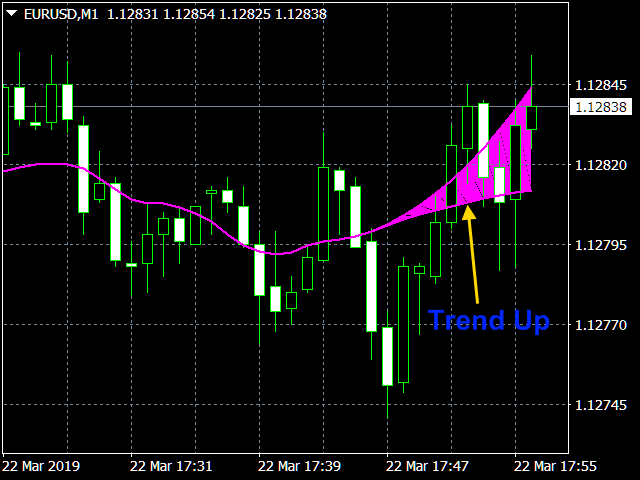
1) 🏆 Indikatoren mit optimaler Filterung von Marktgeräuschen (zur Auswahl von Öffnungs- und Schlusspositionen).
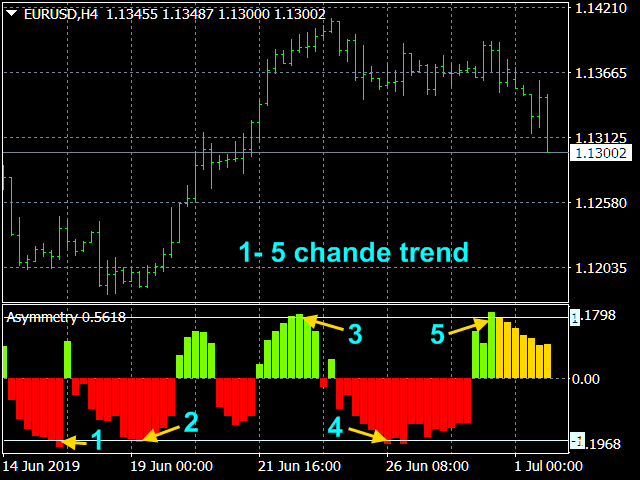
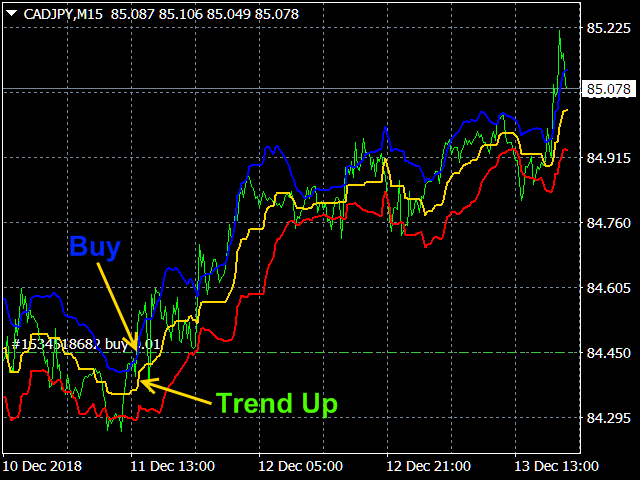
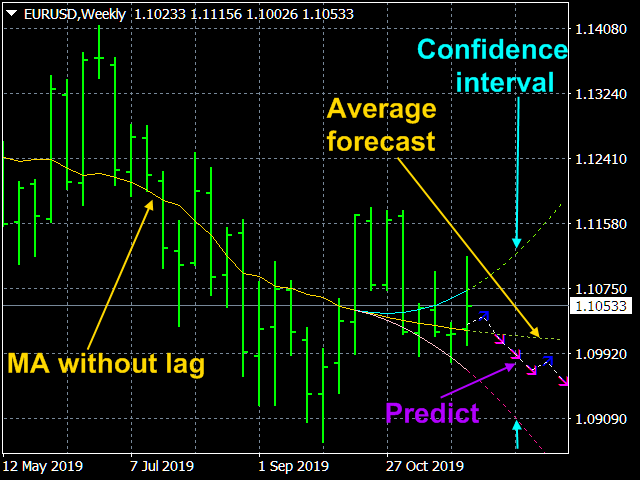
2) 🏆 Statistische Indikatoren (zur Bestimmung des globalen Trends).
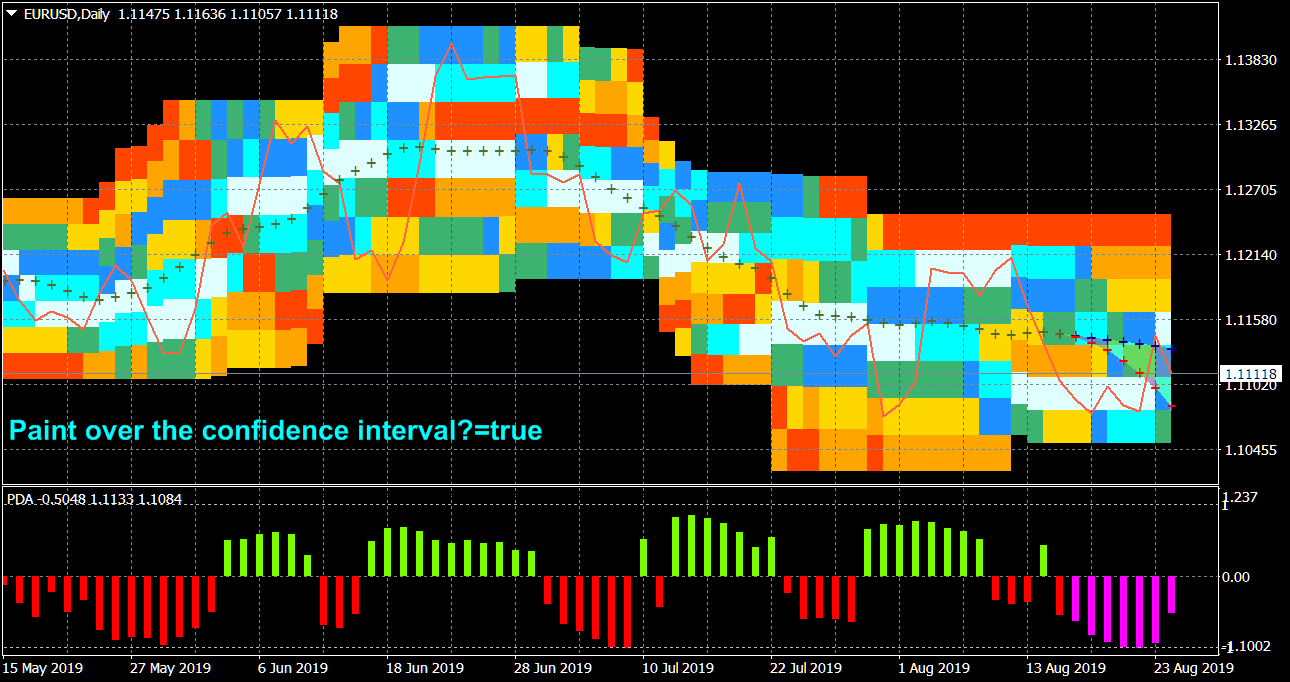
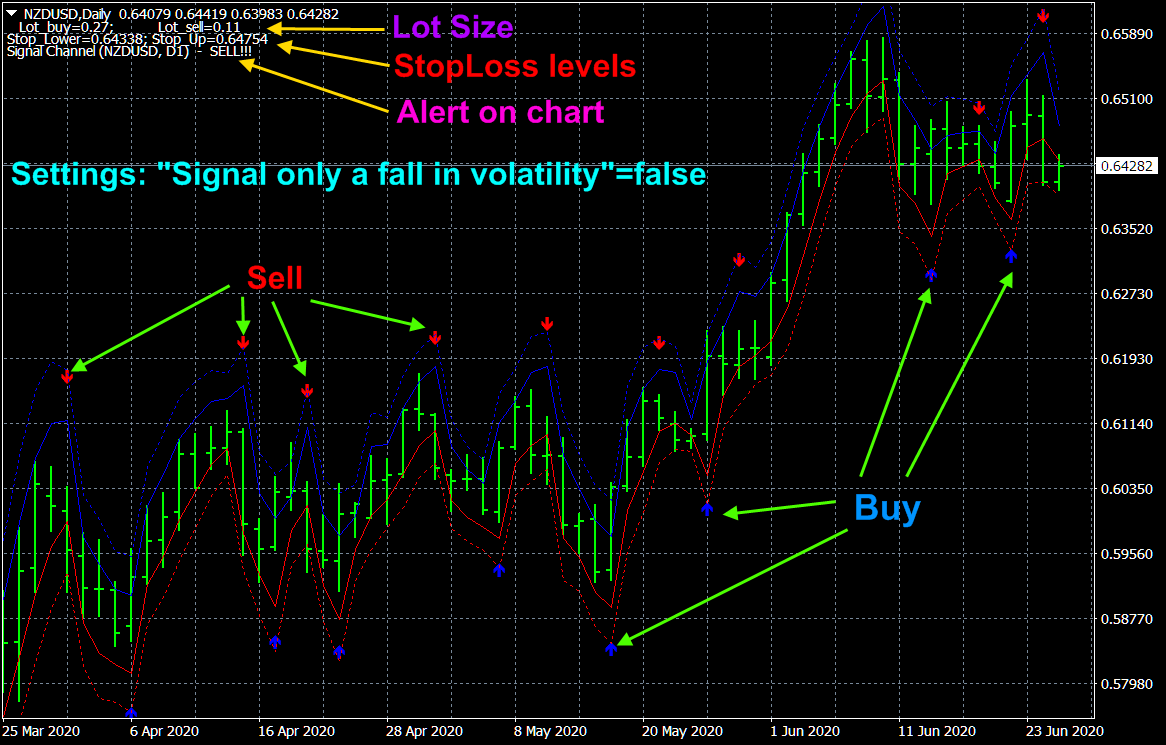
3) 🏆 Marktforschungsindikatoren (um die Mikrostruktur der Preise zu klären, Kanäle aufzubauen, Unterschiede zwischen Trendumkehrungen und Pullbacks zu identifizieren).
------------------------------------------------------------------------------------------
☛ Weitere Informationen im Blog https://www.mql5.com/en/blogs/post/741637
------------------------------------------------------------------------------------------
💰 Präsentierte Produkte:
1) 🏆 Indikatoren mit optimaler Filterung von Marktgeräuschen (zur Auswahl von Öffnungs- und Schlusspositionen).
2) 🏆 Statistische Indikatoren (zur Bestimmung des globalen Trends).
3) 🏆 Marktforschungsindikatoren (um die Mikrostruktur der Preise zu klären, Kanäle aufzubauen, Unterschiede zwischen Trendumkehrungen und Pullbacks zu identifizieren).
------------------------------------------------------------------------------------------
☛ Weitere Informationen im Blog https://www.mql5.com/en/blogs/post/741637

Aleksey Ivanov

· 1
votija.63
2023.02.28
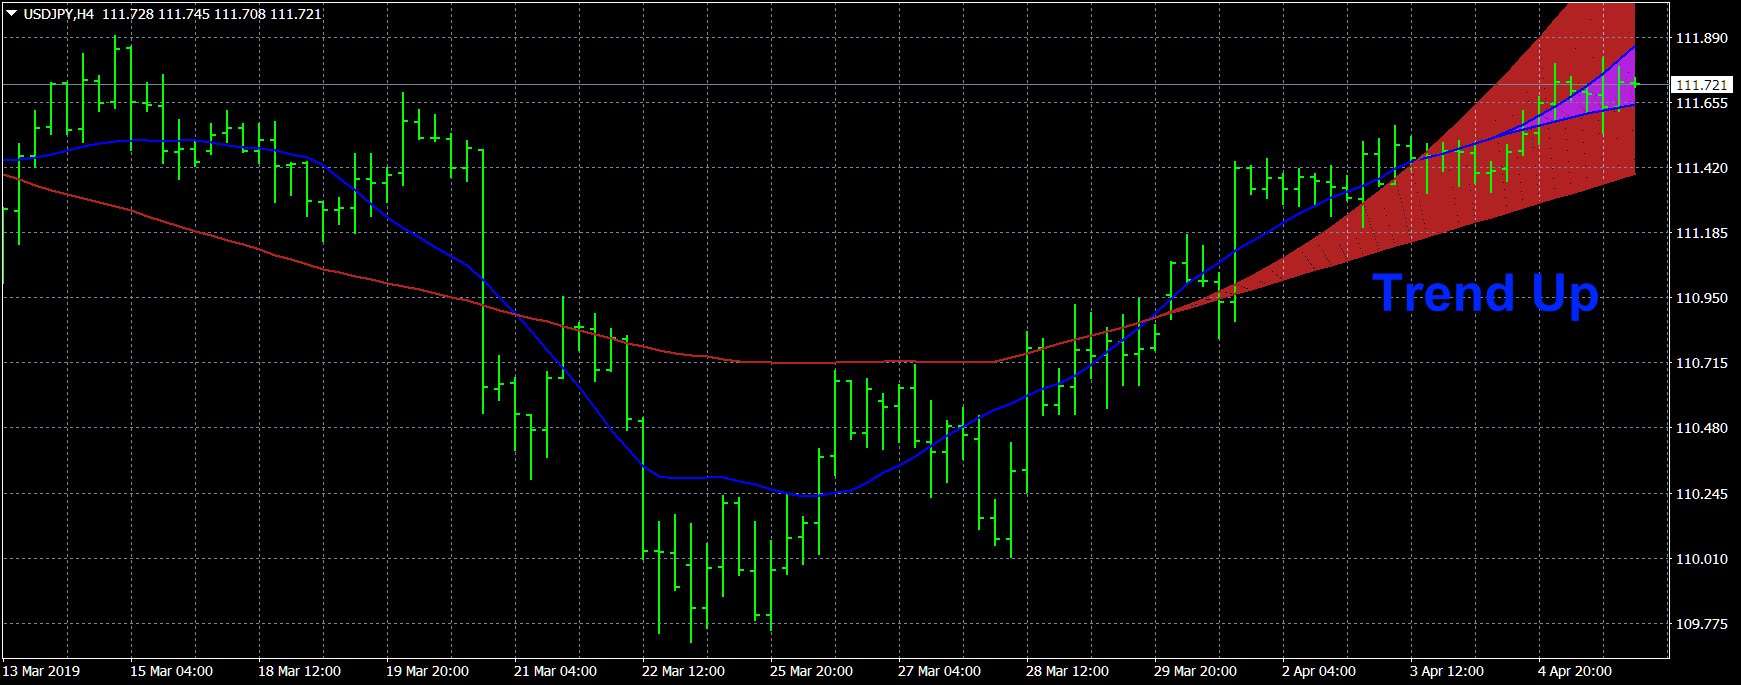
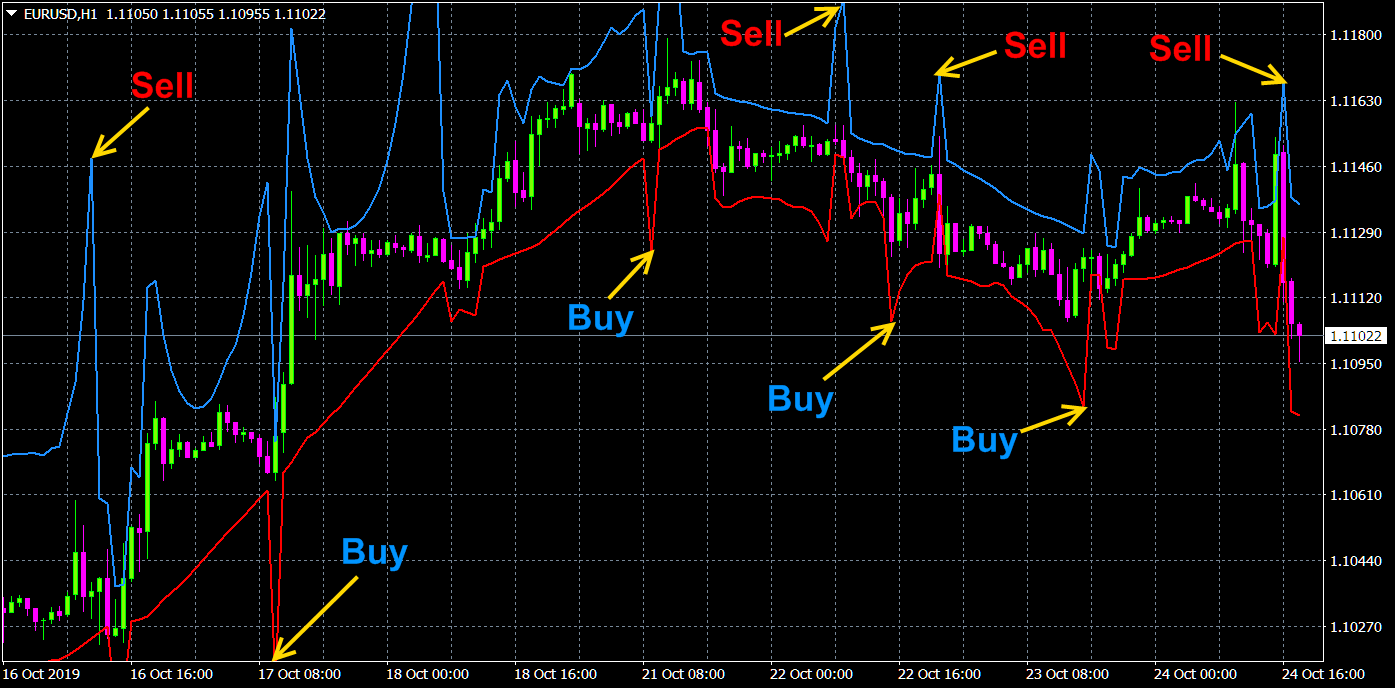
I don't know about you!! but red, everyone associates it with sell, and blue or green with buy!!! I don't want to think how good it is!!
Aleksey Ivanov
2023.03.01
The red line is the lower border of the channel. The blue line is the upper border of the channel.
Aleksey Ivanov
2023.03.01
In another indicator mode, arrows with your favorite colors are shown.