MyTrendFinder
- Indikatoren
- Version: 250.3
- Aktivierungen: 5

Mein Trend-Finder
//****************************
KOSTENLOSES Signal, das alle dreimeiner Indikatoren verwendet, können Sie gerne kopieren
siehe Link unten
https://www.mql5.com/en/signals/1318509?source=Site+Signale+Mein
//****************************
Periode ist die einzige Einstellung, im Grunde die Anzahl der Balken auf dem von Ihnen gewählten Zeitrahmen,
Anhängen an ein Diagramm mit beliebiger Zeitskala
Zeitraum in Balken = 7, was ein kurzer Überwachungszeitraum ist, 100 wäre eine längere Überwachung
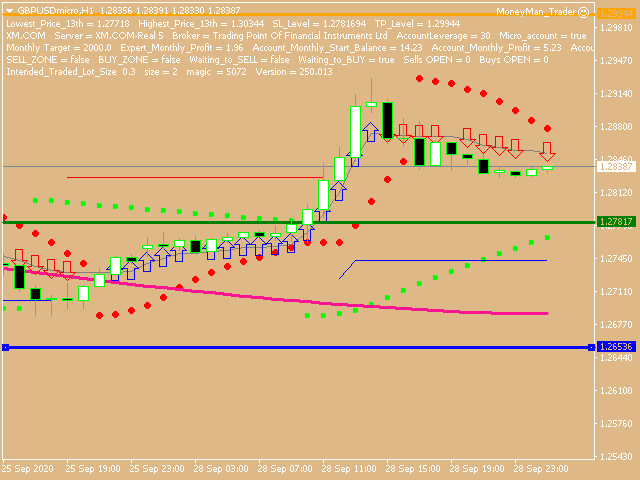
Ich verwende diese Einstellung auf einem Ein-Stunden-Chart. Kein Pfeil bedeutet, dass ich mir nicht sicher bin, der blaue Pfeil zeigt einen Aufwärtstrend an, während der rote Pfeil einen Abwärtstrend anzeigt.
Alle Einstellungen können für jeden beliebigen Zeitraum verwendet werden. Wenn Ihnen die von mir verwendeten Einstellungen nicht gefallen, spielen Sie einfach mit den Einstellungen für jeden beliebigen Zeitraum herum
bis Sie ein Setup gefunden haben, das zu Ihrem Handelsstil passt.