Zigzag Zotik
- Indikatoren
- Version: 1.0
- Aktivierungen: 5
Der Zigzag Zotik-Indikator zeigt die Kursbewegung in Form eines Zickzacks auf der Grundlage der Werte des AO_Zotik-Indikators an.
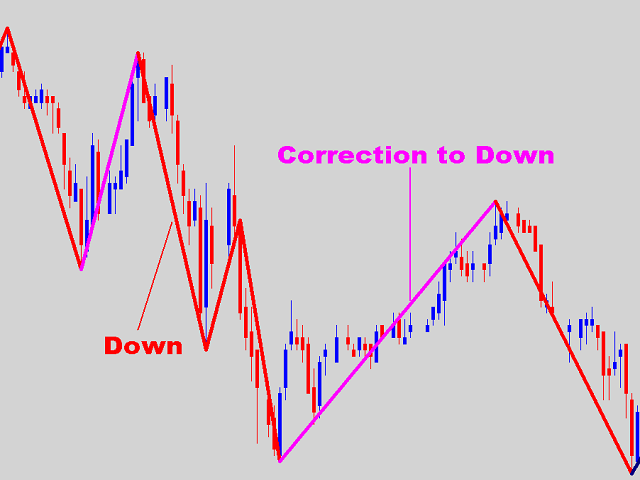
Der Zigzag Zotik-Indikator zeigt die Trendbewegungen und deren Korrekturen an.
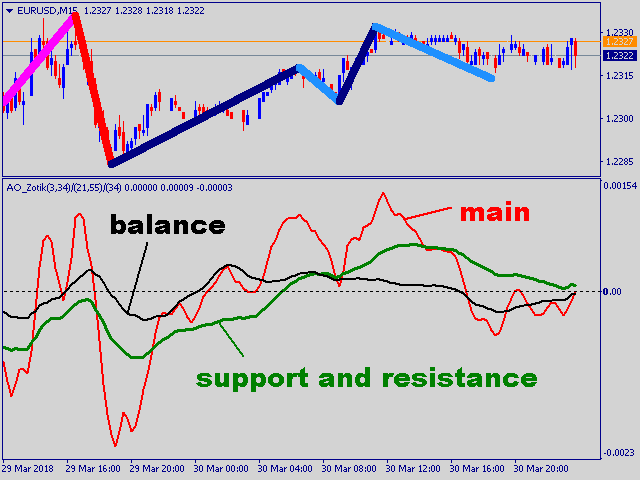
Der AO_Zotik Indikator besteht aus drei Linien, die sich relativ zu "0" bewegen:
- "Hauptlinie";
- "Unterstützungs- und Widerstandslinie";
- "Gleichgewichtslinie".
- Die "Hauptlinie", die die "Unterstützungs- und Widerstandslinie" kreuzt, zeigt das Ende einer Welle und den Beginn einer anderen an. Der Indikator Zigzag Zotik zeigt dies auf dem Chart an, indem er die Richtung des Zickzacks ändert.
- Wenn die Unterstützungs- und Widerstandslinie über "0" liegt, liegt eine aufsteigende Bewegung vor. Der Zigzag Zotik-Indikator zeigt dies auf dem Chart durch eine einfarbige Trendlinie an.
- Liegt die Unterstützungs- und Widerstandslinie unter "0", handelt es sich um eine Abwärtsbewegung. Der Zigzag-Zotik-Indikator zeigt dies auf dem Chart mit einer andersfarbigen Trendlinie an.
- Liegt die "Unterstützungs- und Widerstandslinie" über "0" und kreuzt die "Hauptlinie" die "Unterstützungs- und Widerstandslinie" und die "Gleichgewichtslinie" nach unten, dann liegt eine Korrektur dieser Aufwärtsbewegung vor. Der Zigzag Zotik-Indikator zeigt dies auf dem Chart durch eine andersfarbige Trendlinie an.
- Wenn die "Unterstützungs- und Widerstandslinie" unter "0" liegt und die "Hauptlinie" die "Unterstützungs- und Widerstandslinie" und die "Gleichgewichtslinie" nach oben kreuzt, dann findet eine Korrektur dieser Abwärtsbewegung statt. Der Zickzack-Zotik-Indikator zeigt dies auf dem Chart durch eine andersfarbige Trendlinie an.
Parameter des Indikators
- NumberOfBars - Anzahl der berechneten Balken.
- width - Breite der Zickzacklinien.
- i_colUp - Farbe der aufsteigenden Bewegung.
- i_colDown - Farbe der absteigenden Bewegung.
- i_colUpCor - Farbe der korrigierenden aufsteigenden Bewegung.
- i_colDownCor - Farbe der korrigierenden absteigenden Bewegung.

Мені дуже подобається, 5 зірок! Але... Можна було б його зробити мтф і щоб його можливо було застосовувати одразу 2 індикатори на одному графіку, щоб вони показували той таймфрейм що я використовую та старший таймфрейми одночасно на одному графіку.