在Facebook查找我们! 加入我们的粉丝群
使用MetaTrader 5新的可能性
基于该指标AO比尔威廉姆斯顾问“Gold profitx1”。显示了黄金,差价合约等图表的好成绩 止损 - 动态。 选项: TP - 止赢止损的百分比(从101到1000) pctp - 终场前就赢利的位置一半比例,下半年转移到盈亏平衡点(0.01〜1) Lot - 位置尺寸(0.02〜100) 注意:你的经纪人一定要保持局部平仓。
"Expert X" Expert Advisor using the Martingale system (grid). Only the basic parameters are used: tp - Take Profit from the average price of all the opened orders in one direction; step - step to place new orders; mult - multiplier for new orders. When you attach the Advisor to the chart you can choose which positions the Expert can open (Long, Short or Long&Short).
本 EA 针对小资金或是大资金均可工作。只是依据您的起始手数。 本 EA 使用 蓝蝴蝶 指标。 它可与 AUDUSD, NZDUSD 在 M15 时间帧工作。 实盘账户监控: https://www.mql5.com/zh/signals/33021 , https://www.mql5.com/zh/signals/50542 常用推荐 使用 StartLots=0.01 每 500-1 000 货币单位 使用不同的魔幻数字来同步交易几个货币对 输入参数 本 EA 在四位或五位平台上均可工作。按照 5 位数字指定输入参数的点数值,EA 将自动换算 4 位数字。 StartLots - 初始手数; StopLoss - 入金百分比作为止损; GridStep - 订单间隔点数; Martin - 加仓手数的倍数; LockOrderNo - 首单锁定单号; Klock - 来自可用序列的锁定比率 (单位分数); TakeProfit - 止盈; TrailStart - 激活移动止损的盈利点数; TrailDistance - 移动止损距离; TrailStep - 移动止损步长;
本 EA 不使用任何技术指标。当价格速度开始急剧增加,则 EA 将按照它的移动方向开单。测量当前价格的速度,基于突破虚拟级别,即从价格到设置在 PriceStep 的距离,并在 TimeStep 指定的秒数之后修改。本 EA 不使用高风险交易策略, 如马丁格尔, 并且不采用任何技术指标。本 EA 在 4 和 5 位报价平台上均可工作。建议的最小存款是 100 美元, 货币对是 EURUSD 和 EURJPY。 本 EA 包括缺口保护功能,它可以在周五收市前将所有持仓平仓,并在周一之前不再开新单 - TimeOnFriday 参数。为测试 EA,在策略测试员里启用可视模式并设置所有报价。时间帧无所谓。 参数 MaxRisk - 每笔交易的最大风险; Lots - 固定交易手数, 如果 MaxRisk = 0; TakeProfit - 止盈点数; StopLoss - 止损点数; ProfitClose - 盈利为本金的 % 则平仓; MaxDrawdown - 回撤为本金的 % 则平仓; TrailingStart - 开始尾随停止; TrailingStep
Description A universal indicator CCI together with moving averages based on it. Depending on the need, moving averages can be disabled. You can color the indicator lines and levels: lines of CCI, moving average lines and thresholds of overbought and oversold levels. The indicator can be calculated as the standard one on the basis of a price or as a derivative on the basis of the following eighteen other indicators included in the standard package of the MetaTrader 4 terminal: AD - an indicato
您试过网格策略吗? 现在, 您不必再花时间坐在您的电脑前。仅需开一单, 则 手工交易者 将完整剩余的! 这是一键交易!简单点击面板上的 买 或 卖 按钮, 以及 手工交易者 将设置一个止盈, 挂单和尾随终止。 开单之后,您就可以做其它事情了。 您可以用策略测试的可视模式对产品进行检查。 输入参数 Buy - 买单按钮。 Sell - 卖单按钮。 Close - 所有持仓平仓。 Lots - 首单开仓手数。 Step - 生成网格的步距。 Martin - 后续订单的乘数。 TakeProfit - 止盈点数。 SLPersent - 止损为本金百分比; 若不使用设为 0。 TrailStart - 止盈点数, 开始放置尾随终止。 TrailDistance - 价格距尾随终止的点数。 TrailStep - 尾随终止步距点数。 Orders - EA 放置挂单的数量。 Slippage - 订单执行时的滑点点数。 TimeOut - 开单失败后的重复尝试间隔,以秒为单位。
思路 指标在价格接近行情顶部或底部时,将价格图表颜色改为红色和蓝色。本系统不会产生意想不到的信号。图表渐次喷绘,您总能知道某一时刻价格相对于潜在轴点的实际位置。如果价格同时远离行情底部和顶部,柱线被着色为白色。柱线不涂色。 指标算法 指标的操作原理如下: 一条基线被选中。这可以是一条回归线或一条移动均线。 从此价格的偏差被确定。 添加线的弯曲值。 如果价格自它的均值偏离太远,并有转向倾向,我们可能会认为它是行情顶部或底部。 此策略在时间尺度选择正确时工作出色。但是我们也看到,例如,在一个尺度里的底部,在另一个尺度里也许是顶部。这就是为什么在此指标里选择大量不同周期的基线,并叠加每条线的计算数据。这就是概率原理所要做的工作。当强烈偏离大多数线时, 且大多数线有转向倾向, 此时价格的转向概率很大。越接近行情底部,柱线颜色越接近蓝色。当接近行情顶部,柱线转为红色。 设置 BarsToCount - 历史数据中柱线数量。此参数仅影响着色的柱线数量,不影响它们的颜色。 UseRegression - 使用回归线作为基准线。 UseMA - 使用均线作为基准线。前两个功能可以一起使用,其结果将被叠
Currency Power Meter shows the power of major currencies against each other. The indicator shows the relative strength of currency/pair at the current moment in a period of time (H4, daily, weekly, monthly). It is useful for day traders, swing traders and position traders with suitable period options. Currency power is the true reason of market trend: The strongest currency against the weakest currency will combine into a most trending pair. As we know, trend makes money and all traders love tre
超级仓鼠 EA 是一宽专为 NZDUSD 设计的 EA。它即使用最少本金也可工作。 此 EA 基于 RSI + 它有两个附加过滤器, 使用马丁格尔功能将亏损交易扭亏为盈,并可以根据本金的百分比设置止损功能。 购买 EA 之后, 您将免费收到更新和优化! 我将帮助您选择正确的参数以便实现任何目标 (增加本金, 用于 PAMM 账户的低风险, 稳定的信号分布)! 实盘监控账户信号在此: https://www.mql5.com/zh/signals/33021 输入参数描述 本 EA 在四位或五位平台上均可工作。按照 5 位数字指定输入参数的点数值,EA 将自动换算 4 位数字。 StartLots - 初始手数; Depo - 随着余额增长,手数自动增加指定数值。0 值禁用该功能; RsiPeriod - RSI 周期; RsiPrice - RSI 计算的价格; Rsi1 - 优化参数 (多头仓位); Rsi2 - 优化参数 (空头仓位); GridStep - 订单间隔点数; Martin - 随后的订单手数系数; LockOrderNo - 根据锁定的持仓开单; Klock -
The FxBrainBot EA is a math based Expert Advisor. He uses the Period and the Power combined with the weight of Alpha, Beta, Gamma and Delta to enter a trade. Due to his ability of adapting to nearly any market conditions, this Expert Advisor can be optimized for almost any currency pair and timeframe. To reduce your risk you can use a Money Management system and a simple Trailing Stop. Parameters for the FxBrainBot Period = This is the number of periods the FxBrainbot uses for his calculations.
This Expert Advisor is a fast scalper system for working with pending orders. It is a safe system with low risk. It uses fast price movement to gain a few pips of profit. It does not use stop loss placing two pending orders instead. The product works fine with the broker having low spread and zero stop level. The default sets are optimized for EURUSD, but you can try to optimize it for other pairs. The Expert Advisor is very simple to use and easy to be optimized for several pairs. Parameters Au
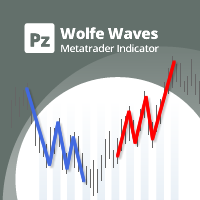
Wolfe Waves是所有金融市场中自然发生的交易模式,代表着争取均衡价格的斗争。这些模式可以在短期和长期时间内发展,并且是存在的最可靠的预测反转模式之一,通常早于强劲和长期的价格波动。 [ 安装指南 | 更新指南 | 故障排除 | 常见问题 | 所有产品 ] 清除交易信号 极易交易 可自定义的颜色和尺寸 实施绩效统计 显示适当的止损和获利水平 它实现了电子邮件/声音/视觉警报 指示器同时绘制图案和突破箭头,以防止指示器在展开时重新绘制图案。但是,如果输入突破发生多次,则可能会少量重绘(不是很频繁),从而导致指示器重新绘制。该指示器为非底漆。 狼波的定义 沃尔夫波必须具有以下特征。 波浪3-4必须停留在1-2创建的通道内 波浪4在波浪1-2产生的通道内 波动5超出了波动1和3所创建的趋势线 输入参数 幅度-幅度表示替代价格点之间的最小柱线量。要找到大图案,请增加幅度参数。要查找较小的模式,请减小幅度参数。您可以在图表中多次加载指标,以查找不同大小的重叠图案。 突破期-可选的Donchian突破期,用于确认Wolfe Wave。零表示未使用。 最大历史柱线-指标在图表中加载时要
剥头皮策略指标,仅针对 M1 时间帧,适用于任何货币对。 每当您有时间在您的 PC 或笔记本前坐下来,在此指标的帮助下,您可以在 15-30 分钟内获利。 红线意为下跌趋势, 您要做空。 蓝线意为上涨趋势, 您要做多。 注意!在您开始交易过程之前, 很重要的事情是等待信号。
最好的实时外汇分析,以及为专业交易员和 EA 开发者使用的强大附加功能。 这清楚地布局瞬间为您展示全球外汇市场上进行交易的最佳货币组合。 每个主要货币对的强弱度在每次即时报价到达时计算,结果按照财经区域排序以便研究它们的关联性。 重要提示: 您必须在市场观察里显示所有外汇符号,才能得到 100% 的正确计算结果! 请下载 分析者专业版用户手册 得到详尽信息。 最佳实践: 强势区: 大于 5.5。 中性区: 在 3.5 和 5.5 之间。 弱势区: 小于 3。 简单策略: 买强卖弱 (例如, NZD: 5.9 和 CAD: 2.6 -> 做多 NZDCAD)。 额外功能: 在您希望的时候自动创建您自己的历史计算文件来验证您的交易和设置。 在您的全自动交易系统里,通过 iCustom 选择启用的缓冲区,并使用计算值来入场和出场。 此产品是我们的 蓝球交易系统 的一部分。
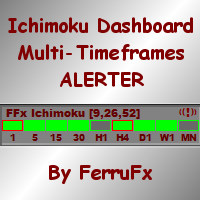
The FFx Dashboard MTF alerter will show you on a single chart all the timeframes (M1 to Monthly) with their own status for the indicator. 2 Alert Options: Single timeframe: each selected timeframe alert separately when a signal occurs Multi timeframes: all selected timeframes must agree for an alert to be triggered Both options have an input to select the timeframes to be used for the alert(s). How to understand the status: Green/Red square: Price above/below Cloud (Kumo) Green square + Red bo
There is a newer version available: Please follow this link to the new product version Powerplay is an easy-to-use trading system for beginners, advanced and professional traders. The multi timeframe display is the perfect complement to unleash the full potential of Powerplay. You'll see at a glance and for all timeframes at which direction the trend is running. Catch the trends at an early stage and ride the wave till it breaks. Improve your trading results with a great support and resistance i
你想成为一个持续盈利的五星级外汇交易商吗? 1. 阅读我们简单的 交易系统 的基本描述 以及 它在2020年的主要策略更新 2. 发送你的购买截图,以获得我们独家交易聊天的个人邀请 Lighthouse 是一个惊人的精确和可靠的支撑和阻力指标。 它显示最重要的交易水平,并根据其相关性绘制。 如果一个水平被明显打破,它将改变其作用和颜色。支撑位变成阻力位,反之亦然。 主要特点 自动调整到基础时间框架 只显示重要的支撑和阻力水平 如果一个水平被明显突破,立即作出图形反应 较厚的SR水平比较薄的水平更重要 一般设置 分析模式: 在三种不同的扫描模式(日内、中度和高度时间框架)中选择,或使用默认设置的自动调整。 自动模式根据基础图表时间框架调整使用的分析模式。 敏感模式。敏感模式可以识别更多的支持和阻力水平。如果您是一个日内交易员,我们建议使用它。将此设置为 false ,如果您想减少绘制的SR水平的数量。 SR距离(点)。这个可改变的数值是内置支撑和阻力位距离检查的基础。它测量当前价格与下一个Lighthouse水平之间的距离。如果当前价格与下一级别的距离超过5个点,你将看到 "等待
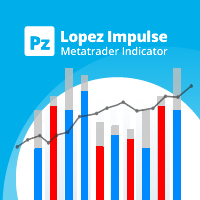
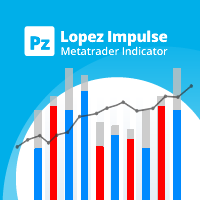
该指标同时评估波动率和价格方向性,从而发现以下事件。 [ 安装指南 | 更新指南 | 故障排除 | 常见问题 | 所有产品 ] 决定性和突然的价格变动 大锤子/流星图案 大多数市场参与者都支持强劲的突破 犹豫不决但动荡的市场形势 这是一个非常易于使用的指标... 蓝色直方图代表看涨的冲动 红色直方图代表看跌冲动 灰色直方图表示当前的波动率 移动平均线是平均波动率 该指标实施各种警报 指示器不重涂或重涂 ...具有直接的交易含义。 当看涨冲动超过平均波动率时,您可以购买 当看跌冲动超过平均波动率时,您可以卖出 该指标跟踪市场波动以及每个单个柱的看涨和看跌冲动。如果看涨的冲动超过平均波动率,那可能是做多空头的好机会。这些强劲的价格走势是可靠的,因为其他市场参与者可能会补仓。如果使用得当,此指示器功能非常强大。 作者 ArturoLópezPérez,私人投资者和投机者,软件工程师和Point Zero Trading Solutions的创始人。
该指示器基于renko,但其周期等于ATR指示器的周期。 XOATRHIST版本指示器,在图表上显示波段。更加信息化。 关闭波段以外的柱形,会形成x或者o , 这时候报警指示灯会提示 参数: §ATRPeriod - 用于计算ATR的步骤周期。§ 注意:指示器以收盘价格运作,因此需要考虑形成的柱形。 ------------------------------------------------------------------------ ------------------------------------------------------------------------ ------------------------------------------------------------------------
当进行外汇交易时, 我们同时交易一对货币。例如 EUR/USD。如果我们做多 EUR/USD 它意味着我们期望 EUR 相对于 USD 获得强势。如果我们做空 EUR/USD 它意味着我们期望 EUR 相对于 USD 获得弱势。您应该都很熟悉这个概念。 有关货币对的关键点是,它们只是表明一种货币 相对于 另一种的强度。如果我们看到 EUR/USD 上涨,是不是因为 EUR 正在加强,或 USD 正被削弱?不太可能只通过孤立地观察 EUR/USD 就这样讲。 本指标使用的公式,计算以下 8 种货币的 '货币强度': USD, EUR,GBP, CHF, JPY,CAD, AUD 和 NZD。
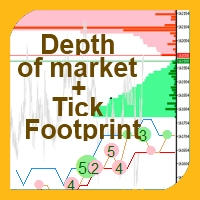
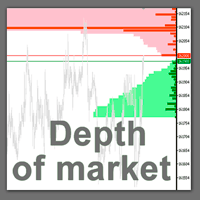
本指标可以让您享受两个最流行的产品来分析在感兴趣的价位的请求量和市场成交量: 真实市场深度图表 真实报价足迹成交量图表 本产品结合两个指标的效力,并以单个文件提供。 反危机出售。今日低价。赶紧! 真实的 COMBO 市场深度功能和报价成交量图表,完全等同于原始指标。您将享受这两款产品结合为单一超级指标的力量!下面是您将得到的功能: 真实市场深度图表 股民专用工具现已在 MetaTrader 5 上可用。 真实市场深度图表 指标在图表上以直方条的形式显示可视化的市场深度,并在实时模式下刷新。 利用 真实市场深度图表 指标您可以正确评估市场请求并从图表上看到大的市场。这可以 100% 的精确剥头皮和设置持仓止损。 指标以两种相应颜色的水平直方条形式显示买和卖的请求 (买-卖)。价格图表上给定级别的显示条和它们的长度与请求的交易量相应。此外, 它指示买卖请求的最大交易量。 此指标显示买卖请求总数量作为堆积面积图。这可以评估当经过下一价位时将会执行的请求总量。买卖请求总数量也显示在图表上。 省缺, 指标显示在图表背景上, 且它不会干扰任何其它指标。当使用指标交易时, 建议使用实际交易量。 本
Blue Butterfly is an implementation of Gartley Butterfly pattern. This indicator predicts price reversals well enough allowing traders to catch large movements (up to 1 000 pips) with small risks. Indicators for efficient traders cost about $300 and higher, while Blue Butterfly can be purchased at a more attractive price. The red butterfly indicates entering sells given that the price is closed below the rectangle (the so-called "reversal zone"). The blue butterfly indicates entering buys given
The indicator works on any currency pair. Preferred timeframes are from M15 to D1. When a signal is triggered, an appropriate arrow with a definite color and stop loss line is displayed on a chart. These lines can also be used as support/resistance levels. The indicator does not redraw. Below are my recommendations on working with the indicator. Open a trade after the signal is triggered and the next candle is closed. Stop loss is to be placed 5-30 points away from an arrow or a stop line. I ca
自适应剥头皮 EA 是一款多货币剥头皮 EA,用在 EURUSD 和 GBPUSD 的 M15 时间帧。使用若干策略,在市场条件下适应性强。交易基于若干指标,并且不是即时报价剥头皮 EA。自适应剥头皮 EA 使用一个智能风险管理系统 - 在 4 个时间帧里自动检测价格走势,并且根据当前条件行动。建议在低点差的经纪商平台和 VPS 上使用。您可以从 $100 开始。 参数: ExpertName = 改变 EA 名称,可以对经纪商隐藏 MagicNumber = 策略1 的独有号码 MagicNumber1 = 策略 2 的独有号码 MagicNumber2 = 策略 3 的独有号码 MagicNumber3 = 策略4 的独有号码 OpenHour = EA 开始工作时间 CloseHour = EA 停止工作时间 SafeMode = 智能风险管理系统, 请一直设为 True Lots = 如果 Risk = 0,固定交易手数 LotDecimal = 如果您的经纪商以 0.01 手开始,且增量为 0.01,将之设为 2。如果您的经纪商以 0.1 手开始,且增量为 0.1 手,将之
Energy Trade shows the currency strength, analyzes ticks that allows you to enter the market at the very beginning of the trend. Energy Trade is a good complement to any trading system. Values of Energy Trade range from 0 to 10: the higher the value, the stronger the currency; the smaller the value, the weaker the currency; average values of the indicator suggest that the currency is in flat. How to use - buy strong currencies and weak ones. The indicator has two scales: the first scale analyzes
The TimePeriodAlarm indicator shows time till closure of a bar. If the 'Time period:' is specified explicitly (not 'current'), the indicator displays the time till bar closure of the current period and the explicitly specified period. Ten seconds before the closure of the bar (at the period specified explicitly), a preliminary sound alert is played and a color alert is generated, then the main signal (can be set by the user) in the parameter 'Sound file(.wav)' is played. The sound file should be
Commodity Channel Index (CCI) is one of the popular oscillators widely used by traders to capture overbought and oversold areas of price action. Although the CCI indicator works fine for an interval of a market, it fails to generate profitable signals when market condition changes, and hence produces wrong signals which results in big losses. Have you ever thought about an adaptive CCI indicator that adapts its period of calculation based on the market conditions? The presented indicator impleme
Stochastic Oscillator is one of the most popular and accurate oscillators widely used by traders to capture overbought and oversold areas of price action. Although the Stochastic indicator works fine for an interval of the market, it fails to generate profitable signals when the market conditions change, and hence it produces wrong signals resulting in big losses. Have you ever thought about an adaptive Stochastic indicator that adapts its period of calculation based on the market conditions? Th
返佣机器人 执行大量交易,不光可以从外汇市场盈利,而且可以收到许多返佣 (返回点差的一部分)。 因为证券锁仓所需的保证金大约为 25-50% (依经纪商), 返佣机器人 在出现适当信号时双向并发下单。 下单基于 交易者之梦 指标的当前颜色。如果颜色为蓝, EA 走多头。如果颜色为红, 走空头。若价格走势方向错误, 则 返佣机器人 加仓。买和卖序列彼此不相连。它们之中的每一单都有自己的止盈和尾随终止。 常用推荐 您可以在所有货币对中并发启动 EA,经过测试的,或优化其它对; 使用经纪商提供的返佣; 证券所需的锁仓保证金越少越好。 输入参数描述 本产品在 4 和 5 位报价平台上均可工作。当使用 4 位报价时 Pips 乘以输入参数等于 1, 当使用 5 位报价时它是 10 (输入乘以 10)。 Intial Lot - 初始手数; Maximum Lot - 最大手数; Lot Multipler - 第二和后继开单的手数乘数; Maximum number of position - EA 的最大开单数; Pips multiplier - 若是 5-位报价,参数乘数为 10; G
There is a newer version available: Please follow this link to the new product version This clearly arranged display shows you instantly, which currency combination is best to trade on the global Forex market. The strength or weakness of every major currency is calculated tick by tick and the results are sorted by their economic areas to consider their correlation. Important notice: You have to display all Forex symbols in your market watch to get a 100% correct calculation result! Please downl
股票交易者的专业工具现已登陆 MetaTrader 5 。 真实市场深度图表 指标在图表上以直方条的形式显示可视化的市场深度,并在实时模式下刷新。 根据用户需要提供更新! 现在真实市场深度指标显示买卖交易请求的交易量比率 (B/S 率)。它显示每种请求类型占全部请求流的份额,以及绝对交易量。 怎么使用它?一般高频交易者的观点, 当某种请求占显著支配地位, 价格趋势将往请求方向倾斜, 即交易量大的。观察并使用我们的真实市场深度指标! 利用 真实市场深度图表 指标您可以正确评估市场请求并从图表上看到大的市场。这可以 100% 的精确剥头皮和设置持仓止损。 指标以两种相应颜色的水平直方条形式显示买和卖的请求 (买-卖)。价格图表上给定级别的显示条和它们的长度与请求的交易量相应。此外, 它指示买卖请求的最大交易量。 反危机出售。今日低价。赶紧! 此指标显示买卖请求总数量作为堆积面积图。这可以评估当经过下一价位时将会执行的请求总量。买卖请求总数量也显示在图表上。 省缺, 指标显示在图表背景上, 且它不会干扰任何其它指标。当使用指标交易时, 建议使用实际交易量。 本指标仅与提供市场深度的品种工作
Cross Alert is an all-in-one solution for oscillators' cross over and under. Cross Alert manages the levels for the cross under and cross over separately. Thanks to this you can use it to signal zero cross over (by fixing both levels, above to below, and below to above as zero) or over-bought and over-sold levels (like 70 and 30) as well. With CrossAlert you can also avoid alerts from one kind of crosses (overs or unders), for example if you are in an uptrend perhaps you do not want to have ale
Indicator works on the price chart based on D+/D- ADX crosses. It provides very clear signals for opening/closing positions by displaying colored arrows. Trend line (Moving Average adjusted by ATR) is color-coded according to the trend: trending up (green color)/trending down (salmon color). The product is very useful and simple for manual traders. It is complementary to the previous indicator ADXCross ACE .
該指標可以幫助你在開發/根據之字形指標測試您的策略。這是一個經典的之字形,它可以顯示點重新畫的市場走勢。 此外,指示器將顯示第一個和最後一個峰之間的差值(pips)已經形成了一個方向。
Lighthouse LITE is a great support and resistance indicator with a reduced set of available features provided by the full version of Lighthouse . It shows you the most important trading levels and draws them according to their relevance. It is also a useful addition for our new easy-to-use trading system for beginners and professional traders . With Lighthouse you can easily set your stops and profit targets. If a level is clearly broken, it changes its role and color. Support becomes resistance
AlievTM Sindi is a unique binary options indicator that can help you double and even triple your deposit. It works on any time frame and any currency pair. The indicator has a lot of parameters. So you can choose to trade in a risky or steady moderate mode. It is up to you. Recommendations: Work on M5 chart. Trade EURUSD, GBPUSD or GBPJPY. Use minimum risk.
复制交易者是用于 MetaTrader 4 终端的快速,简便,可靠的复制机。程序很容易使用。安装两个终端: 在其中一个终端上选择 "服务器" 模式, 即此终端是仓位源。 在另外一个终端上选择 "客户" 模式, 即此终端是仓位复制的目的地。 输入参数描述 Mode - 选择模式: Server 或 Сlient; 以下设置仅用于 Сlient 模式, 即它们用在目的地终端上。 Server account number - 运行 Server 模式的 EA 帐号。 Max. Slippage - 最大允许的滑点。 Lot Multiplier - 开仓的手数系数, 若为 1,则开仓手数与服务器端相同。 Prefix to be deleted - 如果服务器端有前缀,而客户端没有前缀,则删除前缀。 Suffix to be deleted - 如果服务器端有后缀 (如 ".m"),而客户端没有后缀,则删除后缀。 Prefix to be added - 如果服务器端有前缀,而客户端没有前缀,则添加前缀。 Suffix to be added - 如果必要,添加后缀。 及时的产品技术支持
指标-预测员。作为助理十分有用, 作为一个关键点来预测未来价格走势。 采用搜索历史中最相似的部分 (形态) 做出预测。 指标以绘制线条形式显示柱线收盘价的变化结果。历史深度, 预测柱线的数量, 形态大小和搜索品质可通过指标设置调整。 设置: PATTERN_Accuracy_ - 搜索品质。 PATTERN_Size_ - 形态大小 (柱线)。 PROGNOSIS_Bars_ - 预测柱线数量。 SEARCH_Deep_ - 搜索历史的深度 (柱线)。若设为零, 则搜索整个可用历史。 PROGNOSIS_Start_Bar_Shift_ - 开始预测的柱线数量。数量是在旧的柱线方向。0 是最新的柱线。
MACD indicator with overbought and oversold zones. Two display options - classic lines and a histogram. Can be used to detect a possible reversal or pullback in price, as well as for channel strategies All settings are simple and straightforward - all like a standard indicator, but with additional support and resistance levels Can be used both separately and together with other indicators
新闻交易 是一款简单, 迅速且便利的用于新闻交易的助手。 这是一键交易!您只需在面板上点击按钮 " 开单 ", 新闻交易 将在自当前价位的指定距离上放置两个带有止损和止盈的挂单,并在产生盈利后尾随停止。 输入参数描述: Open - 放置挂单的按钮。 Close - 将由 EA 开出的订单平仓。 Delete - 删除挂单按钮。 Lots - 放置挂单的手数。 Distance - 自当前价位放置挂单的距离。 Stoploss - 止损点数。 TakeProfit - 止盈点数。 Type -挂单类型: 突破或回调触发订单。 TrailStart - 尾随停止开始工作的盈利大小。 TrailDistance - 尾随停止自价位的距离。 TrailStep - 尾随停止步长点数。 Slippage - 订单执行时的最大允许滑点。 TimeOut - 若 EA 开单失败,重试开单的间隔时间,单位秒。 您可以用策略测试的可视模式对产品进行检查。
指标捕捉趋势并显示入场的点位。指标可在小时间帧内用于剥头皮,以及长线交易。
Description A colored universal indicator AO (Awesome Oscillator). The rising and falling of the indicator histogram can be colored. The indicator can be calculated as the standard one or as a derivative on the basis of the following eleven other indicators included in the standard package of the MetaTrader 4 terminal: AD - an indicator of accumulation and distribution of volume. OBV - On Balance Volume. Volume - tick volume indicator. Force - Force Index indicator. MFI - Money Flow Index. ATR
This is a panel for manual trading with automatic lot calculation. The demo version only work on EURO pair One Click Contest Features Risk percentage based on lot Close all orders Close all profit orders Close all loss orders
Did you have to start again the very same analysis because the original one, from where you want to modify, just have so much information that no longer fits? Have you ever wanted to change some in one of your charts and make this new line, Fibo or channel automatically appear in some or the rest of your set of charts? Object Copier is the solution to replicate any object into one or several charts at your desire. No matter if you changed an object, or made it from the scratch. With Object Copie
Elliott Wave Indicator 4 is an indicator for the MetaTrader 4 trading platform. Features: Automatic analysis of Elliott waves. Adjustable depth of analysis, wave labeling style and wave rules. Quick and very detailed analysis (depends on the BARS and ANALYSIS_DEPTH inputs). Works on any symbol and time frame. Can be used both on a real chart and in the Strategy Tester. Specifics: Classical wave analysis. Indicator recalculation time is directly proportional to the number of analyzed bars and w
本指标为任意选定的指标建立发散/收敛。 您可以用它的自定义设置自由添加自己的指标代码。 本指标有两条基本线绘制方法 (**): 从前一根柱线开始搜索封顶 (MODE = 0) 从指标与 "零轴线" 交叉以后开始搜索 (即, "零轴线" 为 RSI = 50.0) (MODE = 1) 基本设置包括 17 个包括在 MT4 终端里的标准指标,您可以自由添加您的任何指标。 当信号出现时,指标有内置的警示。 标准指标包括在设置里 (指标代码 (*)): AC (加速振荡器) (MODE = 0 / 1) AD (累积/派发) (MODE = 0) ADX (平均动向指数) by MAIN LINE (MODE = 0) ATR (平均真实范围) (MODE = 0) AO (动量振荡器) (MODE = 0 / 1) 空头力度 // (MODE = 0 / 1) 多头力度 // (MODE = 0 / 1) CCI (商品通道指数) (MODE = 0 / 1) DeMarker (MODE = 0 / 1) 强推指数 (MODE = 0 / 1) 动量 (MODE = 0) OsMA (移
你想成为一个持续盈利的五星级外汇交易商吗? 1. 阅读我们简单的 交易系统 的基本描述 , 以及它在2020年的主要策略更新 2. 发送您的购买截图,以获得您的个人邀请,参加我们的独家交易聊天 该交易管理器 是所有喜欢使用全自动交易管理的 FX趋势 用户的理想补充。 它立即检测您手动开启的交易,并沿FX趋势线自动管理其止损。 完全自由地浏览所有时间框架而不影响你的订单。 你的交易是根据你在交易经理属性中设置的固定计算设置来管理的。 一个非常特殊和强大的功能是检测和管理由外部专家顾问开出的订单。 设置正确的EA魔法号码,你就能够按照你的个人趋势交易风格管理这些EA订单 。 功能 介绍 自动检测有效订单 自动设置初始止损 自动跟踪止损 自动检测活跃的专家顾问订单 自动管理活跃的专家顾问订单 反趋势交易的安全止损 可选择使用盈亏平衡止损 可选择设置止盈 一些交易操作的通知选项 在所有种类的交易符号上运行,如外汇、股票、商品、债券等。 在所有种类的离线图表上运行,如Renko和范围条形图 主要设置 时间框架。从下拉列表中选择用于计算趋势线的时间框架 外汇趋势周期。选择你喜欢的趋势线计算的
本 EA 基于 交易者的梦想 指标 https://www.mql5.com/zh/market/product/2492 实盘账户监控: https://www.mql5.com/zh/signals/34001 无初始本金限制。 本产品在 4 和 5 位报价平台上均可工作。 本交易机器人使用两个参数定义横盘 - MaxPriceWidth 价格范围 (点数) 设置最后的柱线数量 (NumberOfBars) - 并根据指标的信号开仓。您可以在评论栏目里的设置或自行设置。 输入参数 Pips Multiplier - 使用 1 与 4 位报价工作或 10 当报价为 5 位时 NumberOfBars - 分析横盘的柱线数量 MaxPriceWidth - 价格范围 Stop Loss - 止损 Take Profit - 止盈 Trailing Stop - 尾随终止 MinProfitForTS - 最小盈利, 此时尾随终止出现 TrailingStopStep - 尾随步长 Lot - 负数 (例如, -3) 代表本金百分比, 正数 (例如, 0.1) 表示固定手数 LotMu
Key Breakout and Jump/Fall levels. No lagging. No repaint. Trend line is useful for detecting pattern, which is intended for the triangle pattern, Support & Resistance lines, and as a breakout up or down line. The trend lines are formed first before the price of the pair reach it. So it does not repaint. Each line has a description, such as Support, Resistance, Current-Support as key breakout down, and Current-Resistance as a key breakout up. Each broke out line turns into a new support or re
Gann and other analyst had found a curious correlations between moon phases and change in trends, this is an excellent indicator to test those relation and use what you find useful. It's very simplistic, can calculate the moon phases using the average moon cycle duration of 29 days 12 hours 44 minutes since the 1970 first full moon registered at January 22nd. You can also place a known full moon's date, to start the count since the daily opening of that date. In its window will plot a vertical l
自动交易复制器旨在以 100% 的准确度在多个 MT4/MT5 账户/终端之间复制交易。提供商和接收方账户必须位于同一台 PC/VPS 上。使用此工具,您可以将交易复制到同一台 PC/VPS 上的接收方账户。所有交易操作都将从提供商复制到接收方,不会有任何延迟。此版本仅适用于 MT4 账户。对于 MT5 账户,您必须使用 MT5 的自动交易复制器。参考: 参考: 对于 MT4 接收器,请下载“Trade Receiver Free” 这里 . 对于 MT5 接收器,请下载“Trade Receiver Free MT5” 这里 . 对于同一台 PC/VPS 上的 MT5 提供商,请检查“Auto Trade Copier MT5” 这里 . 如果您需要通过互联网在不同的 PC/VPS 上进行账户复制,请查看“Trade Copier Pro” 这里 . 如果您需要通过互联网在不同的 PC/VPS 账户之间进行复制,且接收方数量不限,请查看“无限交易复制器专业版” 这里 . 以下是重点功能 在 MT4 和 MT5 账户之间复制。 一个提供商可以将交易复制到多个接收者的账户。 一个提
愤怒的海狸 - 外汇交易 EA 只需在您的账户里启动愤怒的海狸,您将看到它会做什么。 精心设计的理念,简单设置 如果您打算在 EURUSD M1 时间帧使用 EA,您可以保留所有设置不变,或者您可能找到匹配您的经纪商与帐户类型的完美参数。 请注意: 交易系统的回测性能不代表未来结果!在策略测试,或演示账户或实盘账户中获得的任何以往结果,不能保证未来或应用于其它账户的盈利。 外汇交易拥有潜在的高回报,但也包括潜在的高风险。因此,你可能会发现外汇交易不适合你。在外汇市场上,高杠杆可以帮助您,同样也可以伤害您。 在您开始用愤怒的海狸 EA 工作之前,请慎重考虑您的投资目标,任务,交易经验,以及您的个人风险偏好。您也应该知道可能会部分亏损,在最坏情况下,您所有的初始投资。 我强烈建议仅投入不影响生活幸福的额外资金进行交易。 可用设置 Magic Number 用于区分交易属于该 EA 或其它的若您打算在单账户里使用几个海狸,请用这个工具。 Trade direction 允许您选择入场方向 (如果您喜欢只买和卖,以及用于非常精确的配置)。 Alter mode 启用回滚交易模式。 M
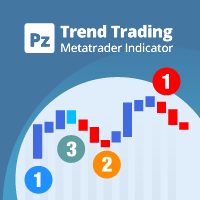
许多盈利交易者不仅知道如何识别市场趋势,而且也能把握趋势建立后的交易机会。 Pz 趋势交易 指标设计用来在趋势行情中尽可能的赚取利润。 已建立的趋势提供了一揽子交易机会,但大多数趋势交易指标完全忽视了它们,让交易者在趋势行情时完全不知道该如何做!一般趋势指标只通知有关的趋势变化,但根本不足以得到卓越的回报. Pz 趋势交易 指标比一般趋势指标显示多达 20 倍的交易 , 因为它注重所谓的市场时机。它不仅显示当前的市场趋势,也有回调,内柱线的突破和调整。它令您在趋势回调之后介入,安全的柱线内突破金字塔加仓,以及发现潜在的反转,和已知的调整。 趋势改变 一个趋势改变在市场方向变化时发生。趋势变化在图表上用带数字的彩色圆圈显示。蓝色 (1) 信号为上涨开始, 而红色 (1) 信号为下跌开始。趋势变化并非评估当前价格动作的结果, 它意味着交易设置是不定时地。如果您正确使用本指标, 在趋势变化时, 您将将已经入场 (参看下面的调整)。 回调 但凡趋势在运动中,行情上下抖动,盈利者收割利润,且其它参与者入场。趋势回调代表好的买入机会,通常是由主力获利离场导致。如果行情在回调后回归上行, 指标将
ADX-based indicator allowing you to easily evaluate the entry/exit signals (crosses D+ and D-), as well as trend/flat moments. Also, further information about the current spread and the time remaining at the current bar is included. The indicator is very useful and colorful.
可以说,这是您可以为MetaTrader平台找到的最完整的谐波价格形成自动识别指标。它检测19种不同的模式,像您一样认真对待斐波那契投影,显示潜在的反转区域(PRZ),并找到合适的止损和获利水平。 [ 安装指南 | 更新指南 | 故障排除 | 常见问题 | 所有产品 ] 它检测19种不同的谐波价格形态 它绘制了主要,衍生和互补的斐波那契投影(PRZ) 它评估过去的价格走势并显示每个过去的形态 该指标分析其自身的质量和性能 它显示合适的止损和获利水平 它使用突破来表明合适的交易 它在图表上绘制所有样式比率 它实现了电子邮件/声音/视觉警报 受斯科特·M·卡尼(Scott M. Carney)的书的启发,该指标旨在满足最纯粹和最熟练的交易者的需求。但是,它采取了一种使交易更容易的方式:在向交易发出信号之前,它会等待Donchian朝正确方向突破,从而使交易信号非常可靠。 斐波那契投影与向量无关 它实现了电子邮件/声音/推送警报 它绘制了ABCD投影 重要提示: 为了符合 Scott M. Carney先生 的商标申诉,某些图案名称已重命名为不言自明的替代方式, Scott M.
这是一个半剥头皮系统,它使用一个变换函数分析市场行情。该系统可以剥头皮,也可以根据 "止盈" 和 "止损" 参数。 这个 EA 用于交易 EURUSD, 不过它也可以用于其它的货币对。您可以用 M1 时间帧来交易。 您可以优化仅有的两个参数: Seconds_to_move 和 TradePrice。优化 Bobra Adept 一次就足够了, 例如, 以半年为周期。之后, Bobra Adept 在前行周期上展示了良好结果 (或在我的回测例子中), 这可以在截图中看到。 它没有对 GBPUSD 进行优化,因为即使不优化测试结果也很出色。 Bobra Adept 的参数 UseManualLot - 如果为 false, 自动选择交易手数。省缺为 False。 Lot - 手数, 省缺是 0.1。 Risk_for_AutomaticLot - 以余额为基础自动选择手数。省缺值是 120,这是高风险。 Safe_mode - 若为 true, 这个模式允许降低最大回撤。如此, 它可以在进行较高风险交易时,不必担忧您的资金。我建议一直使用它, 即设为 true。 Safe_coeffi
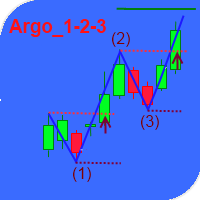
This indicator is intended for identifying the most frequently seen pattern on a price chart - the 1-2-3 pattern. This pattern is displayed in the chart only after it was fully formed, i.e. when the price has broken point #2. It features notifications using alerts or simply using a sound signal. When the price breaks the pivot formed by the indicator, you can hear the signal sound and see the relevant marking made. In addition to the pattern, the indicator displays the pivot and target levels of
The main goal of TradeHelper 360 is to substitute trader's actions when he cannot check charts by himself. While you're away, TradeHelper 360 watches your account status, trades breakouts automatically, uses revolutionary stops that follow trend lines, tracks risk reward ratio, protects your account, sets default stop losses and even moves stop orders to breakeven. Check all the amazing features and see TradeHelper 360 in action . Trade breakouts Trading breakouts was never so easy before. Just
This EA learns from its own mistakes. Each unsuccessful trade is thoroughly analyzed and turned into a future success. The Expert Advisor uses the time efficiently working 24/7. When the market is closed, the trading robot is especially productive, as it analyzes its own mistakes and makes a better trading plan for the coming week. This has been achieved thanks to its self-learning intelligent system. Full description: https://www.mql5.com/ru/blogs/post/688857 Free version: https://www.mql5.com/
该指标通过忽略突然的波动和市场噪音,以无与伦比的可靠性跟踪市场趋势。它被设计用于趋势交易日内图表和较小的时间范围。其获胜率约为85%。 [ 安装指南 | 更新指南 | 故障排除 | 常见问题 | 所有产品 ] 极易交易 查找超卖/超买情况 随时享受无噪音交易 避免在盘中图表中被鞭打 该指标分析其自身的质量和性能 它实现了一个多时间仪表板 该指标适用于低时限交易,因为它通过降低平均价格周围的市场噪音而忽略了突然的价格飙升或修正。 该指标根本不需要优化 它实现了一个多时间仪表板 它实现了电子邮件/声音/推送警报 指示器为不可重涂和不可重涂 该指标实现了适合于较小时间范围的趋势跟踪方向,该趋势可以渗透到较高时间范围内的非常长的趋势中,从而扩大了您的收益。 指标剖析 指标显示一条彩色的线,周围环绕着一个价格带。彩色线是有价证券的平均价格,而价格带表示超买/超卖水平。如果平均价格为蓝色,则您应该在市场没有超买的情况下寻找多头交易;如果平均价格为红色,则应该在市场没有超卖的情况下寻找空头交易。 指标的趋势变化并不表示立即进行交易或完成相反交易的信号!这些频段用于计时。 技术信息 指标的评估
该指标基于高级数学计算,估算最可能出现的短期价格走势。 功能特点 估算图表时间周期及所有更高时间周期上的即时价格走势; 计算真实的市场趋势; 计算最重要的支撑位和阻力位; 在出现密集区、价格穿越水平位和趋势变化时发出警报; 占用系统资源少:线条和面板只在数值变化时才更新; 自动适应:适用于任何交易品种和任何时间周期,无需调整参数; 可与同一图表上的其他指标、EA 和脚本一起运行。 简介 构成常见交易策略的大多数经典指标都基于简单的数学。这并不是因为在这些指标诞生时没有杰出的数学家,而是因为当时还没有计算机,或者计算机的处理能力太低,无法持续进行复杂的数学运算。如今,任何一部智能手机的性能都远远超过几十年前最强大的计算机。 Advanced Price Movement Predictor(APMP)指标利用当今的计算能力,通过高级的数学、统计和概率方法来捕捉价格波动的本质。 APMP 本身并不提供预测,因为价格走势是一个非平稳的随机过程,因此无法预测。但它会对即时价格走势做出动态估算。 基于同样的分析,APMP 会显示当前市场的真实趋势。迄今为止,趋势几乎总是通过移动平均线、布林带
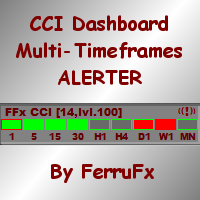
The FFx Dashboard MTF alerter will show you on a single chart all the timeframes (M1 to Monthly) with their own status for the indicator. 2 Alert Options: Single timeframe: each selected timeframe alert separately when a signal occurs Multi timeframes: all selected timeframes must agree for an alert to be triggered Both options have an input to select the timeframes to be used for the alert(s). How to understand the status: Green/Red square: CCI above/below levels (ie. 100/-100) Grey square: C
Currency Power Meter 显示了主要货币对彼此的力量。该指标显示货币/对当前时刻在一段时间内的相对强度(每天,每周,每月)。它是日间交易,波段交易和适期期权头寸交易者有用。 货币的权力是市场走势的真正原因:对最弱货币最强的货币将结合成一个最趋势对。我们知道,趋势使得货币和所有的交易者喜欢趋势。 你 有没有问过自己,为什么有些行业似乎有一个良好的信号,但仍然会失败?原因是你只看到个别的信号在您喜欢的一双,但没有对所有的人,这是更好地做出决定货 币权力的忽视。因此,这一指标显示哪些货币是最强的,哪些是最薄弱的,因此最趋势对。它也让你知道哪些货币(因而对)是中性的,你应该避免进行交易了。 突出特点: 实时和主要货币的视觉存在对他人的权力。 每日,每周,每月:分析周期之间切换。 提示信息时,货币或对改变它的电源。 通知发送到移动和电子邮件时货币或对改变它的电源。 选择字号以适应你的屏幕分辨率。 注: 指标可能需要一段时间来分析和安排货币细胞在第一次加载新的时间表,所以请等待,直到它完成。 用户指南: 指标得出的主要货币表中
Wind rose 4 is a multicurrency Expert Advisor. It trades the pairs consisting of the currencies selected in the input parameters. The trading robot has only one open position at a time. The Expert Advisor opens a position for the symbol that is the most volatile at the moment. The robot applies two strategies - trend and flat one, switching between them depending on the parameters received from all other currency pairs. Input Parameters EUR - use pairs with Euro; GBP - use pairs with British pou
网格交易是一种有效的机械交易策略,不依赖方向,从市场的内在波动性中盈利。网格交易的方法是指使用固定的价格级别,在单一或双向上入场和出场交易。这种交易,一般空间在 20-200 个点的间隔,创建一个交易网格。网格交易有若干优点。 易于设置和监督 无指标或无需复杂分析 需要对行情进行小预测 网格交易独立于时间帧 PZ 网格交易 EA 拥有一套独特的功能: 您决定交易的方向:做多,做空或两者 本 EA 同步管理买进和卖出网格 网格可选择在一定盈利水平重置。 网格可根据交易者的裁决完全关闭或暂停 本 EA 可在您期望的价位上停止买入或卖出 它不做开放式网格交易, 故风险有限 网格配置可以随时改变 不放置挂单: 只有市价单 每个货币对都提供了建议数据集 它适用于外汇, 大宗商品和期货 网格交易是给那些了解这一策略风险,并在相关账户净值的风控管理方面有经验的交易者准备的。 网格交易是强力工具, 但是... 它可能出现复杂和不合逻辑的初始 像许多强力工具,它也是很危险的 管理不善的网格可以引起很大的回撤 它比常规交易需要更多的耐心 它可能需要交易者作出模式转变 什么是网格交易? 网格交易在交易员
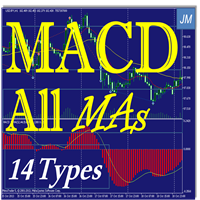
MACD All MAs-14 is a MACD indicator that allows choosing usual parameters of the standard MACD (constructed from EMA) as well as the type of the moving average to be applied: up to 14 different types. You can select 9 standard MAs available in MetaTrader 5 - SMA, EMA, SMMA, LWMA, DEMA, TEMA, Frama, VIDYA, AMA, TRIX, and 4 non-standard - LRMA, HMA, JMA, AFIRMA. General Parameters Method MA - select the type of moving average to be displayed in the current graph. Period slow MA - the number of ba
Efficient and non-repainting Pin Bars pattern detector indicator with the following abilities. I called it efficient as I personally tried each pin bar detector (available online) when developing an Expert Advisor for a client but no pin bar detector was able to give correct signal. Can detect pin bars in any currency pair and in all time frames. Ability to change color and size of detecting points (smiley faces). Ability to change the distance offset of the smiley faces from the candle (in pips
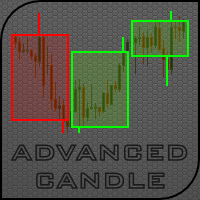
先进蜡烛指标设计用来在主图表上显示 四 种蜡烛类型 (包括非标准): HTF 蜡烛 可以显示任意时间帧的蜡烛, 包括非标准的。例如, М27 或 М135; 箱形蜡烛 (蜡烛有自己的最低高度, 设置为点数或百分比) 可以生成指定最低高度的蜡烛, 例如, 100 点或 0.5%; 交易量蜡烛 (蜡烛有自己的交易量, 设置为报价交易量或实际交易量) 可以生成指定最低交易量的蜡烛, 例如, 1000 次报价; 时段蜡烛 - 四个时段可以一起生成, 或是单独地。时段完全可以定制。 缓存区用于指标内部, 而图形对象仅用于当前不完整的蜡烛。 若干先进蜡烛可在同一图表上生成。 指标有以下参数: 蜡烛显示类型 - 选择显示的蜡烛类型。 High time frame Candles - 更高时间帧的蜡烛。 Box Candles - 指定高度的蜡烛; Volume Candles - 指定交易量的蜡烛; Trading session Candles 。 设置 HTF 蜡烛 - 高时间帧蜡烛设置: Period Candles 分钟 (最大7200), 乘以图表周期 - 蜡烛周期分钟 (最大值是 7
Description Expert Advisor Happy MartiGrid uses Martingale/Grid strategy with technical indicators, works best on GBPUSD H1 chart. This strategy requires the most attention. Therefore, we used 99.90% optimization in MetaTrader for the best stability and profits. Happy MartiGrid EA uses very sophisticated dynamic step and profit. Parameters FirstLot - size of the first open lot (default setting - 0.01). Multi - used to calculate lot size for the next position (default setting - 1.5). DynamicStep
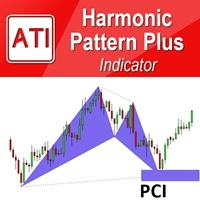
Introduction Harmonic Patterns are best used to predict potential turning point. Traditionally, Harmonic Pattern was identified manually connecting peaks and troughs points in the chart. Manual harmonic pattern detection is painfully tedious and not suitable for everyone. You are often exposed under subjective pattern identification with manual pattern detection. To avoid these limitations, Harmonic Pattern Plus was designed to automate your harmonic pattern detection process. The functionality
这是 MetaTrader 4 版本的 FxBrainBot EA。它是一款以数学为基础的 EA,使用周期和力度,并结合α、β、γ 和 δ 的权重入场交易。 由于它的能力几乎可适用于任何市场条件,本 EA 可以针对几乎所有货币对和时间帧进行优化。 为了降低您的风险, 您可以使用一个资金管理系统和简单的尾随终止。 详细手册 有关 FxBrainBot EA 的详尽手册 在此 提供。 作者 Yannick Deubel, 交易系统开发者, Tradarz.com 拥有者。
Minimum Requirements Deposit: $1 000 Spread: less than 10 pips Pair: AUDNZD (prefix/suffix allowed) Leverage: minimum 1:100 For Advanced Users $1 000 Deposit ECN Broker VPS For US Traders You can use this robot. For NFA regulated brokers, orders must close in FIFO order. You can enable FIFO from EA Input. If your broker does not require FIFO, simply set EnableFIFO to False. Why AUDNZD? AUDNZD is the most ranging pair . The reason is they are both secondary currencies with similar economies (com
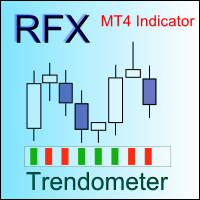
Identifying the trend of the market is an essential task of traders. Trendometer implements an advanced algorithm to visualize the trend of the market. The major focus of this indicator is to evaluate the market in the lower time frames (i.e., M1, M5 and M15) for the scalping purposes. If you are a scalper looking for a reliable indicator to improve your trade quality, Trendometer is for you. The indicator runs on a separate window showing a histogram of red and green bars. A two consecutive gre
Moving Average - multiple timeframes Indicator used - Moving Average Traditional multiple timeframe indicator always has an issue of REPAINTING when a trader wants to establish his/her strategy using Multi-Time-Frame (MTF). Generally, you should know how the MTF indicator re-paints. But I will explain with the following example: Suppose that you are using traditional MTF Moving Average (H4) in (H1) chart. At 15:20, the Moving Average (H4) dropped from 1.30590 to 1.30550 in EURUSD. Now what happ
The Four Moving Averages Message indicator ( please see the description and video ), a version of Four Moving Averages , concurrently displays four Moving Averages with default settings in the main chart window: Green and Red ones represent a short-term trend, Red and Blue ones - mid-term trend, while Blue and Yellow ones - long-term trend. You can change the moving average settings and colors. However, these parameters have been configured so that to allow trading on all time frames. The built-
The Expert Advisor BotMAn uses Moving Average data and an adaptation block. The entry/exit points are located at the points of intersection of the moving averages. The direction is determined by the adaptive system of the Expert Advisor using values of the moving averages. Input Parameters First MA Period - period of the first moving average indicator; First MA Method - averaging method of the first indicator; Second MA Period - period of the second moving average indicator; Second MA Method - a
The main purpose of the indicator is to detect and mark trade signals on the histogram of the Awesome Oscillator according to the strategies "Trading Chaos, second edition" and "New Trading Dimensions". The indicator detects and marks the following trade signals: "Two peaks" - Divergence. Divergence lines are drawn both on the histogram and directly on the chart. "Second Wise Man" signal - third consequent bar of the Awesome Oscillator histogram after the color change. The histogram crosses the
这是著名的时序指标 现在,您可以使用这个星球上最著名的时序指标。 百万富翁 Mostafa Belkhayate 在外汇市场使用这个特殊指标来验证他的另一个著名 重心 指标提供的入场信号,籍此赢得了他的声誉。我花了数小时,数天,数周来破解公式, 现在它终于能提供给您啦。 全新的、独特的,针对 MetaTrader5 时序可以完美地验证您的入场信号。这是此指标首次可用于 MetaTrader 5。我在反向工程之前已经进行了广泛搜索。从未有人发布用 MQL5 编制的时序。 此处是您在市场上唯一能找到它的地方。它既不会存在于互联网,也不存在于代码库... 不要犹豫来试用它 看看它的能量! 什么是时序? 时序指标给出了完美的入场时间。它必须结合其它 "主要" 指标一起使用。其目的是提高主要指标的效率。 若您使用自己的策略进行交易, 当您得到买或卖信号时, 快速查看一下时序指标并等待 "现在出击!" 黄色信号 来极大提升您的盈利率 。 如果时序没有出击信号, 那么就不是最佳入场时机。若无时序, 您的交易不会得到最佳利润。或者更糟的是,您可能会亏损。 直接结果 通过使用 3 色代码,您立刻就
iRobot 智能在 МetaТrader 4 终端上自动执行交易。本 EA 力争入场准确, 虽然每天进行的交易数量很低。这会导致小幅回撤, 允许交易者自行慎重决定增加交易手数。本 EA 的功能是在四个时间帧上执行技术分析。交易机器人的算法包含价格和风险分析模块,减少某些交易时刻的资金压力。本 EA 进行市价买卖交易。 信号算法基于略微修改的随机振荡振荡器,在四个选择的时间帧上同步并发执行技术分析 (从 M5 至 D1)。所有随机振荡器设置作为外部参数。您可以为每个时间帧设置不同的随机振荡器参数。 最大手数拦截可降低风险。您可以设置一个确定的最大手数。此处也有马丁格尔拦截 - 当马丁格尔订单的回撤超出一个确定的本金百分比它将自动减速。当回撤级别降低, 马丁格尔模块开始自动操作。 算法包括选择货币对的成本摊薄,并允许交易者在盈利时平仓。
轴点经常被专业交易员用来预测即将到来的市场走势。我们已开发出了一个易于使用的指标,来为您做这些。您可以将其放于任何图表,并定制轴点的计算周期。 支撑和阻力位帮助判断当前趋势的任意潜在的反转。好迹象是,只要价格高于轴点 (PP) 市场被视为利多,而价格低于轴点,它被视为利空市场。 它显示了轴点,起始点和三级支撑和阻力,并允许您定制使用不同的颜色。 也可以为指标添加一个 barshift,因此轴点计算可以向左边偏移。
多用途专家。 解决了选择目标的问题 - 价格变动的方向。 锁定和对冲是该顾问的主要原则。 根据谐波波动规律,价格以回滚(修正)的形式回到原来的位置。 EA 交易与多向订单同时平衡,在市场逆转时确定利润。 EA 在波动性增加的情况下有效(价格变动方向缺乏确定性)。 在多货币选项中,最好选择流动货币对。 初始存款的建議金額為 10,000 美元或同等金額的美分賬戶。 EA 可以交易单币种和多币种期权。 在多货币变体中,当相反的货币对匹配时开始对冲。 为此,您需要将 EA 附加到另一个货币对的新窗口,并更改 MagicNumber 数字,并相应地为该货币对输入其他输入参数。 EA 有一个显示当前输入参数的信息面板:账户余额、货币对的利润、账户类型(真实、模拟或竞争),以及手动关闭货币对盈利、不盈利或所有订单的能力。 工作描述 EA 以相同貨幣對的兩個買入和賣出訂單進入市場,自動為這兩個訂單設置固定止盈。當價格在買入或賣出時達到止盈水平時,它會固定利潤並在考慮分數馬丁格爾的情況下下額外訂單(手數增加 - Martinlot 係數)。 止損設置為鎖定(相反)訂單,以防市場反轉。此止損可以設置
The indicator works on any currency pair. The preferred timeframe is M15 or higher. When a signal is triggered, an appropriate arrow with a definite color, text and stop loss line are displayed on a chart: Blue color and up arrow - buy Red color and down arrow - sell The indicator is non-repainting. Below are my recommendations on working with it: Open a trade after a signal is triggered and a candle is closed. Stop loss is to be placed 5-10 points above the candle, at which the last signal is r