在Facebook查找我们! 加入我们的粉丝群
使用MetaTrader 5新的可能性
Informer for VPS - report on the state of your account via e-mail. Useful for controlling your Expert Advisors that run on a VPS or a dedicated computer. Information about open positions and last deals for a day, week, month or year grouped by currency pairs. Adjustable periodicity of reports and depth of deals included in the report. A possibility to add own comment to each report. You will receive reports on e-mail with specified periodicity: from 15 minutes to once a day. The reports are sen
FXG_Info – the most important data in one place. MetaTrader 5 Indicator FXG_Info provides basic statistical information about a particular currency pair. So that in combination with a chart representing currency price it is easy to determine whether the current situation is good for trading. And when you open a position it will clearly show you the current data such as SL, TP, RR. You are not limited to currency. You can use any market which is provided by you broker. The following information i
This multi-currency Expert Advisor works on 12 currency pairs (EURUSD, GBPUSD, USDCHF, USDJPY, USDCAD, AUDUSD, EURGBP, EURAUD, EURCHF, EURJPY, GBPCHF and GBPJPY) that can be selected in the parameters. Risk management can be set up manually. Optimization of all the parameters makes this EA powerful. It is based on filtered MACD to trigger the BUY or SELL signals. Open positions are closed by take profit, stop loss or according to opposite signals. You can perform optimization regularly for each
Jack Pot is an Expert Advisor based on trend and price action. Advance Money Management provides profits and protects balance from significant loss. Input parameters: Risk - Risk (in percents); Take Profit - Take Profit (in pips); Stop Loss - Stop Loss (in pips); Maximum Lots - Maximum Lots allowed; Control Balance Multiplier - Determine how aggressive lot will grow after loss; First Profit - First Partial Profit point (in pips); System has best results on H2 time frame on symbol EURUSD . Pres
A multi-currency Expert Advisor that works on 8 currency pairs (EURUSD, GBPUSD, USDCHF, USDJPY, AUDUSD, EURJPY, GBPCHF and GBPJPY) that can be selected in the parameters. Risk management can be set up manually. Optimization of the Risk Reward parameter makes this Expert Advisor powerful. It is based on filtered- MACD to trigger the BUY or SELL signals. Open positions are closed by Take Profit, Stop Loss or according to opposite signals. Input parameters: MM - money management usage (true or fals
The Reverse Bar indicator paints the reversal bars according to trade strategy, described by Bill Williams in "Trading Chaos. Maximize Profits with Proven Technical Techniques" book. The bearish reversal bar has red or pink color (red-stronger signal) The bullish reversal bar has blue or light blue color(blue - stronger signal) It is recommended to use it on hourly timeframe (H1) and higher.
This indicator shows Pin Bar candlestick pattern on the chart. The bearish pin bars have red color, the bullish pin bars have blue color. The indicator shows alert when Pin Bar candlestick pattern is formed. It's recommended to use it at timeframes H1 and higher. The best moment (strong signal) is when Pin Bar is formed close to the support/resistance level.
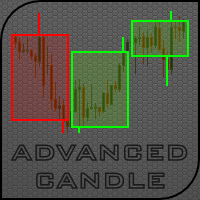
先进蜡烛指标设计用来在主图表上显示 四 种蜡烛类型 (包括非标准): HTF 蜡烛 可以显示任意时间帧的蜡烛, 包括非标准的。例如, М27 或 М135; 箱形蜡烛 (蜡烛有自己的最低高度, 设置为点数或百分比) 可以生成指定最低高度的蜡烛, 例如, 100 点或 0.5%; 交易量蜡烛 (蜡烛有自己的交易量, 设置为报价交易量或实际交易量) 可以生成指定最低交易量的蜡烛, 例如, 1000 次报价; 时段蜡烛 - 四个时段可以一起生成, 或是单独地。时段完全可以定制。 缓存区用于指标内部, 而图形对象仅用于当前不完整的蜡烛。 若干先进蜡烛可在同一图表上生成。 指标有以下参数: 蜡烛显示类型 - 选择显示的蜡烛类型。 High time frame Candles - 更高时间帧的蜡烛。 Box Candles - 指定高度的蜡烛; Volume Candles - 指定交易量的蜡烛; Trading session Candles 。 设置 HTF 蜡烛 - 高时间帧蜡烛设置: Period Candles 分钟 (最大7200), 乘以图表周期 - 蜡烛周期分钟 (最大值是 7
This indicator let user clearly see Buy/Sell signals. When a bar is closed and conditions meet, arrow signal will come up at Close Price, up is Buy and down is Sell. It works on all Timeframes. And you can set sound alert when signals come up.
Multi-currency Trailing Stop. Classic Trailing Stop. It only changes order Stop Loss when the current price reaches Trailing Stop Start pips of profit, securing/"locking" more profit as the price moves in favor of a trade. It allows flexible position filtering and processing by: Pair Magic Position Position Type The Expert Advisor can be placed on any chart. You can use Advanced Trailing Stop simultaneously with any other Expert Advisor. It also features: On Screen Display Extended logging Sep
MACD Histogram tracks the difference between the MACD line and the Signal line (which is the exponential moving average of the first line). For better visibility, when plotting the lines and the histogram in the same window, we scale up the histogram by a factor of 2. Furthermore, we use two separate plots for the histogram, which allows us to color-code the bars for upticks and downticks. The MACD Combo overlays MACD lines on MACD Histogram. Putting both plots in the same window enables you to
The MACD XOver indicator was developed by John Bruns to predict the price point at which MACD Histogram will reverse the direction of its slope. The indicator is plotted one day ahead into the future, allowing, if your strategy depends on MACD Histogram, to predict its reversal point for tomorrow (or the next bar in any timeframe). If the closing price tomorrow is above the value of this indicator, then MACD Histogram will tick up. If the closing price tomorrow is below the value of this indicat
更好神经网络 是下一代的 Kub EA, 赢得了 自动交易大赛 2007 。 它基于修改后的概率神经网络预测若干根柱线之后的价格动态。与标准概率网络相比,EA 通过初级输入的量化值来降低网络的维度。此外,它在神经元输出层的复发关系,能更好地确定时间形态。 此外,网络体系具有内置的手段来考虑报价在日内不同时间的动态 (或不同的交易时段)。因此,本 EA 主要是为日内交易设计的。 本 EA 包括两个相互关联的模块 - 神经网络和交易。在学习历史数据之后,神经网络开始传送预报到交易模块,同时在每根新的柱线上继续学习过程。交易模块基于这些预测制定开/平仓的决定。这是一个翻转系统,多头和空头交易互换,没有加仓和部分平仓。 EA 的参数可以分成两组: 神经网络模块参数 神经网络有两个输入端接收指定时间帧内的技术指标值。用户可以选择任何的 18 个内置指标,以及为它们逐一指定周期。 Indicators time frame - 指标计算时间帧 (从 M5 至 M30, 从下拉菜单里选择)。 Input indicator #1 , Input indicator #2 - 输入指标 (从下拉菜
Flash Neural Network EA is Expert Advisor based on Neural Network with back propagation learning algorithm. This software can be used on ANY market and on ANY time frame. Every parameter of network is fully configurable. Most complicated and time-consuming part of building successful neural decision model is proper input data preparation. Now everything is fully automated . You need to only pick input symbols, set neural network parameters as number of hidden layer neurons, maximal training ep
Features The Expert Advisor's conditions for entering and exiting the market are based on the MultiSignals_PCH indicator, which can be downloaded for free from Code Base . The Expert Advisor can be used for trading in the manual, semi-automatic or automatic mode. Multi-currency trading. This version supports 3 symbols. Multi-system trading. In this version, you can set up 4 strategies for each symbol. The Expert Advisor sets a unique magic number for each strategy. Multi-timeframe trading. You
MetaTrader 5 专业交易面板 —— 图表与键盘一键交易的高效控制中心 一款面向主动交易者的专业 Trading Panel,可让您比标准 MetaTrader 操作方式更快、更直观地完成开仓、平仓、修改、管理与控制。 这不是一个普通的小工具,而是一个为高频手动操作、仓位管理、挂单控制与利润管理而设计的完整交易工作台。 通过这套面板,您可以直接在图表上一键执行交易,通过键盘快速触发核心操作,并借助自动参数计算、图形提示、信息标签以及可视化管理功能,大幅减少重复性操作,让整个交易流程更加流畅、高效且专业。 使用我们的交易面板,您可以直接从图表上一键下单,执行交易操作的速度可比标准 MetaTrader 控件快约 30 倍。 全新高级版本现已推出: 使用 VirtualTradePad PRO SE 升级您的交易流程 — 适用于 MetaTrader 5 和 MetaTrader 4 的新一代专业交易面板。 MT4 版本 | 完整说明 + DEMO + PDF | 如何购买 | 如何安装 | 如何获取日志文件 | 如何测试与优化 | Expforex 的所有产品 为什么交易者会
The indicator shows the timetable of the world's stock exchanges in a separate window in visual mode. Based on Time, Forex sessions and Trade Hours monitor by Vadim Baklanov (2009), converted to MQL5 by ARIES Software Corp . Input parameters: Brokers standard time zone (UTC+): - Local Time, Standard UTC + offset broker server time; Broker DST start - Date and time daylight savings time server time broker; Broker DST end - Date and time of the transition to winter time; Clock color - Clock colo
EasyPen is designed as beautiful and innovative way to create and manage all your chart analysis, scribbles, notes and more. The app takes advantage of new MQL5 technology to offer an experience unseen in the other apps or in older MQL versions. An App That Changes Everything There is no existing drawing app that allows the level of customization that EasyPen offers. Change color of your pen, choose brush size, save drawings, keep drawings attached to specific position in chart, and more. With o
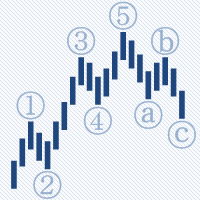
AutoElliottWaveMaker is the first tool for MetaTrader 5 , created for semi-automatic analysis of Elliott waves. It has many unique features: Automatic bar binding of waves for all timeframes; The waves can be labelled in 2 ways: drag and drop from the Labels panel and using the mouse click on the bar; Automatic arranging of the labels at all timeframes according to wave levels seniority; Automatic and manual control of the number of wave levels shown on a chart; Wave levels custom labelling sty
本 EA 是 MetaQuant-ATC10 的版本, 修改为用于一个货币对, 所有参数可调以及优化。 当然, 可以加挂到更多/若干货币对上,得到的结果就像 自动交易大赛 2010 。 此 EA 基于 "均匀网格"。如果持仓亏损, 按照不同步长加仓。这样做的目的是将持仓成本摊薄到市价附近,当调整时会转为利润并平仓。 输入参数的含义和操作方法: StartType - 在开始时识别首单的类型 (买或卖)。 Lot - 初始和后继交易量。 MaxLot - 最大可达的交易量 (所有订单总合)。 Trailing - 盈利尾随终止百分比 (0.7=70%)。 最小盈利等于所赢仓位交易量 = Lot 和价差 = Step 。 Step - 此参数有两个含义: 作为止盈 - 尾随终止的初始位; 作为开第二单的举例, 如果价格走向亏损方向 第二单之后的后续订单将使用变化的步长。如何根据 " Agres " 比例修改这个步长。 对于次要货币 JPY (USDJPY, EURJPY, ...) Step 参数值必须乘以 100。 Agres - 主动因子判断算法计算下一笔订单的步长。 合理的数值是从
ZoneSession allows you to visually show various trading zones on your chart. Excellent for live trading, but also at a glance you can review history for optimum trading sessions to analyse your trade setups. Zone Session shades the chart into sessions of your choice in any combination of colors.
This script help user to record the values of Bollinger Bands indicator and OHLC at the moment once deals happen. The data saved as .CSV file so you can quantitative analysis someone's trading. Please input value of Bollinger Bands parameters you like. It tells you the path of data file when script is stopped.
Spiral 12 is not the result of excessive optimization or curve fitting, but rather analysing the medium-term characteristics of the Euro-Sterling and redesigning a stable system based on these observations. Spiral12 trades the EURGBP M30, places less trades than the Spiral11 M15 ( ATC 2011 ) but selects more refined, profitable entries and exits. Expert Advisor uses Moving Average , Envelopes and grid applied at specific times during the close of the US session. Full input control over all ind
MACD 技术在日常交易中经常使用。对于寻找当前行情趋势,和行情发散/收敛它很有用。 这个版本的 MACD,可以更快、更好地帮助现实世界里的人们做出交易决策。它基于省缺的 MACD, 加上行情力量的强度功能 (绿色柱线代表作多强度, 红色代表做空强度), 且箭头指示开/平仓的方向。通过比较强度柱线, 您可以更容易地预测趋势。 总而言之,利用这个指标,人们可以更快地做出决策,并最终领先行情。
The Red Green Trade Signals indicator just gives you the direct signal to open and close your positions, just like traffic signals. When the signal turns to red, the market goes to short position, while the signal turns to green, the market goes to long position. This indicator also provides the precise time and price to open/close your positions with the 'buy' (green) and 'sell' (red) arrows. It's easy to use, and it's ready to go without any parameter to set. This indicator is implemented by c
This Expert Advisor won 1st place in the Automated Trading Championship 2010. The trade system is based on analysis of Moving Average indicator. The EA can work at any symbol and timeframe, but better results can be achieved on EURUSD, GBPUSD and M5/M15 timeframes. It uses pending orders when trading, so the entry price has no slippage. Buy order is placed: At strong upper price movement the EA places pending order at price of the moving average - shift. When price is changed, it modifies the pe
This utility is used to visually choose an indicator for trailing stop and select its parameters. The Expert Advisor modifies the Stop Loss order position opened for the instrument of the current chart based on indicator values. Uses indicators Parabolic SAR , NRTR (Nick Rypock Trailing Reverse) , Moving Average or linear regression channel. The indicators are added to or removed from the chart using the 'show' checkbox. The following options are available: Parabolic - trailing stop based on th
这款剥头皮指标为您显示可以安全赚取 10 个点,且风险仅有 2 个点的那一刻。如果使用正确的资金管理,它可以极大地增加您的资产。 此指标只有一个输入参数 - 柱线数量, 用于趋势计算。 当信号出现, 在高于当前价位 2 点的上方放置挂单 (买单) 或低当前价位 2 点的下方放置卖单。 止损 - 2-3 点; 止盈 - 从 10 点起; 建议时间帧 - M1。 品种高波动且低点差 - EURUSD, AUDUSD, GBPUSD, EURJPY 等等。 如果仓位已开, 但价格未到达止盈价, 修改止损到盈亏平衡点, 并依据前一根柱线的最低价设置多单尾随停止, 或前一根柱线的最高位设置空单尾随停止。 FYI :如果您購買此指示器而不是租用它,您可以通過向我們發送您的付款證明來免費索取其源代碼。
交易员动态指数(TDI) - 概述 交易员动态指数(TDI)是基于RSI振荡器的多功能指标。 它帮助交易者识别市场状况和潜在的反转信号。 TDI 将多个指标结合为一个,提供市场动态的全面视图。 组成部分: 绿色线:RSI 价格线 红色线:交易信号线 蓝色填充:波动带 黄色线:市场基准线 视觉信号: 趋势方向: 短期趋势: 绿线在红线上方:价格上涨。 红线在绿线上方:价格下跌。 总体趋势: 黄色线在32和68之间波动。关注该线的反弹情况,以识别市场反转。 当价格在黄色线上方时做多,在黄色线下方时做空。 市场强度和波动性: 短期分析: 绿线陡峭上升:市场强势。 绿线水平或平缓:市场疲弱,横盘整理。 总体分析: 蓝色填充区域扩大:市场趋势强劲。 蓝色填充区域收缩:市场疲软,波动较小。 蓝色线极度收缩:市场可能因经济公告或其他条件出现剧烈波动。 在EA(智能交易系统)中使用TDI: 要在EA中使用TDI指标,可以使用 iCustom 函数调用它,并获取其缓冲值以生成交易信号。 以下是一个简要示例: // 创建指标句柄 int handle_tdi = iCustom ( Symbol ()
DCMV Trade Channel Oscillator The indicator calculates the values of DCMV trade channel oscillator: Trade channel width. The value of trade channel depends on the trend (it increases at start of the trend and has the maximum values at end of the trend). The value of trade channel decreases at flat movement. The lowest values of channel width indicates the high probability of the very strong price movement. The +DC line shows the "bulls" power. The -DC line shows the "bears" power. The value of
This indicator is used to distinguish between different trading hours. By Asia, Europe and the Americas volatility, it has drawn with different colors.
The purpose of Impulse Release is to prevent trading in the wrong direction. While the Impulse System operates in a single timeframe, Impulse Release is based on two timeframes. It tracks both the longer and the shorter timeframes to find when the Impulse points in the same direction on both. Its color bar flashes several signals: If one timeframe is in a buy mode and the other in a sell mode, the signal is "No Trade Allowed", a black bar. If both are neutral, then any trades are allowed, showi
有些交易者不喜欢让他们头寸中的止盈/止损价格暴露出来,这个EA可以帮助他们。 把EA拖放在图表上,并设定止盈/止损点(0意味着忽略),如果图表上的商品有头寸,它会在图表上监察商品的价格,如果价格达到用户设定的止盈/止损水平,就关闭这个头寸。 这个工具可以有效隐藏用户的止盈/止损价格。止盈/止损价格由开仓价格与用户设定的止盈/止损点子所决定。 欢迎提出宝贵建议和意见。 。。。。。。。。。。。。。。。。。。。。。。。。。。。。。。。。。。。。。。。。。。。。。。。。。。。。。。。。。。。。。。。。。。。。。。。。。。。 ........................................................................................
The AdvancedTrend indicator automatically traces market price movement and draws a pair of resistance and support lines. It's easy to figure out market trend with resistance level and support level and when/how market breaks out key price level.
One of the key rules in trading is never move your stops in such a way that your risk increases. Our stop sequence shows the automatic tightening of stops. They appear as a series of decreasing risk points until the trade is eventually stopped out. The problem is that if you enter a trade at any other point than the initial dot of the sequence, you may be placing the stop too close. Stop-entry plots show you the initial value for the stop for each bar. You can use them when you put on a trade,
包络线或通道线设置为平行于移动平均线(如果您使用两个均线,则为慢速均线)。两条通道线必须包含日线图上过去两三个月所有价格的大约 95%,只有极值突出在外面。通道线提供了有吸引力的利润目标——在上线附近卖出多头,在下线附近做空。 AutoEnvelope 是一个自定义指标 - 一个原始工具,通过计算最后 100 根柱线的标准偏差来自动选择通道宽度。它被设计为使用固定通道大小或最多每周更改一次值(在每周图表上每月一次),使其甚至适用于日内数据(使用“固定通道大小”参数从一种模式到另一种模式)。 除了 AutoEnvelope 之外,还绘制了 EMA。这种组合允许您更改 EMA 并使包络跟随它,而无需调整两个单独的指标。如果您不想看到移动平均线,请进入 AutoEnvelope 属性并将平均线(第二行)的颜色更改为“无”。 参数: EMA_长度 (22) – 这是绘制在通道中心的指数移动平均线的条数。 因素 (27) – 这是用于创建通道的标准偏差数(以十分之一表示)。 从统计上讲,2.7 是适合使用的大小,但它假定标准分布,这并不总是存在于市场中。 我们发现 27 适用于大多数使用
Indicator to measure market activity and to show speed of price in pips/sec. Have you been wondering, what is current speed of the market? I see the ticks jumping up and down, can I measure their speed? All these questions can be answered by Tick Speed v1.0 - good looking indicator with good configuration possibilities. It will show you directional movement speed in ticks per second or in time defined by you! Good for scalpers, good for long term-traders. Good for beginners, good for pros. Th
FXJet 是款 EA,利用价格行为,来确定趋势。高级资金管理提供利润并在明显的亏损中保护余额。 输入参数: Risk - 风险 (百分比); Take Profit - 止盈 (点数); Stop Loss - 止损 (点数); Maximum Lots - 最大允许手数; Control Balance Multiplier - 亏损后确定如何激进地增加手数 First Profit - 第一部分的利润点 (点数); Second Profit Parameter - 第二盈利参数; Move Stops to BE after First Profit - 在第一盈利点到达后,移动止损至开单价; Partial Closing Lots - 持仓量百分比用于部分平仓。 系统的最佳效果是在 H1 时间帧的 EURUSD 品种。 展现的历史结果有两种选项: 没有资金管理 (固定最大手数 = 1) 和带有资金管理 (最大手数依据可用保证金计算)。<brxian4/>初始本金均为 10000 美元。输入参数设为省缺。 测试周期 自 2010-01-01 至 2012-02-01。 结
This script allows users to obtain MACD and OHLC values for each bar on the current chart. The information is saved as a CSV file allowing you to perform quantitative analysis using MACD. Please specify MACD parameters you like. After exporting the report, the script tells you the path where the file is saved.
GoodTrade is the very first Expert Advisor purchased on the Market. On the occasion of the second anniversary of availability of the Expert Advisor on the Market, you are now looking at the second version of the Expert Advisor featuring a completely updated operating logic. GoodTrade now uses a new universal trading signal suitable for various trading instruments and working over long time periods. By default, the Expert Advisor is set to trade GBPUSD. Try it for other trading instruments. Set a
The Market Thermometer is described in "Come into my Trading Room" book. It measures the degree of volatility, as reflected in greater or smaller intraday ranges. When the Market Temperature spikes above its average or stays below its average for a number of days, it gives trading signals, as described in the book. Parameters: Thermometer_EMA_Length (22) – The length of the moving average of the Market Temperature. The default 22, the average number of trading days in a month. Spike_Alert_Facto
If you want something as below: Sell FOREX trading signal. Manage multiple accounts. Follow somebody's trading. "TradeCopier_source" and "TradeCopier_follow" can help you! Features: Copying from one source (master) account to multiple follower (slave) accounts. Allow investor (read only) password for the source (master) account. There are no complicated settings and input parameters, everything is easy. Works with different Brokers. Works with different symbols (EURUSD_FX, eurusd_m, etc.). Can c
有的交易策略适合波动较小的、安静的行情,而有的策略适合波动较大、剧烈的行情。不管是哪种策略,交易者都应当对行情的冷热程度有清晰的量化标准。 本产品方便交易者对比不同交易品种的冷热程度,或者同一交易品种在不同时间段的交易热度。 你可以将它放在不同图表上,获得直观的感受。哪个品种热度更高,哪个交易更淡静,一目了然。 下方的颜色指示器显示瞬时的价格跳动情况,而左上角的数字显示的是一段时间内的温度累积均值。 。。。。。。。。。。。。。。。。。。。。。。。。。。。。。。。。。。。。。。。。。。。。。。。。。。。 .......................................................................................................
The script creates account summary report in a separate window. The report can be created for all deals and on deals for selected financial instruments. It is possible to specify a time interval of calculation and save report to htm-file. The script creates account summary report in a separate window. The report can be created for all deals and for deals of the selected financial instruments. It is possible to specify a time interval of calculation and save report to htm-file. Input parameters
This script notifies a user about different events by playing sounds, sending emails and text messages to a mobile device. The following events are supported: New deals (in/in out/out). Expiration of Pending orders. The terminal disconnected. The terminal or the script closed. Please set a notification type for each event separately. If you need notifications via Email, please make sure that the settings on the Email tab are correct. If you need to receive notifications on a mobile device, pleas
The script allows to easily watch the date and time of several cities selected by the user from more than 30 important cities all over the world. It also shows GMT, Server time and Local time. The cities on the screen are automatically sorted by the date and time. You can save your setting on the Inputs tab and use them in future. Notice: Daylight saving time is not considered.
Info tool helps to estimate the current risks of open positions and orders. It allows to analyze open positions or/and pending orders, also there are USD/Percentage modes. Expands the margin load and the share of profit participation for individual positions. Информационная панель помогает оценить текущие риски по открытым позициям и ордерам. Есть возможность отдельного анализа рисков по позициям/отложенным ордерам, а также в режимах USD/Percentage. Раскладывает маржинальную нагрузку и долю учас
The script shows statistics of trades for the specified period. For example, if you want to know the details of trades of the ATC2010 Winner ( bobsley ): Login with his account using the investor (read-only) password (MetaTrader5); Open the chart of his trading symbol (EURUSD); Run this script on the chart; Specify 2010.10.1 in "date from", and the diagram will be shown.
该系统的思路是通过计算复合蜡烛来识别反转形态。 反转形态类似日本蜡烛条分析的 "锤头" 和 "吊颈" 形态。但它使用符合蜡烛替代单一的蜡烛,并且不需要复合蜡烛的小实体来确认反转。 输入参数: Range - 最大柱线数量, 计算复合蜡烛时用。 Minimum - 最小复合蜡烛大小 (传统的点数)。 ShadowBig and ShadowSmall - 影线 (复合蜡烛单元)。 Limit, StopLoss and TakeProfit - 开盘价, 止损位和止盈位, 它们是相对于复合蜡烛的收盘价 (复合蜡烛单元)。 Expiration - 订单过期时间 (单位柱线), 用于挂单 (Limit!=0.0)。 反向蜡烛条形态的判别如下。 它计算复合蜡烛参数,其自最后的完整柱线 (索引为 1) 至由 Range 输入参数定义的柱线数量。如果复合蜡烛大小大于由 Minimum 输入参数指定的数值, 它分析复合蜡烛的影线检测反转条件。 空头能量的特征是复合蜡烛的上影线为零, 多头能量的特征是复合蜡烛的下影线为零。 为确认空头趋势反转 (且多头开始),需要以下检查: 下影线的大小 (多头能量
交易策略基于三条移动均线。判断趋势, 使用三条指数平滑移动均线: FastEMA, MediumEMA 和 SlowEMA。 交易信号: 买信号: FastEMA>MediumEMA>SlowEMA (向上趋势)。 卖信号: FastEMA<MediumEMA<SlowEMA (向下趋势)。 输入参数: Inp_Signal_ThreeEMA_FastPeriod = 8; Inp_Signal_ThreeEMA_MediumPeriod = 38; Inp_Signal_ThreeEMA_SlowPeriod = 48; Inp_Signal_ThreeEMA_StopLoss = 400; Inp_Signal_ThreeEMA_TakeProfit = 900; Inp_Money_FixLot_Percent = 10.0; Inp_Money_FixLot_Lots = 0.1;
策略基于价格与均线指标交叉, 并以 ADX 指标确认。 交易信号: 买: 最后完成的柱线收盘价高于均线, 当前以及最后完成的柱线所对应的均线在增长。 卖: 最后完成的柱线收盘价低于均线, 当前以及最后完成的柱线所对应的均线在降低。 出于过滤假信号,使用移动方向指数 (DI+ 和 DI-) 来检查趋势能量 (ADX>ADXmin) 和趋势方向。 输入参数: Inp_Signal_ADX_MA_PeriodADX = 48; Inp_Signal_ADX_MA_MinimumADX = 13.0; Inp_Signal_ADX_MA_PeriodMA = 50; Inp_Signal_ADX_MA_StopLoss = 400; Inp_Signal_ADX_MA_TakeProfit = 900; Inp_Money_FixLot_Percent = 10.0; Inp_Money_FixLot_Lots = 0.1.
基于鳄鱼技术指标的策略, 由 Bill Williams 在 "Trading Chaos - 混沌交易" 中描述。 系统基于三条移动均线 (唇线, 牙线和下颌线), 以及振荡器, 计算它们之间的差别。交易信号在鳄鱼线交叉之后生成,依据趋势,通过这些线确定交易。在上涨趋势中,唇线 (最小周期) 最高, 之后是牙线, 最低是下颌线。与此类似,但在下跌趋势中,情况相反。 交易信号: 开多头仓位: 上升趋势中,鳄鱼线交叉,且线间距离在拉开; 平多头仓位: 下颌线上穿唇线; 开空头仓位: 下跌趋势中,鳄鱼线交叉,且线间距离在拉开; 平空头仓位: 下颌线下穿唇线; 输入参数: Inp_Signal_Alligator_JawPeriod = 33; Inp_Signal_Alligator_JawShift = 8; Inp_Signal_Alligator_TeethPeriod = 28; Inp_Signal_Alligator_TeethShift = 5; Inp_Signal_Alligator_LipsPeriod = 15; Inp_Signal_Alligator_Lips
Chaikin 的波动指标计算最大和最小价格之间的价差。它基于最大和最小之间的幅度来判断波动性。不像 平均真实范围 , Chaikin 的指标没有将跳空考虑在内。 根据 Chaikin 的解释, 在相对较短的时间里交易量增长, 意味着价格即将抵达最低点 (就像证券的恐慌性抛盘), 而在较长的时间周期里波动降低, 意味着价格处于峰值 (比如, 在成熟的牛市条件下)。