在Facebook查找我们! 加入我们的粉丝群
使用MetaTrader 5新的可能性
Energy Trade shows the currency strength, analyzes ticks that allows you to enter the market at the very beginning of the trend. Energy Trade is a good complement to any trading system. Values of Energy Trade range from 0 to 10: the higher the value, the stronger the currency; the smaller the value, the weaker the currency; average values of the indicator suggest that the currency is in flat. How to use - buy strong currencies and weak ones. The indicator has two scales: the first scale analyzes
本 EA 针对小资金或是大资金均可工作。只是依据您的起始手数。 本 EA 使用 蓝蝴蝶 指标。 它可与 AUDUSD, NZDUSD 在 M15 时间帧工作。 实盘账户监控: https://www.mql5.com/zh/signals/33021 , https://www.mql5.com/zh/signals/50542 常用推荐 使用 StartLots=0.01 每 500-1 000 货币单位 使用不同的魔幻数字来同步交易几个货币对 输入参数 本 EA 在四位或五位平台上均可工作。按照 5 位数字指定输入参数的点数值,EA 将自动换算 4 位数字。 StartLots - 初始手数; StopLoss - 入金百分比作为止损; GridStep - 订单间隔点数; Martin - 加仓手数的倍数; LockOrderNo - 首单锁定单号; Klock - 来自可用序列的锁定比率 (单位分数); TakeProfit - 止盈; TrailStart - 激活移动止损的盈利点数; TrailDistance - 移动止损距离; TrailStep - 移动止损步长;
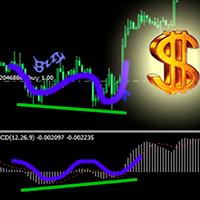
本指标为任意选定的指标建立发散/收敛。 您可以用它的自定义设置自由添加自己的指标代码。 本指标有两条基本线绘制方法 (**): 从前一根柱线开始搜索封顶 (MODE = 0) 从指标与 "零轴线" 交叉以后开始搜索 (即, "零轴线" 为 RSI = 50.0) (MODE = 1) 基本设置包括 17 个包括在 MT4 终端里的标准指标,您可以自由添加您的任何指标。 当信号出现时,指标有内置的警示。 标准指标包括在设置里 (指标代码 (*)): AC (加速振荡器) (MODE = 0 / 1) AD (累积/派发) (MODE = 0) ADX (平均动向指数) by MAIN LINE (MODE = 0) ATR (平均真实范围) (MODE = 0) AO (动量振荡器) (MODE = 0 / 1) 空头力度 // (MODE = 0 / 1) 多头力度 // (MODE = 0 / 1) CCI (商品通道指数) (MODE = 0 / 1) DeMarker (MODE = 0 / 1) 强推指数 (MODE = 0 / 1) 动量 (MODE = 0) OsMA (移
剥头皮策略指标,仅针对 M1 时间帧,适用于任何货币对。 每当您有时间在您的 PC 或笔记本前坐下来,在此指标的帮助下,您可以在 15-30 分钟内获利。 红线意为下跌趋势, 您要做空。 蓝线意为上涨趋势, 您要做多。 注意!在您开始交易过程之前, 很重要的事情是等待信号。
复制交易者是用于 MetaTrader 4 终端的快速,简便,可靠的复制机。程序很容易使用。安装两个终端: 在其中一个终端上选择 "服务器" 模式, 即此终端是仓位源。 在另外一个终端上选择 "客户" 模式, 即此终端是仓位复制的目的地。 输入参数描述 Mode - 选择模式: Server 或 Сlient; 以下设置仅用于 Сlient 模式, 即它们用在目的地终端上。 Server account number - 运行 Server 模式的 EA 帐号。 Max. Slippage - 最大允许的滑点。 Lot Multiplier - 开仓的手数系数, 若为 1,则开仓手数与服务器端相同。 Prefix to be deleted - 如果服务器端有前缀,而客户端没有前缀,则删除前缀。 Suffix to be deleted - 如果服务器端有后缀 (如 ".m"),而客户端没有后缀,则删除后缀。 Prefix to be added - 如果服务器端有前缀,而客户端没有前缀,则添加前缀。 Suffix to be added - 如果必要,添加后缀。 及时的产品技术支持
超级仓鼠 EA 是一宽专为 NZDUSD 设计的 EA。它即使用最少本金也可工作。 此 EA 基于 RSI + 它有两个附加过滤器, 使用马丁格尔功能将亏损交易扭亏为盈,并可以根据本金的百分比设置止损功能。 购买 EA 之后, 您将免费收到更新和优化! 我将帮助您选择正确的参数以便实现任何目标 (增加本金, 用于 PAMM 账户的低风险, 稳定的信号分布)! 实盘监控账户信号在此: https://www.mql5.com/zh/signals/33021 输入参数描述 本 EA 在四位或五位平台上均可工作。按照 5 位数字指定输入参数的点数值,EA 将自动换算 4 位数字。 StartLots - 初始手数; Depo - 随着余额增长,手数自动增加指定数值。0 值禁用该功能; RsiPeriod - RSI 周期; RsiPrice - RSI 计算的价格; Rsi1 - 优化参数 (多头仓位); Rsi2 - 优化参数 (空头仓位); GridStep - 订单间隔点数; Martin - 随后的订单手数系数; LockOrderNo - 根据锁定的持仓开单; Klock -
最好的实时外汇分析,以及为专业交易员和 EA 开发者使用的强大附加功能。 这清楚地布局瞬间为您展示全球外汇市场上进行交易的最佳货币组合。 每个主要货币对的强弱度在每次即时报价到达时计算,结果按照财经区域排序以便研究它们的关联性。 重要提示: 您必须在市场观察里显示所有外汇符号,才能得到 100% 的正确计算结果! 请下载 分析者专业版用户手册 得到详尽信息。 最佳实践: 强势区: 大于 5.5。 中性区: 在 3.5 和 5.5 之间。 弱势区: 小于 3。 简单策略: 买强卖弱 (例如, NZD: 5.9 和 CAD: 2.6 -> 做多 NZDCAD)。 额外功能: 在您希望的时候自动创建您自己的历史计算文件来验证您的交易和设置。 在您的全自动交易系统里,通过 iCustom 选择启用的缓冲区,并使用计算值来入场和出场。 此产品是我们的 蓝球交易系统 的一部分。
Description Expert Advisor Happy MartiGrid uses Martingale/Grid strategy with technical indicators, works best on GBPUSD H1 chart. This strategy requires the most attention. Therefore, we used 99.90% optimization in MetaTrader for the best stability and profits. Happy MartiGrid EA uses very sophisticated dynamic step and profit. Parameters FirstLot - size of the first open lot (default setting - 0.01). Multi - used to calculate lot size for the next position (default setting - 1.5). DynamicStep
Blue Butterfly is an implementation of Gartley Butterfly pattern. This indicator predicts price reversals well enough allowing traders to catch large movements (up to 1 000 pips) with small risks. Indicators for efficient traders cost about $300 and higher, while Blue Butterfly can be purchased at a more attractive price. The red butterfly indicates entering sells given that the price is closed below the rectangle (the so-called "reversal zone"). The blue butterfly indicates entering buys given
The indicator presents a new way of early trend detection using the popular ADX indicator methods. The new system adapts to the market and eliminates additional conditions. To generate a signal when using the standard ADX indicator, the ADX line should cross some level - 20, 22, 26, etc. However, it is very difficult to select such a level not only for different symbols but also for different timeframes on the same chart which makes ADX practically useless. The solution has turned out to be simp
指标-预测员。作为助理十分有用, 作为一个关键点来预测未来价格走势。 采用搜索历史中最相似的部分 (形态) 做出预测。 指标以绘制线条形式显示柱线收盘价的变化结果。历史深度, 预测柱线的数量, 形态大小和搜索品质可通过指标设置调整。 设置: PATTERN_Accuracy_ - 搜索品质。 PATTERN_Size_ - 形态大小 (柱线)。 PROGNOSIS_Bars_ - 预测柱线数量。 SEARCH_Deep_ - 搜索历史的深度 (柱线)。若设为零, 则搜索整个可用历史。 PROGNOSIS_Start_Bar_Shift_ - 开始预测的柱线数量。数量是在旧的柱线方向。0 是最新的柱线。
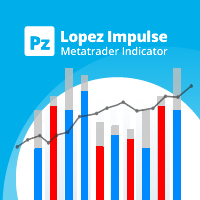
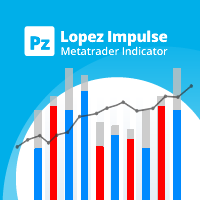
该指标同时评估波动率和价格方向性,从而发现以下事件。 [ 安装指南 | 更新指南 | 故障排除 | 常见问题 | 所有产品 ] 决定性和突然的价格变动 大锤子/流星图案 大多数市场参与者都支持强劲的突破 犹豫不决但动荡的市场形势 这是一个非常易于使用的指标... 蓝色直方图代表看涨的冲动 红色直方图代表看跌冲动 灰色直方图表示当前的波动率 移动平均线是平均波动率 该指标实施各种警报 指示器不重涂或重涂 ...具有直接的交易含义。 当看涨冲动超过平均波动率时,您可以购买 当看跌冲动超过平均波动率时,您可以卖出 该指标跟踪市场波动以及每个单个柱的看涨和看跌冲动。如果看涨的冲动超过平均波动率,那可能是做多空头的好机会。这些强劲的价格走势是可靠的,因为其他市场参与者可能会补仓。如果使用得当,此指示器功能非常强大。 作者 ArturoLópezPérez,私人投资者和投机者,软件工程师和Point Zero Trading Solutions的创始人。
当进行外汇交易时, 我们同时交易一对货币。例如 EUR/USD。如果我们做多 EUR/USD 它意味着我们期望 EUR 相对于 USD 获得强势。如果我们做空 EUR/USD 它意味着我们期望 EUR 相对于 USD 获得弱势。您应该都很熟悉这个概念。 有关货币对的关键点是,它们只是表明一种货币 相对于 另一种的强度。如果我们看到 EUR/USD 上涨,是不是因为 EUR 正在加强,或 USD 正被削弱?不太可能只通过孤立地观察 EUR/USD 就这样讲。 本指标使用的公式,计算以下 8 种货币的 '货币强度': USD, EUR,GBP, CHF, JPY,CAD, AUD 和 NZD。
你想成为一个持续盈利的五星级外汇交易商吗? 1. 阅读我们简单的 交易系统 的基本描述 以及 它在2020年的主要策略更新 2. 发送你的购买截图,以获得我们独家交易聊天的个人邀请 Lighthouse 是一个惊人的精确和可靠的支撑和阻力指标。 它显示最重要的交易水平,并根据其相关性绘制。 如果一个水平被明显打破,它将改变其作用和颜色。支撑位变成阻力位,反之亦然。 主要特点 自动调整到基础时间框架 只显示重要的支撑和阻力水平 如果一个水平被明显突破,立即作出图形反应 较厚的SR水平比较薄的水平更重要 一般设置 分析模式: 在三种不同的扫描模式(日内、中度和高度时间框架)中选择,或使用默认设置的自动调整。 自动模式根据基础图表时间框架调整使用的分析模式。 敏感模式。敏感模式可以识别更多的支持和阻力水平。如果您是一个日内交易员,我们建议使用它。将此设置为 false ,如果您想减少绘制的SR水平的数量。 SR距离(点)。这个可改变的数值是内置支撑和阻力位距离检查的基础。它测量当前价格与下一个Lighthouse水平之间的距离。如果当前价格与下一级别的距离超过5个点,你将看到 "等待
Monitoring and Trend Analysis This product shows the trend strength levels based on 16 standard indicators, time periods and currency groups. Depending on the current trend, the indicator colors change from green to red, allowing you to see the full picture. Advantages Whatever your trading method and strategy are, you should always know, in which direction you are trading and what the probability of the trend change is. This indicator will help you answer these questions by calculating the upc
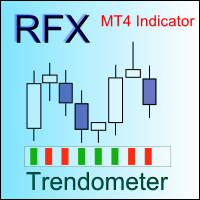
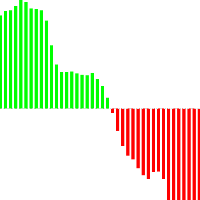
Identifying the trend of the market is an essential task of traders. Trendometer implements an advanced algorithm to visualize the trend of the market. The major focus of this indicator is to evaluate the market in the lower time frames (i.e., M1, M5 and M15) for the scalping purposes. If you are a scalper looking for a reliable indicator to improve your trade quality, Trendometer is for you. The indicator runs on a separate window showing a histogram of red and green bars. A two consecutive gre
There is a newer version available: Please follow this link to the new product version Powerplay is an easy-to-use trading system for beginners, advanced and professional traders. The multi timeframe display is the perfect complement to unleash the full potential of Powerplay. You'll see at a glance and for all timeframes at which direction the trend is running. Catch the trends at an early stage and ride the wave till it breaks. Improve your trading results with a great support and resistance i
该指标基于高级数学计算,估算最可能出现的短期价格走势。 功能特点 估算图表时间周期及所有更高时间周期上的即时价格走势; 计算真实的市场趋势; 计算最重要的支撑位和阻力位; 在出现密集区、价格穿越水平位和趋势变化时发出警报; 占用系统资源少:线条和面板只在数值变化时才更新; 自动适应:适用于任何交易品种和任何时间周期,无需调整参数; 可与同一图表上的其他指标、EA 和脚本一起运行。 简介 构成常见交易策略的大多数经典指标都基于简单的数学。这并不是因为在这些指标诞生时没有杰出的数学家,而是因为当时还没有计算机,或者计算机的处理能力太低,无法持续进行复杂的数学运算。如今,任何一部智能手机的性能都远远超过几十年前最强大的计算机。 Advanced Price Movement Predictor(APMP)指标利用当今的计算能力,通过高级的数学、统计和概率方法来捕捉价格波动的本质。 APMP 本身并不提供预测,因为价格走势是一个非平稳的随机过程,因此无法预测。但它会对即时价格走势做出动态估算。 基于同样的分析,APMP 会显示当前市场的真实趋势。迄今为止,趋势几乎总是通过移动平均线、布林带
This EA places 2 pending orders - 1 buy stop and 1 sell stop. Perfect if you are trading news. Features Date and time are configurable - YYYY.MM.DD HH:MM:SS. For extra precision trading, it is even possible to select the second parameter. For order executing, EA uses the market watch time, not individual pair ticks, so that it is able to place the orders as fast, as your broker can handle accepting them. Configurable TP and SL. TP and SL are automatically adjusted if there has been a price gap.
您试过网格策略吗? 现在, 您不必再花时间坐在您的电脑前。仅需开一单, 则 手工交易者 将完整剩余的! 这是一键交易!简单点击面板上的 买 或 卖 按钮, 以及 手工交易者 将设置一个止盈, 挂单和尾随终止。 开单之后,您就可以做其它事情了。 您可以用策略测试的可视模式对产品进行检查。 输入参数 Buy - 买单按钮。 Sell - 卖单按钮。 Close - 所有持仓平仓。 Lots - 首单开仓手数。 Step - 生成网格的步距。 Martin - 后续订单的乘数。 TakeProfit - 止盈点数。 SLPersent - 止损为本金百分比; 若不使用设为 0。 TrailStart - 止盈点数, 开始放置尾随终止。 TrailDistance - 价格距尾随终止的点数。 TrailStep - 尾随终止步距点数。 Orders - EA 放置挂单的数量。 Slippage - 订单执行时的滑点点数。 TimeOut - 开单失败后的重复尝试间隔,以秒为单位。
本 EA 基于 交易者的梦想 指标 https://www.mql5.com/zh/market/product/2492 实盘账户监控: https://www.mql5.com/zh/signals/34001 无初始本金限制。 本产品在 4 和 5 位报价平台上均可工作。 本交易机器人使用两个参数定义横盘 - MaxPriceWidth 价格范围 (点数) 设置最后的柱线数量 (NumberOfBars) - 并根据指标的信号开仓。您可以在评论栏目里的设置或自行设置。 输入参数 Pips Multiplier - 使用 1 与 4 位报价工作或 10 当报价为 5 位时 NumberOfBars - 分析横盘的柱线数量 MaxPriceWidth - 价格范围 Stop Loss - 止损 Take Profit - 止盈 Trailing Stop - 尾随终止 MinProfitForTS - 最小盈利, 此时尾随终止出现 TrailingStopStep - 尾随步长 Lot - 负数 (例如, -3) 代表本金百分比, 正数 (例如, 0.1) 表示固定手数 LotMu
这是现成的交易系统。 本指标非重绘,无滞后 。85% 的交易可盈利。止盈超过止损 3-15 倍! 它可工作于所有货币对,所有时间帧。 有两种简单方式来过滤指标信号: 比较更久周期的指标方向。 使用标准 MACD 指标,若指标值接近 0,则不要入场。 输入参数描述: DrawHistogram - 启用/禁用绘制直方图。 DrawArrow - 启用/禁用绘制箭头。 DrawLine - 启用/禁用绘制线。 Mode - 工作于收盘柱线/当前柱线。 Alerts - 启用/禁用提示。 E-mail notifications - 启用/禁用邮件通知。 Push notifications - 启用/禁用推送通知。
PA 交易的基石是价格动作交易。我依照心中的一件事创建的这个 EA: EA 用一个简单的设置就可以在所有年份执行。并且我已经完成了它。此 EA 在日线图上使用价格动作形态来选择交易。对于我, 此 EA 将是交易圣杯。 此 EA 识别 3 种价格动作形态来入场交易: 内柱线, 针状柱线和最高/最低突破。所有交易带止损。半数交易有固定的止盈, 另一半使用尾随终止。此 EA 已经针对 9 个货币对优化,并且如果您愿意,可以针对所有其它对进行优化。 使用此 EA 的最佳方式是让它运行在所有 9 个对上 (或未来更多) 以及整个市场。如此一来,风险分布到不同对之间,以及增长曲线平滑得多。进一步对其它对的优化就在不久的将来。记住: 一旦某个对已经过优化,则您永远不需要在将来再次优化它! 从评论页面下载预设! PA 交易开发用于日线图表! 现在就试试演示版! 此 EA 的主要优势: 非马丁格尔或网格。 一直使用止损来保护资产。 使用友好。 可针对所有货币对优化 (以优化: EURUSD, GBPUSD, AUDUSD, GBPJPY, EURJPY, USDCAD, USDCHF, USDJPY,
This is an easy-to-use tool for implementing Support Vector Machine Learning in your Expert Advisors, Indicators and other MetaTrader 5 projects. Until now, the use of support vector machine classification has been limited only by advanced coders via external java and c++ dll libraries. This tool has been developed using only the standard MetaTrader 5 tools and provides advanced support vector machine functionality using a very simple interface. Please note: this product is not an Expert Advisor
The Expert Advisor BotMAn uses Moving Average data and an adaptation block. The entry/exit points are located at the points of intersection of the moving averages. The direction is determined by the adaptive system of the Expert Advisor using values of the moving averages. Input Parameters First MA Period - period of the first moving average indicator; First MA Method - averaging method of the first indicator; Second MA Period - period of the second moving average indicator; Second MA Method - a
I am happy to offer you my new upgraded Expert Advisor that trades ON NEWS and ON EVENTS that have a strong influence on the market, but do not occur on schedule! The EA opens trades in case of a sudden price change in any direction and closes them automatically with the profit that you wish. And we all know how often the price changes when a "successful" news appears, how far it can go up or down. Also, this robot protects your deposit by placing SL with customizable parameters. This EA can be
Sideways Alert Indicator is a very effective tool to indicate sideways conditions on live charts and to determine its levels. It helps us trade within the range or trade the breakout or just simply to filter out sideways market conditions.
The demo version of the indicator for MetaTrader 4 The MetaTrader 5 version of the indicator The indicator is based on the digital window-sinc filter with an excellent frequency division. Due to this property you can get a very smooth indicator line. The indicator has three lines: the central line indicates the main trend direction and the "fair" price, the other two lines show the price range. When the central line is read, it is recommended to buy from the bottom line and close a position abo
你想成为一个持续盈利的五星级外汇交易商吗? 1. 阅读我们简单的 交易系统 的基本描述 , 以及它在2020年的主要策略更新 2. 发送您的购买截图,以获得您的个人邀请,参加我们的独家交易聊天 该交易管理器 是所有喜欢使用全自动交易管理的 FX趋势 用户的理想补充。 它立即检测您手动开启的交易,并沿FX趋势线自动管理其止损。 完全自由地浏览所有时间框架而不影响你的订单。 你的交易是根据你在交易经理属性中设置的固定计算设置来管理的。 一个非常特殊和强大的功能是检测和管理由外部专家顾问开出的订单。 设置正确的EA魔法号码,你就能够按照你的个人趋势交易风格管理这些EA订单 。 功能 介绍 自动检测有效订单 自动设置初始止损 自动跟踪止损 自动检测活跃的专家顾问订单 自动管理活跃的专家顾问订单 反趋势交易的安全止损 可选择使用盈亏平衡止损 可选择设置止盈 一些交易操作的通知选项 在所有种类的交易符号上运行,如外汇、股票、商品、债券等。 在所有种类的离线图表上运行,如Renko和范围条形图 主要设置 时间框架。从下拉列表中选择用于计算趋势线的时间框架 外汇趋势周期。选择你喜欢的趋势线计算的
There is a newer version available: Please follow this link to the new product version This clearly arranged display shows you instantly, which currency combination is best to trade on the global Forex market. The strength or weakness of every major currency is calculated tick by tick and the results are sorted by their economic areas to consider their correlation. Important notice: You have to display all Forex symbols in your market watch to get a 100% correct calculation result! Please downl
The indicator works well with index (cfd) such as DAX and UK100, and with currencies pairs. It provides entry signals and indications where it's better to close position directly on a chart for D1, H4, H1 and other periods. Moreover, it includes info about profit daily and monthly (for attached symbol), Spread, GMT Offset & last Price of chart symbol on a small panel. You can change the position of the indicator & colors (default is Green for positive value, Red for negative, Gold for Flat).
This is an indicator that helps you to see what symbols have the best SCORE of SWAP and SPREAD. The SCORE is calculated as follows: SWAP/SPREAD. So, the higher SCORE/SPREAD symbols have, the better (because everyone wants their orders to have positive swap, while keeping spread small). This indicator will help traders have an advantage in swap when choosing symbols and type (buy or sell) to make an order. You can see (in the picture) that this indicator shows a list of symbols with their score b
In-Trading StopLoss Manager is managing your SL automated . You can use 4 different Indicators to let SL Manager move your SL: Kijun-Sen Line (Ichimoku) Parabolic SAR Eponential MA Donchian Channel You can set up the StopLoss Manager on Chart. You can turn the StopLoss Manager Off/On on Chart. You simply open a trade, set up the In-Trading SL Manager and enjoy your free time! See instruction on how to use it in the video.
The indicator draws an equidistant trend channel and adds Fibonacci levels (extension) by the last extremums. The indicator has plenty of settings that can be changed according to your strategy and trading style. Appearance is also customizable. For those who trade within a channel, the indicator displays inclined or inclined + side channels and defines the side channel's width in the terminal window. You can customize the set of Fibo levels according to your preferences. You also can simultaneo
The indicator draws lines that can serve as support/resistance levels. The main and additional levels are displayed as lines, with the color and style defined by the user. Additional levels are only displayed for currency pairs without JPY. Please see the AUDUSD chart below. Yellow ovals indicate some characteristic points where price reaches one of the levels. Simply watch the indicator work on history and in real time mode. External parameters: Levels Step Size, points - step between adjacent
许多盈利交易者不仅知道如何识别市场趋势,而且也能把握趋势建立后的交易机会。 Pz 趋势交易 指标设计用来在趋势行情中尽可能的赚取利润。 已建立的趋势提供了一揽子交易机会,但大多数趋势交易指标完全忽视了它们,让交易者在趋势行情时完全不知道该如何做!一般趋势指标只通知有关的趋势变化,但根本不足以得到卓越的回报. Pz 趋势交易 指标比一般趋势指标显示多达 20 倍的交易 , 因为它注重所谓的市场时机。它不仅显示当前的市场趋势,也有回调,内柱线的突破和调整。它令您在趋势回调之后介入,安全的柱线内突破金字塔加仓,以及发现潜在的反转,和已知的调整。 趋势改变 一个趋势改变在市场方向变化时发生。趋势变化在图表上用带数字的彩色圆圈显示。蓝色 (1) 信号为上涨开始, 而红色 (1) 信号为下跌开始。趋势变化并非评估当前价格动作的结果, 它意味着交易设置是不定时地。如果您正确使用本指标, 在趋势变化时, 您将将已经入场 (参看下面的调整)。 回调 但凡趋势在运动中,行情上下抖动,盈利者收割利润,且其它参与者入场。趋势回调代表好的买入机会,通常是由主力获利离场导致。如果行情在回调后回归上行, 指标将
Price Breakout pattern Scanner is the automatic scanner for traders and investors. It can detect following patterns automatically from your chart. Head and Shoulder - Common tradable pattern. Reverse Head and Shoulder - This pattern is the reverse formation of the Head and Shoulder. Double Top - When the price hits resistance level twice and decline toward the support level, the trader can anticipate sudden bearish breakout through the support level. Double Bottom - The double bottom pattern is
通用多货币交易系统 多货币交易系统,基于标准指标。在此 EA 中应用了 12 个标准指标,可达 3 个信号。所有指标有可定制外部参数。 亲爱的用户, 您可以通过给作者写 私信 订购此 EA 的源代码。 主要优势 自动手数 (根据当前余额计算交易量), 资金管理; 依时间工作 (限制 EA 的交易时间); 尾随止损 (标准 "仅当盈利" 算法); 市场观察 ECN (与 ECN, NDD 账户工作); 实盘出错处理功能; 根据总盈亏整体平仓,并禁用账户内所有EA。 盈亏平衡 (移动止损到开仓位); 马丁格尔 (若有亏损,则开仓手数递增); 只配合指标信号工作 (开仓信号, 反向平仓并开新仓信号); 当信号改变,平反向持仓; 该 "反转" 功能能够将您的策略信号反转。 指标和信号 移动均线 (MA) (信号 1) 信号的计算使用两条均线的相对位置,一条周期较小 (快速 MA) ,另一条周期较大 (慢速 MA)。它们的参数可在以下变量中指定: 当快速 MA 位于慢速 MA之上,买信号出现,当慢速 MA 位于快速 MA之上,卖信号出现。"无信号" 状态未使用。 移动均线收敛发散 (MACD)
這個指標是獨一無二的。 它的任務是跟隨價格的波動暴露在必要時保護信號,主信號後(綠色,紅色)做了一個掉頭。該指標是易於使用,方便工作的專業和新手指示器只顯示三個信號,兩個主要的(綠色和紅色)和一個假的(黃,藍) 。如果你是長(買入)和短期(賣)出現紅色信號,在長(買入)密切未結訂單和開放的認股權證。 指示燈可以提供一個噪聲信號(黃,藍) ,在真正意義上,他們是不是噪音,而這,將工作對他們的顯示屏顯示,你必須放置一個掛單的水平,這是從價格上遠遠不夠。 交易上的指示燈清楚的利潤在2014年總額超過1000% 最低存款為交易0.01手是100元 要求對賬單: 1:500 止損離場炔超過20 % 最小起訂量(手) 0.01 最小訂單量0.01 不要使用電源ups ,他們沒有考慮到損失的計算和強行平倉 貨幣可取美元 推薦由於固定或零差價( ECN / NDD ) 最大訂貨量(手) 10-100 持倉的最大數量 - 不限 增加: 100元每件0.01最低存款 期限為交易指標推薦5米。
This indicator helps to find high/low points. This is not perfect trend indicator, because sometime it shows anti-market trend. But it never misses highest and lowest price in history. So that, the rules for entry are: Sell with downtrend (red line), Buy with uptrend (blue line). Yellow arrows for Sell, but it should be confirmed by downtrend. Aqua arrows for Buy, but it should be confirmed by uptrend.
UPDATE: I apologize for increasing the price from 15$ to 30$, but that was required by MetaQuotes during the version update. The old compilation from 2015 stopped working due to incompatibility with a new terminal. What is Squeeze? A contraction of the Bollinger Bands inside the Keltner Channel reflects a market taking a break and consolidating, and is usually seen as a potential leading indicator of subsequent directional movement or large oscillation movement. When Bollinger bands leave Keltn
The algorithm is based on the Commodity Channel Index and Moving Average. The Expert Advisor shows positive results only in 2013, thus it should be updated once per month. Periods and function parameters are to be changed periodically. The product works only on an account with a leverage exceeding 1:200. Important: spread should be less than 20 or the balance should exceed 5000 USD. Recommended server parameters - the minimum lot is 0.01 and the leverage is 1:500. EURJPY M15 is used for trading.
Classic Multi-currency Break-Even. It only changes order Stop Loss level when the current price reaches Break Even Level pips of profit, securing/"locking" Break Even Profit pips of profit. Allows flexible positions filtering and processing by: Pair Magic Position ID Position Type The Expert Advisor can be placed on any chart. You can use Advanced Break Even simultaneously with any other trading Expert Advisor. Also features: On Screen Display Extended logging Separate EA log file Standard Met
EA Rush Premium is a fully automatic trading system without any indicators. The logic of the EA is based on one of the trading systems of the world master of stock trading and technical analysis by Alexander Elder. It operates with any currency pair, on any time period. Recommended minimum deposit: For Standard Forex accounts - 2 000 USD with the minimum lot 0.01. For Mini Forex accounts - 200 USD with the minimum lot 0.01. For Micro Forex accounts - 20 USD with the minimum lot 0.01. Parame
指标捕捉趋势并显示入场的点位。指标可在小时间帧内用于剥头皮,以及长线交易。
这是著名的时序指标 现在,您可以使用这个星球上最著名的时序指标。 百万富翁 Mostafa Belkhayate 在外汇市场使用这个特殊指标来验证他的另一个著名 重心 指标提供的入场信号,籍此赢得了他的声誉。我花了数小时,数天,数周来破解公式, 现在它终于能提供给您啦。 全新的、独特的,针对 MetaTrader5 时序可以完美地验证您的入场信号。这是此指标首次可用于 MetaTrader 5。我在反向工程之前已经进行了广泛搜索。从未有人发布用 MQL5 编制的时序。 此处是您在市场上唯一能找到它的地方。它既不会存在于互联网,也不存在于代码库... 不要犹豫来试用它 看看它的能量! 什么是时序? 时序指标给出了完美的入场时间。它必须结合其它 "主要" 指标一起使用。其目的是提高主要指标的效率。 若您使用自己的策略进行交易, 当您得到买或卖信号时, 快速查看一下时序指标并等待 "现在出击!" 黄色信号 来极大提升您的盈利率 。 如果时序没有出击信号, 那么就不是最佳入场时机。若无时序, 您的交易不会得到最佳利润。或者更糟的是,您可能会亏损。 直接结果 通过使用 3 色代码,您立刻就
The input parameter counted_bars determines on how many bars the indicator lines will be visible. The input parameter barsNum is the period for bands calculation. When PriceClose for previous bar is above upper band a Long position may be opened. When PriceClose for previous bar is under lower band a Short position may be opened. If the current Price is between bands it is time to wait.
该指标可识别30多种日本烛台图案,并在图表上突出显示它们。这只是价格行为交易者不能没有的那些指标之一。 一夜之间增强您的技术分析 轻松检测日本烛台图案 交易可靠且通用的反转模式 使用延续模式安全跳入已建立的趋势 指示器不重涂并实施警报 该指标实现了一个多时间框架 仪表板 它检测到的模式太多,以至于图表看起来非常混乱,难以阅读。交易者可能需要禁用指标输入中的不良图案,以使图表更具可读性。 它检测1条,2条,3条和多条样式 它检测逆转,持续和弱点模式 模式可以启用或禁用 看涨模式用 蓝色 标记,空头模式用 红色 标记,中性模式用 灰色 标记。 检测到的烛台模式列表 从1到5小节的突破距离(又名线罢工) 法基(又名Hikkake) 反间隙 三名士兵/三只乌鸦 锤子/流星/吊人 吞没 外上/外下 Harami 由上至下 晨星/晚星 踢球者 刺穿/乌云 皮带托 从1到5小条上升三分/下降三分 田木峡 并排间隙 视窗 前进块/下降块 审议 Marubozu 挤压警报(又称主蜡烛) Dojis 设置 PaintBars 使用条形的颜色打开/关闭图案的突出显示。 DisplayLabels
Alex 盈利 EA 仅通过挂单交易 EURUSD。挂单放置在重要级别的突破位置。 本 EA 工作于 H1。建议账户类型 - ECN, 建议杠杆 - 1:500。 本 EA 不需要很大本金,并可以从 $50 开始。 每笔交易以停止位保护 (止损和止盈)。仓量依据可用基金数量。 当赢得了最小利润,订单转移到盈亏平衡位,让我们将交易的亏损降到最低。 实盘账户监控: https://www.mql5.com/zh/users/sania2010s/seller Alex 盈利是全自动 EA,并不需要任何交易者的行动。 本 EA 不使用马丁格尔。它需要一个低点差的经纪商和一个 VPS。 参数 TP - 挂单的止盈; SL - 挂单的止损; BBUSize - 盈利点数, 此时止损会移动到盈亏平衡位; BBUSizepip - 盈亏平衡点数大小; Magic - 魔幻数字; UseTrailing - 尾随开关; TrailingStart - 盈利点数, 之后尾随开始; TrailingStep - 步长大小, 每多盈利一步,止损将移动到下一阶段; TrailingStop - 步长大小,
The indicator works on any currency pair. Preferred timeframes are from M15 to D1. When a signal is triggered, an appropriate arrow with a definite color and stop loss line is displayed on a chart. These lines can also be used as support/resistance levels. The indicator does not redraw. Below are my recommendations on working with the indicator. Open a trade after the signal is triggered and the next candle is closed. Stop loss is to be placed 5-30 points away from an arrow or a stop line. I ca
The indicator searches for the points of the beginning of correction or a turn. It gives good market entry points. It is simple to use and features rich configuration options for demanding traders. It will help you to find short-term and long-term trends. Turn or divergence channels are drawn based on the search for divergence using the RSI indicator. The RSI values are calculated with different periods depending on channel properties. The indicator utilizes the idea of Elliott Wave patterns. It
PIPSPEED PRO 是一款真正的专业 EA,它测量价格动作的戏剧性变化,并据此行动。未使用滞后指标。所有交易有严格的止损,和天才的盈利方式。它每年大概每个货币对交易 100 次。盈利每年平均国超过 100%。每个货币对的开仓不会超过 2 单。 它已经针对 13 个货币对优化: eurusd, eurusd, usdchf, gbpusd, usdcad, audusd, nzdusd, eurjpy, usdjpy, gbpjpy, euraud, eurcad, eurgbp 和 xauusd。 您在网络里将不会找到像这样的系统了。 PIPSPEED PRO 已经针对 H1 图表优化。 现在就试试演示版! EA 的主要特点: 无马丁格尔, 网格或均摊策略!许多在售的 EA即使简单的马丁格尔系统,最终,它们总是会失败! 无剥头皮, 所以可以在所有经纪商工作平台上! 同时最大 2 单! 专业资金管理! 用户友好: 仅有很少一些参数需要修改。 可调的保守和激进交易风格,可调 RISK-因子。 自动适应 4-5 位经纪商报价。 主要参数: DevFactor - Deviation_F
FTRADE 是一款 EA,使用最高价和最低价的突破来入场交易。每次交易有固定的止损和止盈/尾随终止。它已经针对 EURUSD H4 时间帧完全优化, 但您可以调整它来适用于其它货币对。它使用非马丁格尔交易风格,并自 2000 年以来表现十分稳定 (参看图形)。 现在就试试演示版! 此 EA 的主要优势: 非马丁格尔! 同时刻不超过 4 单。 一直使用止损来保护资产。 使用友好。 针对所有货币对优化。 可调整参数: countback - 最高价和最低价的回试蜡烛数量。 stop - 止损点数。 limit - 第一笔交易的止盈点数。 trailingstop - 第二笔交易的尾随终止点数。 useMA - 使用移动均线。如果您希望仅当 'MA > MA2' 时做多, 以及 'MA < MA2' 时做空,请填 "1"。 MAperiod - 快速 MA 周期。 MA2period - 第二条 MA 周期。 trade1 - 使用固定止损和止盈开一笔交易。 trade2 - 使用尾随终止开一笔交易 (初始止损与第一笔交易相同)。 breakevenpips - 当正盈利点数超过此数值
VTrade is a very easy to use Expert Advisors. It works best on EURUSD M5 charts and GBPUSD M5 charts, but it can also be optimized for other currencies. It is not a high frequency trader. It uses NO martingale or grid so it's very safe for your account. The presets for EURUSD and GBPUSD are available on the comments page. Try the demo now! Key Characteristics of the EA: NO martingale,grid or averaging strategy NO scalping, so works with all brokers Professional money-management User-friendly:
AUDJPY Mountain is one of the "Mountain" EA Series. It hits the rules of a good trader: allows the profit to run and cuts the losses; works with large take profit and medium stop loss. Usually price does not reach them; EA is always into the market and works with stop & reverse technique on its indicator; money management is based on available free margin. The default value is 2.0%. AUDJPY Mountain works on 4H time frame with symbol AUDJPY, of course. Try also other "Mountain" EAs and manage a
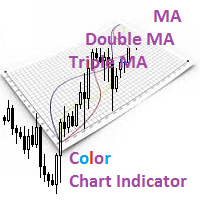
Description A universal colored indicator of moving averages: Moving Average, Double Moving Average, Triple Moving Average . The indicator provides various opportunities for the analysis of prices based on different ways of constructing moving averages in the window of the main financial instrument. You can color bullish and bearish moods. Inputs MA_Type - type of multiplicity: Moving Average. Double Moving Average. Triple Moving Average. MA_Period - the MA period. MA_Method - the averaging met
The AbarkCrossover Expert Advisor (EA) enters a trade based on (i) the crossing over of two exponential moving averages and (ii) a pre-defined price action condition. It can be used on GBPCHF, GBPUSD and EURUSD as well as other pairs; using 0.01 lots per pair on a $200 account and up to three pairs at the same time. See below for recommended settings. The H1 timeframe has been the most successful over the past few years. * GBPCHF successfully back tests for more than 50 pips since January 201
FourAverage: A Breakthrough in Trend Identification With evolving information technology and increasing number of market participants, financial markets get less and less analyzable using good old indicators. Common technical analysis tools, such as Moving Average or Stochastic alone, are not capable of identifying the trend direction or reversal. Can a single indicator show the right direction of the future price, without changing its parameters over 14 years' history, while at the same time re
Stochastic Oscillator is one of the most popular and accurate oscillators widely used by traders to capture overbought and oversold areas of price action. Although the Stochastic indicator works fine for an interval of the market, it fails to generate profitable signals when the market conditions change, and hence it produces wrong signals resulting in big losses. Have you ever thought about an adaptive Stochastic indicator that adapts its period of calculation based on the market conditions? Th
Relative Strength Index (RSI) is one of the most popular and accurate oscillators widely used by traders to capture overbought and oversold areas of price action. Although the RSI indicator works fine for a period of market, it fails to generate profitable signals when market condition changes, and hence produces wrong signals which results in big losses. Have you ever thought about an adaptive RSI indicator that adapts its period of calculation based on the market conditions? The presented indi
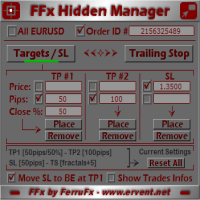
面板 FFx 隐藏管理 轻松帮助您在图表上直接管理您的订单。下面描述所有特征: 止盈, 止损和尾随停止均隐藏 每笔交易在图表上都有自己的指示线 可按您的需要拖拽任何线来改变止盈/止损 当止盈 #1 到达,自动将止损位移到盈亏平衡位置的选项 选择止盈/止损类型的选项 (通过点数或价格) 选择尾随停止类型的选项 (通过点数, MA, 分形, PSAR 或 ATR) 定义哪些订单您希望在当前图表上进行管理 (所有订单或特定单号) 最大化 / 最小化面板按钮 在图表上将面板拖拽到任意位置 显示交易信息的选项 如何使用它? (参看以下截图) 选择您希望管理的订单 (所有或特定的) 设置您的目标, 止损和尾随停止 … 之后点击 “放置”。它们都独立工作,这样您就只需设置一次。 如果您希望删除一个止盈, 止损或尾随停止, 选择正确的订单 … 然后点击 “删除” 当您选择设置 “所有当前符号”, 则 “当前设置”显示在面板里。这些设置将自动用于所有新开订单。若要重置/删除这些设置, 点击 “重置所有”。 如果 “显示交易信息”被选中, 一个新的小表格显示在面板之下, 包括每笔订单及其当前的目标和尾随停
厌倦了绘制支撑线和阻力线? 支撑阻力 是一个多时间指标,可以自动检测并绘制图表中的支撑线和阻力线,并具有非常有趣的变化:随着时间的推移测试价格水平及其重要性的提高,线变得越来越粗。 [ 安装指南 | 更新指南 | 故障排除 | 常见问题 | 所有产品 ] 一夜之间增强您的技术分析 无需浏览图表即可检测重要的价格水平 一目了然地识别所有价格水平的相对优势 每次交易最多可节省半小时的绘图线 指标显示所有价格水平的期限 指示器不重涂 过去和现在的价格水平因接近程度而崩溃,并根据当前的市场行为进行了调整。在动作发生的地方绘制了线条,而不一定在峰值处绘制了线条。 价格水平随着时间的推移而被拒绝,变得越来越暗 定期清除不重要的价格水平以避免噪音 可自定义的时间范围选择和崩溃因子 它实现了电子邮件/声音/推送警报的突破 输入参数 指标设置:指标将从当前时间段读取价格,但您可以选择另一个。例如,您可以在H4图表中显示D1支撑线和阻力线。您还可以使用 价格水平密度 参数选择在图表上显示多少价格水平。 颜色设置:根据重要性输入所需的支撑线和阻力线颜色。 标签设置:(可选)可以在指示器中显示用于
该指标分析过去的价格走势以预测市场的买入和卖出压力:它可以通过回顾过去并分析当前价格附近的价格高峰和低谷来做到这一点。这是最先进的确认指示器。 [ 安装指南 | 更新指南 | 故障排除 | 常见问题 | 所有产品 ] 预测市场的买卖压力 避免陷入购买狂潮的陷阱 无需设置也无需优化 该指标在所有时间范围内均有效 极易使用 潜在的供求价格是指许多市场参与者可能持有其亏损头寸,希望在收支平衡时清算的价格。因此,在这些价格水平上有大量活动。 供需双方都量化为数字 如果供应高于需求,则可以预期卖压 如果供应低于需求,则可以预期购买压力 当供应高于需求时寻找空头 当供应低于需求时寻找多头 输入参数 范围:当前价格附近的波动率乘数,用于搜索过去的高峰和低谷。 作者 ArturoLópezPérez,私人投资者和投机者,软件工程师,零零点交易解决方案的创始人。
掌中鸟 是一款多货币对 EA, 100% 准备完毕可用于任何类型账户, 指数和交易环境。 此 EA 正在特定的模拟账户中进行实际交易, 已在信号服务页面注册。详细统计和结果提供在它的 信号页面 。 请在购买之前或之后,联系 wahoo.mql@gmail.com,索取 PDF 手册,包括完整的 EA 描述和一些提示。 界限 EA 在行情处于超卖/超买,且交易量极低时,入场交易,并当行情继续深入超卖/超买区域时加仓来摊低价位。 没有亏损平仓选项。所以, 它们仅在盈利时平仓。所有账户余额作为止损。这就是为什么建议要按月出金。 输入参数 Symbols (use "," sign as a separator) - 指定交易货币对。EA 可以交易任意数量货币对。使用逗号分隔。名称输入应与市场观察里的一致, 即,"URUSD,GBPUSD" 或 "URUSD,USDJPY, EURJPY,AUDUSD" Time Frame - 选择搜索超卖/超买区域的时间帧。 Take Profit, pips - 市场订单的止盈位。无硬性止盈。EA 自动探测 4/5 位的报价。1 点依据货币对等于 0.0
BladePro is a scalper Expert Advisor designed for professional Forex tradin. The V1.71 version offers three strategies: Strategy No.1 " Pro ", Strategy No.2 " Protect ", Strategy No.3 " CCI-ADX". Strategy No.1 "Pro": the market is entered using stop orders placed at regular intervals from the price. The EA "trails" pending orders following the price. Strategy No.2 "Protect": the market is entered in overbought and oversold areas, wihch are determined using a unique algorithm. Additional setting
This indicator uses complex algorithms to identify the market trend with high accuracy. It is designed for easy visualization and employs the following methods: When the indicator line is above the price, there is a downward trend. When you see the indicator line below the price, there is an upward trend. This indicator with added features allows to display spread to make investors' experience more intuitive. This indicator can be used when developing Expert Advisors. Please contact us if you wi
This is a simple and reliable indicator that can be used as an additional filter in your trading system. Also, you can create a new trading system based on the product. The indicator is capable of detecting the rise and fall of the market on the selected number of candles (adjustable parameter). Several indicators with different parameters can be applied to a single chart. COMMENT function has also been provided for more convenience allowing you to leave a comment at the line's end. Added new tr
Need to open a pending order at a specific time? The CAP Pending Order at Time opens pending orders at a specific time or specific date for you, avoiding human errors and enhancing your trading activity. It is useful for news traders who open pending orders before the news come out. The EA performs the following tasks: It can open pending orders at a given distance from the current price. It can open pending orders at a specific time and day. It works like on a weekly schedule. (True/False) It
When you combine short term fibos with the long term, your chart get missed up with a lot of lines that hardly make sense at first view. The best way to improve the clearness and there for the easiness to read your chart is by deleting the fibo levels that you no longer need, for example those levels that the price proved didn’t work as support or resistance. With Fibo Pro, you can activate or deactivate from a set of fibo levels pre-settled by you, without miss with the default fibo configurati
Expert Advisor Plan B4 is based on analyzing of price action. Positions are closed when opposite signals appear. Input Parameters Period - number of bars to be analyzed; Mode - operation mode of the Expert Advisor (0-11); Fixed Lot - fixed lot value; Variable Lot - variable lot as a percentage of the free margin. The screenshots demonstrate the backtesting results. The Expert Advisor was tested on EURUSD M30 in the "Every tick" mode from 07.01.2013 to 08.02.2014. The Expert Advisor was set to mo
Need to see your trading history visually on your chart represented as arrows for entries and exits, SLs, TPs just the same way that MetaTrader 4 shows then when you drag a completed trade onto your chart? Need to see someone else's trading history on your chart but you only have a detailed statement or CSV file of the trades ? Need to visually examine trades placed by a signal before subscribing to it ? Now you can. Trade Visualiser shows the trades just the same way that MT4 will in the Strat
What is Squeeze? A contraction of the Bollinger Bands inside the Keltner Channel reflects a market taking a break and consolidating, and is usually seen as a potential leading indicator of subsequent directional movement or large oscillation movement. When Bollinger bands leave Keltner Channel it means markets switching from a low volatility to high volatility and high volatility are something all traders are looking for. What I was missing in some indicators is possibility of monitoring many ti
The Expert Advisor is based on TraderDream MT5 . No initial deposit limitations. The product works on 4 and 5-digit quotes. The trading robot defines flat using two parameters - MaxPriceWidth price range (in points) is set for the last number of bars (NumberOfBars) - and opens a position according to the indicator's signal. You can use the settings offered in Comments section or set your own ones. Input Parameters Pips Multiplier - use 1 if you work with 4-digit quotes or 10 in case of 5-d
The indicator works on any currency pair. The preferred timeframe is M15 or higher. When a signal is triggered, an appropriate arrow with a definite color, text and stop loss line are displayed on a chart: Blue color and up arrow - buy Red color and down arrow - sell The indicator is non-repainting. Below are my recommendations on working with it: Open a trade after a signal is triggered and a candle is closed. Stop loss is to be placed 5-10 points above the candle, at which the last signal is r
This is an easy to use signal indicator which shows and alerts probability measures for buys and sells in near future. It is based on statistical data gathered on existing history and takes into account all observed price changes versus corresponding bar intervals in the past. The statistical calculations use the same matrix as another related indicator - PointsVsBars. Once the indicator is placed on a chart, it shows 2 labels with current estimation of signal probability and alerts when signal
The indicator provides a statistic histogram of estimated price movements for intraday bars. It builds a histogram of average price movements for every intraday bar in history, separately for each day of week. Bars with movements above standard deviation or with higher percentage of buys than sells, or vice versa, can be used as direct trading signals. The indicator looks up current symbol history and sums up returns on every single intraday bar on a specific day of week. For example, if current
自适应剥头皮 EA 是一款多货币剥头皮 EA,用在 EURUSD 和 GBPUSD 的 M15 时间帧。使用若干策略,在市场条件下适应性强。交易基于若干指标,并且不是即时报价剥头皮 EA。自适应剥头皮 EA 使用一个智能风险管理系统 - 在 4 个时间帧里自动检测价格走势,并且根据当前条件行动。建议在低点差的经纪商平台和 VPS 上使用。您可以从 $100 开始。 参数: ExpertName = 改变 EA 名称,可以对经纪商隐藏 MagicNumber = 策略1 的独有号码 MagicNumber1 = 策略 2 的独有号码 MagicNumber2 = 策略 3 的独有号码 MagicNumber3 = 策略4 的独有号码 OpenHour = EA 开始工作时间 CloseHour = EA 停止工作时间 SafeMode = 智能风险管理系统, 请一直设为 True Lots = 如果 Risk = 0,固定交易手数 LotDecimal = 如果您的经纪商以 0.01 手开始,且增量为 0.01,将之设为 2。如果您的经纪商以 0.1 手开始,且增量为 0.1 手,将之
Value Charts (Helweg and Stendahl, 2002) is an innovative charting technique that displays price in terms of value instead of cost even when price volatility changes over time. It shows you when a particular market is at an extreme level and is likely to reverse. How to interpret The Value Chart indicator defines market valuation by plotting price in one of five primary valuation zones, which include: Significantly Overvalued Moderately Overvalued Fair Value Moderately Undervalued Significantly
Wolfe Waves是所有金融市场中自然发生的交易模式,代表着争取均衡价格的斗争。这些模式可以在短期和长期时间内发展,并且是存在的最可靠的预测反转模式之一,通常早于强劲和长期的价格波动。 [ 安装指南 | 更新指南 | 故障排除 | 常见问题 | 所有产品 ] 清除交易信号 极易交易 可自定义的颜色和尺寸 实施绩效统计 显示适当的止损和获利水平 它实现了电子邮件/声音/视觉警报 指示器同时绘制图案和突破箭头,以防止指示器在展开时重新绘制图案。但是,如果输入突破发生多次,则可能会少量重绘(不是很频繁),从而导致指示器重新绘制。该指示器为非底漆。 狼波的定义 沃尔夫波必须具有以下特征。 波浪3-4必须停留在1-2创建的通道内 波浪4在波浪1-2产生的通道内 波动5超出了波动1和3所创建的趋势线 输入参数 幅度-幅度表示替代价格点之间的最小柱线量。要找到大图案,请增加幅度参数。要查找较小的模式,请减小幅度参数。您可以在图表中多次加载指标,以查找不同大小的重叠图案。 突破期-可选的Donchian突破期,用于确认Wolfe Wave。零表示未使用。 最大历史柱线-指标在图表中加载时要
This indicator identifies market modes based on a moving average channel of the highs and lows. When the system is in the bull mode, it only allows the channel to increase, and vice versa in bear. The purpose of choosing a channel over just a moving average is to get the benefits of hysteresis and reduce whipsaws by using a range of values before switching from bull to bear regime. Hysteresis is a natural phenomenon that appears in magnetism, elastics, cell mitosis and control theory (e.g. th
快速、高品质的交易拷贝机,可用于您的实盘/模拟账户。此 EA 开发用于从 МetaTrader 4 终端拷贝交易。 多客户端交易拷贝机: 本 EA 将无延迟拷贝所有持仓。 一个 EA 拷贝所有持仓。 本拷贝机可工作在最高速度,独立且无须等待新的即时报价 (Use_Speed_Exchange = true)。 对于多终端拷贝机来说,终端数量 (接收者/源提供者) 是无限的。 本 EA 不使用 dll。 能够选择哪些交易将会被拷贝的终端 (МТ4/МТ5)。 可与其它任何 EA, 指标和脚本无障碍工作。 此外,通过相关认可,您有机会添加免费的附加功能,而不会对拷贝机的整体运作造成任何负面影响。这需要您与卖家直接联系。 无论是家用 PC 以及远程的 Windows 服务器,它都展示了高效能。 许可证激活数量 30。 如果您使用 Speed 功能 - 循环中断在毫秒级 (1 秒 = 1000 毫秒, Use_Speed_Exchange = true), 则不要在 EA 运行期间修改任何设置。在修改它们之前, 从图表中移除 EA。如果您不喜欢它并接受降低速度进行拷贝, 您可以切换 EA 至标
快速、高品质的交易拷贝机,可用于您的实盘/模拟账户。此 EA 开发用于 МetaTrader 4 终端,哪些交易将会被拷贝。 多客户端交易拷贝机: 本 EA 将无延迟拷贝所有持仓。 一个 EA 拷贝所有持仓。 本拷贝机可工作在最高速度,独立且无须等待新的即时报价 (Use_Speed_Exchange = true)。 对于多终端拷贝机来说,终端数量 (接收者/源提供者) 是无限的。 本 EA 不使用 dll。 能够选择哪些交易将会被拷贝的终端 (МetaTrader 4/МetaTrader 5)。 可与其它任何 EA, 指标和脚本无障碍工作。 此外,通过相关认可,您有机会添加免费的附加功能,而不会对拷贝机的整体运作造成任何负面影响。这需要您与卖家直接联系。 无论是家用 PC 以及远程的 Windows 服务器,它都展示了高效能。 许可证激活数量 30。 如果您使用 Speed 功能 - 循环中断在毫秒级 (1 秒 = 1000 毫秒, Use_Speed_Exchange = true), 则不要在 EA 运行期间修改任何设置。在修改它们之前, 从图表中移除 EA。如果您不喜欢它并
Ilan trailing for MetaTrader 5 Determines the direction of trading according to candlestick patterns. Settings: Initial volume. Lot increasing exponent. Density of averaging (step of bends opening). Maximum amount of averaging (the maximum number of bends). Take Profit in points. Selecting the volume accuracy (number of digits after a decimal point in the volume). Magic number of the Expert Advisor. Slippage. Trailing Stop. Maximum possible loss as a percentage of the deposit.
似乎逻辑上可以知道一笔交易能否有许多潜在利润。为什么要浪费时间在低于理想条件下进行交易呢? 这款 领先指标 提供货币价格走势的详尽分析, 但更重要的是.... 它能推断选择时间帧的下 24 周期内的价格走势 。黄金时段的复杂算法考虑了每个独立周期,并以令人肃然起敬的精准度判断未来价格的活动。 使用黄金时段您将更深刻的理解周线周期对于每个交易品种的影响。您将看到哪些期间、哪些天可以产生更多的盈利交易, 以及您最好避开去读书的期间。您会看到交易良机来临!您也会看到糟糕的交易时期来临!但您会了解其中的差别! 周期受到不同和重叠的时段影响,且常规财经消息的发布能够被识别。活跃度迅速增加的期间 (加速区域) 能够被隔离,因为它可以提供一些有趣的交易机会,诸如 knee-jerk 价格行为的反转交易, 并提供了行情可能发生的预警,如趋势减速和反向,往往发生在活动度增加区域的峰值之间。 请注意:本指标是日内交易者的一款工具,它不会在周期大于 H1 的时间帧里工作! 由作者建议的其它指标: 趋势 = 高级范围基带 和 DMDR 超买/超卖 = 高级范围基带 突破 = DMDR
This is a more consistent oscillator with very high probability. It looks very much like stochastic oscillator but it is smoother and much more reliable. Its very suitable for divergence trading and can also be used efficiently for momentum trading. This is the MetaTrader 4 version of High Probability Oscillator.
This is a non-indicator trading robot. The trading is performed inside the channel. Trading by time is provided in the Expert Advisor's settings. For example, you can trade only during Asian and American sessions. The product contains protection against an increased spread, which can expand during a rollover and news releases. Also, there is a protection against reducing the leverage on Friday. The Expert Advisor is set for AUDNZD M15. WidthFactor - channel expansion ratio. 0.7 on default. O
Adaptive channel scalper using MA and dynamic channel. The Expert Advisor works well with traditionally flat pairs: AUDNZD, EURCHF, EURGBP, AUDCAD, etc. Trading by time is provided in the Expert Advisor's settings. The product contains protection against an increased spread, which can expand during a rollover and news releases. Also, there is a protection against reducing the leverage on Friday. The Expert Advisor is set for AUDNZD M15. Trading is performed 24 hours a day. WidthFactor - chann
This is an adaptive channel scalper using Donchian channel with dynamically changed period. The Expert Advisor works well with traditionally flat pairs: AUDNZD, EURCHF, EURGBP, AUDCAD, etc. Trading by time is provided in the Expert Advisor's settings. For example, you can trade only during Asian and American sessions. The product contains protection against an increased spread, which can expand during a rollover and news releases. Also, there is a protection against reducing the leverage on Fr
Description A colored multicurrency/multy-symbol oscillator Stochastic Smart based on the double or triple MA . Compared with the standard Stochastic, this oscillator is more sensitive, which allows it to generate signals in advance. The indicator may be used with any broker, irrespective of the name of the financial instrument since it is necessary to manually enter the name as an input parameter. If you enter a non-existent or incorrect name of a financial instrument, you will receive an err
本指标可以让您享受两个最流行的产品来分析在感兴趣的价位的请求量和市场成交量: 真实市场深度图表 真实报价足迹成交量图表 本产品结合两个指标的效力,并以单个文件提供。 反危机出售。今日低价。赶紧! 真实的 COMBO 市场深度功能和报价成交量图表,完全等同于原始指标。您将享受这两款产品结合为单一超级指标的力量!下面是您将得到的功能: 真实市场深度图表 股民专用工具现已在 MetaTrader 5 上可用。 真实市场深度图表 指标在图表上以直方条的形式显示可视化的市场深度,并在实时模式下刷新。 利用 真实市场深度图表 指标您可以正确评估市场请求并从图表上看到大的市场。这可以 100% 的精确剥头皮和设置持仓止损。 指标以两种相应颜色的水平直方条形式显示买和卖的请求 (买-卖)。价格图表上给定级别的显示条和它们的长度与请求的交易量相应。此外, 它指示买卖请求的最大交易量。 此指标显示买卖请求总数量作为堆积面积图。这可以评估当经过下一价位时将会执行的请求总量。买卖请求总数量也显示在图表上。 省缺, 指标显示在图表背景上, 且它不会干扰任何其它指标。当使用指标交易时, 建议使用实际交易量。 本