Multi Dashboard Scalper
- 指标
- 版本: 1.60
- 激活: 10
Multi Dashboard Scalper (MT4 Indicator)
A powerful MT4 scalping dashboard built to reveal true market strength across currencies, commodities, and cross‑pairs — helping you make precise, high‑probability trading decisions in seconds.
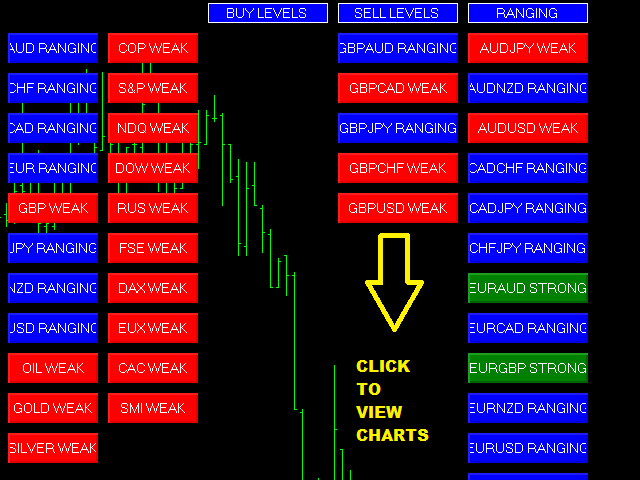
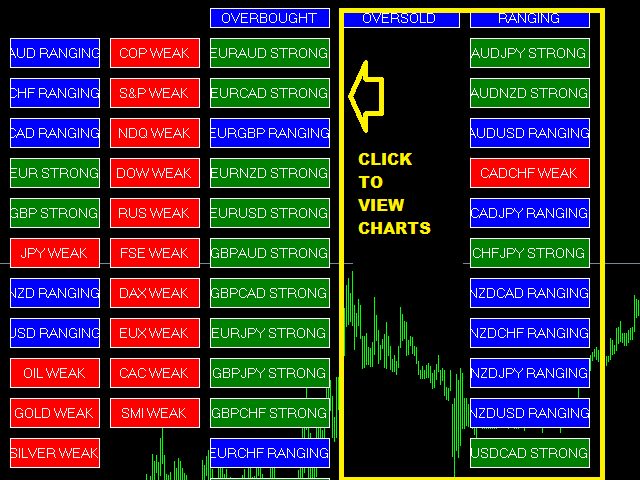
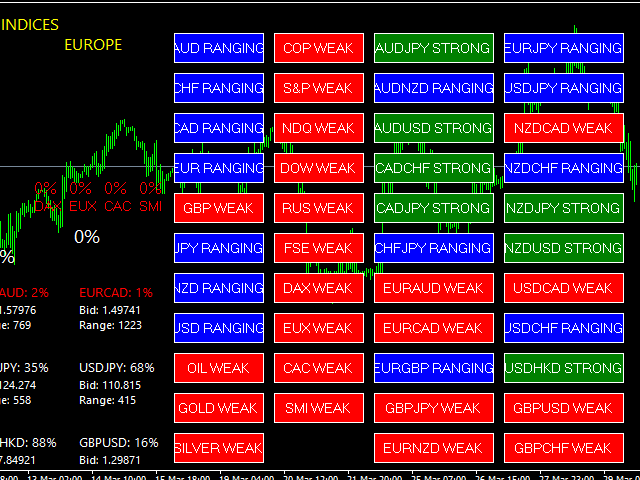
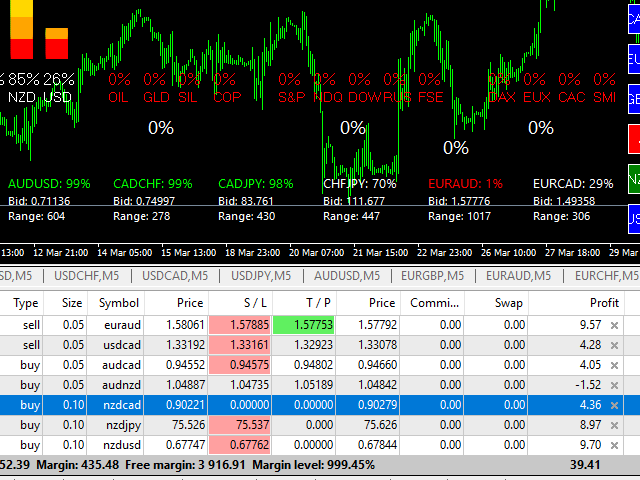
The Multi Dashboard Scalper analyzes global market strength using a proprietary calculation engine, giving you instant clarity on which currencies and markets are strong, weak, or range‑bound.
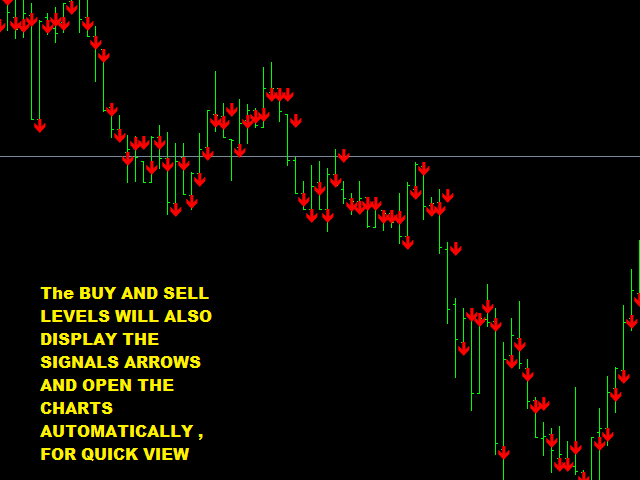
By visually displaying strength percentages and highlighting optimal BUY or SELL conditions, this tool delivers a fast, data‑driven edge for scalpers and short‑term traders.
Why This Indicator Is a Game‑Changer
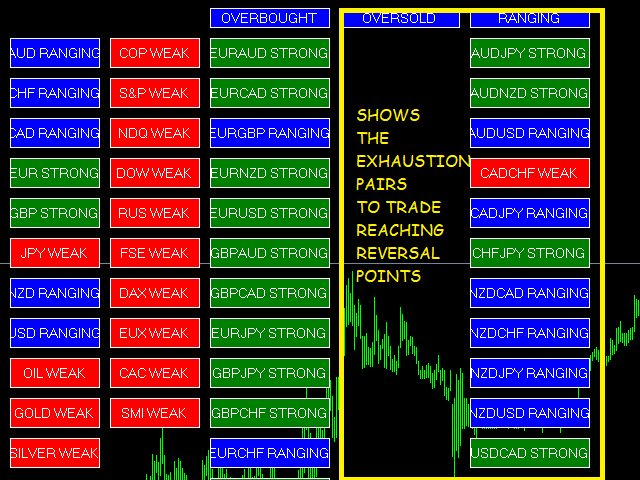
• Advanced Cross‑Currency Strength Analysis: Measures strength across related markets to generate reliable scalp signals.
• Global Market Strength Dashboard: Instantly see the strength/weakness of currencies, commodities, and other markets.
• Clear Buy/Sell Bias: Strong markets suggest bullish potential; weak markets indicate bearish setups.
• Visual Strength Zones: Green highlights strong markets; red highlights weak markets for quick decision-making.
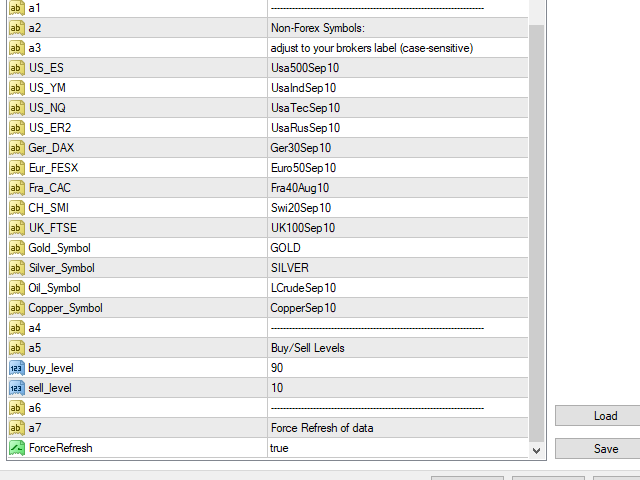
• Adjustable Strength Filters: Customize strength thresholds to match your scalping style and risk tolerance.
• Built‑In Risk Discipline: Encourages smart trading by reinforcing the importance of stop loss and risk management.
Key Indicator Features
• Platform: MetaTrader 4 (MT4)
• Primary Purpose: Generates accurate scalp signals using global cross‑market strength data
• Dashboard Functions:
– Calculates proprietary strength values for all major markets, pairs, and commodities
– Displays real-time percentage strength for each item
– Highlights strong (green), weak (red), and neutral (range-bound) conditions
• Signal Logic:
– Strong market + strong related currency pair = probable BUY
– Weak market + weak related currency pair = probable SELL
• Customizable Inputs:
– Strength threshold adjustments
– Display preferences and visualization filters
• Designed for Short-Term Strategies: Ideal for scalpers who require fast, precise decision-making
• Risk‑Management Reminder: Built with the understanding that stop loss usage is essential for consistent profitability
Why Traders Choose the Multi Dashboard Scalper
This indicator provides a unique, global strength snapshot that most MT4 tools cannot offer.
By combining cross-currency analysis with instant strength visualization, it empowers traders to scalp smarter, faster, and with greater confidence. The result: more accurate entries and reduced exposure to weak or uncertain setups.
Analyze Smarter. Scalp Sharper. Get the Multi Dashboard Scalper Today!