MK Signal

MK Confluence Signal Dashboard

Technical Confluence Indicator for MetaTrader 5

MK Confluence Signal Dashboard combines MACD crossover detection, Woodies-style CCI confirmation, Murrey-style price levels, and tick volume analysis into one chart-based indicator.

Key Features

  • BUY and SELL arrows displayed directly on the chart.

  • Strong, Medium, and Weak signal classifications.

  • Color-coded candles based on signal direction and strength.

  • Technical confluence scoring from 0 to 100.

  • On-chart dashboard showing confirmation conditions.

  • Popup, sound, push, and email alerts.

  • Signal confirmation after candle close.

  • Customizable thresholds and filtering settings.

The indicator is designed to help traders evaluate the alignment of multiple technical conditions. It does not execute trades automatically.

Signal scores represent technical confluence, not the probability of a profitable trade. Trading involves risk, and no particular outcome is guaranteed.


推荐产品
AI Camarilla Level Trader
Fadi Hassan Khaled Ghanem
基于前一日的 Camarilla 水平;在 H3 和 L3 水平逆势交易,并跟随突破 H4 和 L4 的行情。 工作原理 EA 在信号时间周期(默认 H1)的每根已收盘K线上评估一次规则,因此信号不会重绘,测试器与实时图表上的逻辑完全一致。当形态出现且该品种上没有本 EA 的持仓时,它会开立一笔带有止损和目标的市价单。 主要功能 基于风险的手数计算(按余额百分比),带最大手数上限和可用预付款检查 基于 ATR 的止损,带最大距离限制,目标为止损的倍数 基于 ATR 的保本和追踪止损 交易之间的最少K线数 每次仅一个持仓,无网格,无马丁格尔,无加仓摊平 每笔交易都带有 SL 和 TP 图表上的小型状态面板 推荐 主要外汇货币对、XAUUSD 和指数。信号时间周期默认为 H1;可在输入参数中更改。 输入参数 风险管理: 每笔交易风险(余额的 %),最大手数上限,魔术号。 信号: 信号时间周期,交易 H3 / L3 反转,交易 H4 / L4 突破。 止损与目标: ATR 周期,默认 SL 距离(x ATR),最大 SL 距离(x ATR,0 = 关闭),TP 为 SL 距离的倍数。 交易管
FREE
Free automatic Fibonacci is an indicator that automatically plots a Fibonacci retracement based on the number of bars you select on the BarsToScan setting in the indicator. The Fibonacci is automatically updated in real time as new highest and lowest values appears amongst the selected bars. You can select which level values to be displayed in the indicator settings. You can also select the color of the levels thus enabling the trader to be able to attach the indicator several times with differe
FREE
MarketMagnet
Kelly Adediran Raymond
Are you ready to take your trading journey to new heights? Look no further than MarketMagnet, this groundbreaking indicator designed to propel your trading success with excitement and accuracy. Powered by the convergence of Momentum and CCI (Commodity Channel Index), MarketMagnet equips traders with the ultimate tool to determine direction and entry prices for a wide range of recommended currency pairs and instruments. It is designed for traders seeking to scalp for a few pips on lower timeframe
MSnR Lines
Pierre Paul Amoussou
MSnR Lines 是一个自定义指标,旨在在图表上显示支撑和阻力水平。这些水平基于马来西亚支撑和阻力理论,该理论将水平定义为特定的价格水平,而不是区域,这些价格水平是从线图的峰值和谷值中派生出来的。 特点: 三种类型的水平:A-Level,V-Level和间隙水平。 水平的新鲜度指示:新鲜水平比非新鲜水平更重要。新鲜水平指尚未被测试或已经被交易。 可自定义新鲜水平和非新鲜水平的颜色和样式。 仅显示新鲜水平或所有水平的选项。 可调整的回溯期和当前价格上下方水平的数量。 支持多时间框架。 用途: 交易者可以使用MSnR Lines来识别潜在的支撑和阻力水平以做出交易决策。新鲜水平被认为更为重要,并且可能提供更好的交易机会。此外,交易者还可以根据不同时间框架上的水平来进行多时间框架分析,以提高交易决策的准确性和可靠性。
Babel Assistant
Iurii Bazhanov
4.33 (9)
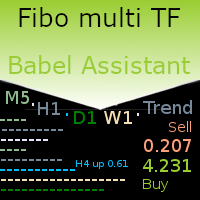
Babel assistant 1 MT5 净额制机器人 "Babel_assistant_1" 使用 ZigZag 指标在 M1、M5、M15、H1、H4、D1 和 W1 图表周期上生成斐波那契水平线,并计算买入和卖出趋势的强度。当突破指定的 4.925 趋势水平时,它会使用 "Lot for open a position" 设置开仓。然后,Babel 会在某些斐波那契水平上放置挂单,并设置指定的止损(Stop Loss)和止盈(Take Profit)线。屏幕上会显示当前持仓、交易和趋势的运行结果。 手动增加 0.02 手或更多的仓位会被机器人视为其自身挂单的触发。0.01 手的挂单或市价单在执行时只会改变持仓量。 免责声明: 以下材料仅供信息和教育参考。通过使用本产品(外汇市场自动交易程序 Babel assistant 1),您将完全承担未能实现预期利润的风险以及损失所有投资资金的风险。过去的业绩、测试和优化结果并不保证未来的收益。 Babel 机器人的参数: Indicator Mode Only true :机器人仅显示斐波那契水平和趋势概率,不执行交易。 false :
FREE
Win43 Scalper
Eadvisors Software Inc.
O novo s43 Scalper para Mini-Índice (WIN-IND) faz operações de curto prazo no timeframe 1min buscando pequenas variações do mercado, utiliza nova tecnologia de trade, os resultados no intraday são íncríveis, confira:      Após a instalação adicione no gráfico dos instrumentos win para visualizar os resultados no backteste. Recomendamos o timeframe de 1min.
Easy GOLD MT5
Franck Martin
3.87 (45)
Easy Gold is the latest addition to the BotGPT family. It is surprising and very powerful. It is ideal for beginners due to its simplicity.  There is absolutely nothing to do, it's 100% automated, simply indicate the percentage of risk you want to take per trade and the EA is ready. Whatever your capital, the EA takes care of everything. Optimized on (XAUUSD).  Unleash all the power with the professional version (AGI Gold) and its connection to the neural network, available in my store. My othe
FREE
SkyRebound
Sylvestre Setufa Djagbavi
Strategy Overview This robot follows a simple and structured technical logic: identify areas where the market shows excess, then enter when a coherent reversal signal begins to form.The goal is to capture clean movements without stacking positions or using risky methods.The robot uses no grid, no martingale, and never increases lot sizes. Buy Conditions A buy position can be opened only when multiple technical elements align: The market is above the Ichimoku cloud, indicating an underlying bull
[b]Titan Pro V7 Institutional Dashboard[/b] is an advanced quantitative HUD terminal engineered for MetaTrader 5, designed for institutional market analysis, quantitative prop-firm verification, and disciplined intraday execution. Unlike conventional single-formula indicators that suffer from lag and market regime shifts, Titan Pro V7 synthesizes a multi-strategy quantitative consensus model combining Trend Momentum, Volatility Breakout, Intraday VWAP, and Smart Money Concepts (SMC) into a sin
Kingtrend
Antonio Blazquez
KingTrend — Price Action Trend Analysis Tool KingTrend is a trend-following indicator based on long-standing price action principles involving Highs, Lows, Open, and Close. The logic behind this tool comes from concepts passed on to me by my mentor and translated into code for consistent structure recognition. Features: Identifies market structure using price action logic Detects trend direction and key turning points Marks Higher Highs, Lower Lows, and extensions Suitable for discretionary or
FiboChampion
Marius Ovidiu Sunzuiana
The Next Evolution in Fibonacci Intelligence FiboChampion  isn’t just another Fibonacci tool—it’s a paradigm shift in how traders interpret price action. Engineered for precision and adaptability, this advanced indicator fuses quantum-inspired logic , machine-learned pattern recognition , and non-linear Fibonacci geometry to uncover market turning points with uncanny accuracy. What Sets FiboChampion Apart: Non-Linear Fibonacci Mapping : Goes beyond static retracements by adapting to fractal m
Magic Zone
Donitrinugroho
MagicZone – Advanced Order Flow & Market Depth Indicator MagicZone   is a professional multi‑dimensional indicator that visualises   order book dynamics ,   bid/ask pressure ,   volume‑based support/resistance zones , and   real‑time DOM (Depth of Market)   levels – all in a clean, customisable sub‑window. Ideal for   scalpers ,   day traders , and   order flow analysts   who want to see exactly where large orders accumulate and how market participants drive price. Key Features 1. Order Book
GP Confluence Scanner MT5 Advanced Multi-Timeframe Market Structure & Confluence Analysis Don't get stopped out easily again! GP Confluence Scanner MT5 is an advanced technical analysis indicator designed to reveal important market levels, hidden support and resistance, and multiple technical confluences before entering a setup. Rather than relying on a single indicator, GP Confluence Scanner examines multiple technical factors to identify areas where significant market reactions may occur. Key
This Expert Advisor (EA) implements an automated trading strategy based on the ZigZag Indicator. Key features include: - Utilizes ZigZag indicator to identify potential price swings - Incorporates Fibonacci retracement levels for entry and exit signals - Designed for both short-term (scalping) and medium-term (swing) trading approaches Configurable risk management settings:   • Default lot size: 0.01 (adjustable)   • Stop Loss: 1.5% of current price   • Take Profit: 1.5 times the Stop Loss di
Indicator Gervasi
GERVASI ANTONINO
Operational Guide: ADX-Filtered Dynamic Analysis System This indicator is a high-precision quantitative tool designed for advanced market analysis. The core engine is based on the   synchronization between trend structural strength and momentum velocity , utilizing proprietary filters to eliminate market noise and false signals during consolidation phases. 1. Entry Logic (Arrow Signals) The algorithm continuously monitors price action for confirmed breakout points. The signals are split into tw
Manyal trading system, CovEchoTrend Robot, focuses on reliability and flexibility. By employing statistical analysis methods to study the relationships between the base indicator and market patterns, the system enables a deeper understanding of market processes. Intelligent pattern analysis: The application of statistical data processing helps identify key trend reversal points more accurately, signaling significant market shifts. Informed decision-making is based on the intersection of indicato
Somewhere over the rainbow It is a system that tries to operate the market from the exhaustion of the trend with a correction algorithm that tries to cut losses at the cost of increasing the margin This system makes all the adjustments automatically, analyzing the pair and the market to decide which is the most efficient step to reach your destination. Somewhere over the rainbow is a multiple trade and multi lot system(The maximum batch can be up to 5 times the initial batch distributed in mult
Autorithm AI
Zaha Feiz
3.72 (18)
Autorithm AI 技术说明   AUTORITHM 是一款为 MetaTrader 5 设计的先进人工智能交易系统,采用 10 个专用 AI 分析层 对市场进行全面分析。该智能交易顾问(EA)使用协同工作的高级 AI 算法来处理市场数据、识别交易机会,并以智能风险管理协议执行交易。 [guide line]     [SET FILES] 核心功能 该系统采用 10 个不同的 AI 分析层 协同分析市场状况并执行交易。每个 AI 层专注于市场分析的不同方面, 包括: • 技术分析 • 形态识别 • 价格行为分析 • 趋势分析 • 波动性分析 • 风险管理 • 新闻分析 • 时间分析 • 马丁格尔系统管理 • 最终决策制定 EA 包含可配置的基于时间的交易时段、新闻事件过滤以及 AI 驱动的波动性保护机制。 10 大 AI 智能分析层 1. 技术分析 AI 处理多种技术指标和振荡器,通过高级形态识别算法识别市场动能、超买/超卖状态及潜在反转点。 2. 形态识别 AI 识别和分析图表形态、K线形态及价格结构,基于历史市场数据的机器学习算法进行训练。 3. 价格行为分析 AI 在不
My Pivot
Ashok Kumar Singha
My Pivot is an Indicator based on Pivot Lines and Support-Resistance zones. This Indicator will Plot 11 SR zones including Pivot Line which will definitely help you to understand the exact SR zones of the Market. Steps to Setup the Indicator: Install the Custom Indicator; Set all the Lines Color, Width and Styles; Set visualization to All Timeframe; and DONE It can be used for: All Pairs: Forex, Cryptocurrencies, Metals, Stocks, Indices.  All Timeframe All Brokers All type of Trading S
LT Support Resistance - 100% 自动识别支撑位与阻力位 您是否厌倦了在手动绘制支撑线和阻力线上浪费时间?或者因为总是错过某个关键位置而感到沮丧?LT Support Resistance 的开发正是为了消除这一繁琐的工作,它能同时在多个时间周期(Timeframe)内,自动识别并标注出对您交易资产最具价值的区域。 == 关键位置的智能自动化 == 相比手动绘制线条(既主观又耗时),该指标能够通过分析历史价格,识别出显著的反转点,并绘制出价格“真实”尊重的支撑线与阻力线。为您带来更客观、更高效且基于数据支撑的盘面分析。 == 核心特性 == 100% 自动检测: 无需手动分析,自动识别支撑/阻力 多时间周期 (MTF): 直接在 M5 图表上直观查看 H1、H4、D1、W1 的关键位置 智能警报: 当价格触及、突破或在某一水平位盘整时发送通知 动态区域: 创建的是“区域”而非简单的“线条”,更加贴合价格行为(Price Action)的真实市场 兼容任何资产: 外汇、指数、股票、加密货币、大宗商品 视觉完全自定义: 颜色、样式、粗细、透明度均可自由配置 == 运
Account Risk Hedge Bot                                                                                  ...hedge your trades with confidence. Safeguard Your Investments with Account Risk Hedge Bot, stay ahead of market volatility with our cutting-edge risk management solution. Account Risk Hedge Bot is designed to safeguard your investments with automated precision, helping you navigate market uncertainty, ensuring you minimize losses and maximize returns. Note: Account Risk Hedge Bot does
AUTO FIBONACCI MULTI-TIMEFRAME TOOLKIT Technical analysis tool that automatically draws Fibonacci levels for 4H, Daily, Weekly, and Monthly sessions. AUTOMATIC FIBONACCI RETRACEMENTS (7 CLASSIC LEVELS): - 0.0% (Previous session Low - support level) - 23.6% (Fibonacci Golden Ratio - early entry level) - 38.2% (Strong retracement level) - 50.0% (Key pivot level highlighted in YELLOW - market equilibrium) - 61.8% (Main Golden Ratio - critical decision level) - 78.6% (Deep retracement level) - 100.0
Apex Thrust Pro 专业级趋势突破与金字塔加仓量化系统 Apex Thrust Pro   是一款专为追求极致趋势捕捉的交易者设计的自动化交易系统(EA)。它结合了经典的波动率突破逻辑与现代量化加仓算法,旨在单边行情中通过“金字塔式”增仓实现利润最大化,同时利用独创的“利润档位(Profit Gears)”技术严控回撤。 核心交易逻辑 动态波动率突破 :系统通过分析过去 N 小时的市场波动率(ATR)和价格区间,自动计算出当日的关键压力与支撑位。只有当价格以强劲动能突破该区间时,才会触发首笔交易。 智能金字塔加仓 (Pyramid Scaling) :不同于传统的马丁格尔(逆势加仓),Apex Thrust 只在头寸盈利且趋势确认延续时才进行加仓。通过分批入场,在风险可控的前提下大幅提升盈利潜力。 利润档位追踪技术 (Profit Gears) : Gear 1 (保本档) :当利润达到 1 倍 ATR 时,自动将止损移至保本位,锁定胜局。 Gear 2 (追踪档) :进入趋势主升浪后,启动高频追踪止损,确保在趋势反转前带走最大化利润。 ️ 技术优势 Net
Easy Support and Resistance
Danny Giovanni Romero Lozano
EASY SUPPORT AND RESISTANCE Visualize support and resistance levels across multiple timeframes with dynamic color-coded lines Overview This powerful MT5 indicator automatically identifies and highlights key price levels by drawing rectangles on the last closed candle and its first opposite-colored candle across six different timeframes (M15, M30, H1, H2, H4, D1). The lines dynamically change color based on price action confirmation, transforming into support or resistance levels when validated
FREE
Tma Poc Gold
Ignacio Agustin Mene Franco
POC + TMA SCALPER GOLD - Expert Advisor Professional DESCRIPTION: Automated trading system designed specifically for XAU/USD, combining Point of Control (POC) with Triangular Moving Average (TMA) to identify high-volume and trending zones. It uses advanced risk management with dynamic trailing stops and an intelligent grid system. TECHNICA
If you wish to draw Support and Resistance lines, view: daily market opening, classical pivot levels, Fibonacci pivot levels, trend lines, Fibonacci levels, the remaining time to candle closing, and current spread. If you seek to place your orders with the exact lot that meets your desired stop loss risk. If you wish to do all this and more with just one click, then this is the perfect tool to use. This tool will allow you to feel more relaxed when deciding to open orders, as well as predicting
FiboFVG Pro Concept
Rikza Fauzan Nurfadilah
FVG Fib Pro combines Fair Value Gaps with Fibonacci retracement across two timeframes. It first reads the market structure on a higher timeframe, then waits for price to pull back into the discount or premium zone and fill a gap on your chart timeframe. Signals appear only when the pullback, the gap, and the higher timeframe context agree. HOW THE SIGNALS WORK - Higher timeframe structure: swing highs and lows are confirmed only after the required number of candles have closed, so the structur
Wick Map
Anna Makwana
Wick Map 显示您的品种上长影线出现在哪里:每根长上影线和长下影线上都有一个圆点,一个按一天中的小时划分影线的影线时钟,以及今天的长影线与相同时段通常数量的对比。在 EURUSD M15 上,经纪商时间 00:00 开盘的K线中有 32% 带有长下影线,而所有时段为 17%。在 US500 D1 上,长下影线出现在 19.8% 的交易日,长上影线出现在 11.8% 的交易日。只使用已收盘的K线,因此从不重绘。每次发布前,每个数字都会与一个独立的实现进行核对。 功能 价格图表上,每根长影线的末端都标有一个小圆点:K线上方的粉色圆点表示长上影线,下方的青色圆点表示长下影线。左下角的影线时钟为一天中的每个小时(经纪商时间)显示一列:线上方的粉色柱是该小时内带长上影线的K线所占比例,线下方的青色柱是带长下影线的K线所占比例,当前小时带有下划线。在 H2 到 D1 图表上,时钟改为每个工作日一列。一个小面板显示长上影线和长下影线在全部K线中以及在当前小时的比例、各自的高峰时段、今天到目前为止的长影线数量与相同时段通常数量的对比,以及典型影线占K线波幅的比例。 工作原理 当影线覆盖K线从最高
FREE
RBM Flow Structure PRO
Renato Brendim Medici
RBM Flow Structure PRO Advanced Capital Flow and Market Structure Analysis for MetaTrader 5 Five integrated modules. One tool. A more complete market view. RBM Flow Structure PRO is a multifunctional indicator designed for traders who want to gain a deeper understanding of market behavior. It combines capital flow analysis, price structure, supply and demand zones, and key trading levels on a single chart. With five independent and configurable modules, the indicator helps organize your analysis
FREE
SPECIAL LAUNCH OFFER: $30 (1-Month Rent) Limited time offer to build our community and gather feedback! AmbM GOLD Institutional Scalper A high-precision M5 algorithm for XAUUSD (Gold) , engineered to trade exclusively at Institutional Liquidity Levels ($5/$10 psychological marks). PERFORMANCE DATA (BUY ONLY) • Win Rate: 87.09%. • Safe Growth: +$4,113 profit on $10k (13.75% Max Drawdown). • Extreme Stress Test: Successfully generated +$22,997 in a 5-year stress test (2020-2026), proving
该产品的买家也购买
Azimuth Pro
Ottaviano De Cicco
5 (7)
Azimuth Pro V2:MT5合成分形结构分析与确认入场 概述 Azimuth Pro 是 Merkava Labs 推出的多层级波段结构指标。四层嵌套波段层级、锚定波段的VWAP、ABC形态识别、三时间框架结构过滤以及收盘确认入场——一个图表,一个从微观波段到宏观周期的完整工作流程。 这不是盲目的信号产品。它是一个以结构为先的工作流程,专为重视位置、背景和时机的交易者打造。 1. V2的变化 合成多时间框架引擎 高时间框架分析从零开始重建,采用与Meridian Pro相同的专有合成架构。更清晰的HTF背景、稳定的实时行为、无经典MTF同步问题。合成引擎还解锁了 固定比率时间框架级联 (x2、x3、x4、x6)——不再在经纪商的固定时间框架之间任意跳转,您可以按图表时间框架的固定倍数分析结构,在每个尺度上保持相同的分形关系。 确认入场箭头 作为稳定且可恢复的执行层而设计的收盘确认箭头。当ABC设置形成且自适应确认逻辑在收盘K线上验证方向时,箭头会写入下一根K线的开盘,并设计为在刷新、切换时间框架、重新加载指标或重启终端等正常图表生命周期事件后仍能一致恢复。 这些不是独立的买
SQN Max indicator for MT5 by ITC
Renaud Herve Francois Candel
Sqn Max Indicator Sqn Max is an exclusive indicator to trade the market with high effectiveness. The indicator is based on price action, volatility and trend. This indicator is as simple as possible but not too simple. The indicator can generate alerts to ease the trading process. You don't have to stay all day in front of your screen. The indicator can be used with any class of assets and with any time frame. It is possible to achieve better results trading our list of selected assets. We achi
Boba Analysis Suite
Trade Ready Solutions LLC
5 (2)
Boba Analysis Suite Boba Analysis Suite 是一款适用于 MetaTrader 5 的分析指标。它将市场结构、关键价格区域和整体市场背景整合到同一图表视图中。 该指标源于交易及交易教学的实践经验,旨在帮助用户建立有条理的分析流程:评估市场方向、识别重要价位,并结合多个时间周期进行分析。 结合市场背景进行分析 单个信号的意义取决于市场背景。Boba Analysis Suite 帮助用户将当前图表状况与更大范围的市场结构相结合,并根据预先制定的规则评估交易思路。 分析功能包括: **趋势与市场结构:**评估市场方向及相关结构背景。 **关键价格区域与价位:**在图表上直观标示值得进一步分析的重要区域。 **多时间周期:**整合不同时间周期的信息,评估整体市场背景。 **可视化分析流程:**直接在图表上查看分析信息。 自主做出交易决策 Boba Analysis Suite 适合希望系统分析图表并结合多个时间周期信息的交易者。 该指标用于辅助分析,不会开仓或平仓,也不能替代交易策略或风险管理。每一笔交易的决策均由用户自行做出。 使用与许可 平台:Meta
ScalpPoint
Temirlan Kdyrkhan
ScalpPoint is a powerful trading companion designed to generate high-probability entry signals with dynamic TP/SL/DP levels based on volatility. Built-in performance tracking shows win/loss stats, PP1/PP2 hits, and success rates — all updated live. Key Features: Buy/Sell signals with adaptive volatility bands Real-time TP/SL/DP levels based on ATR Built-in MA Filter with optional ATR/StdDev volatility Performance stats panel (Success, Profit/Loss, PP1/PP2) Alerts via popup, sound, push, or emai
ARIPoint
Temirlan Kdyrkhan
1 (4)
ARIPoint is a powerful trading companion designed to generate high-probability entry signals with dynamic TP/SL/DP levels based on volatility. Built-in performance tracking shows win/loss stats, PP1/PP2 hits, and success rates all updated live. Key Features: Buy/Sell signals with adaptive volatility bands Real-time TP/SL/DP levels based on ATR Built-in MA Filter with optional ATR/StdDev volatility Performance stats panel (Success, Profit/Loss, PP1/PP2) Alerts via popup, sound, push, or email Cu
Zain Gold Scalping
Ahmed Gamal Abdel Nasser Mohamed
A complete price-action analysis tool built around dual independent entry logic, each confirmed against a volatility band, combined with a configurable set of nine optional confirmation filters that let you shape exactly how conservative or aggressive the tool's signals behave. Core Strategy Two independent entry setups, each triggering only when price moves outside a dynamic volatility band — giving two distinct ways to spot potential reversal points, which can be used together or separately.
SMC Sniper Pro MT5
Jordan Steven R Machell
SMC Sniper Pro MT5 SMC Sniper Pro by QuantFlow Labs is a chart indicator for liquidity-based intraday analysis. It combines session ranges, tracked liquidity sweeps and three selectable entry models in one configurable workspace. It displays setup context and entry references; it does not open, manage or close trades. Three selectable entry models Model 1 - Inverse Fair Value Gap breakout: after an eligible liquidity sweep, the indicator waits for a confirmed close through the relevant fair valu
VTrende Pro
Andrii Diachenko
5 (1)
VTrende Pro - MTF indicator for trend trading with a display panel for MT5 *** Videos can be translated into any language using subtitles (video language - Russian) Although the signals of the VTrende Pro indicator can be used as signals of a full-fledged trading system, it is recommended to use them in conjunction with the Bill Williams TS. VTrende Pro is an extended version of the VTrende indicator. Difference between Pro version and VTrende: - Time zones - Signal V - signal 1-2 waves -    S
QNC Scalper
Yordiana Enggelina Seko
Here is a professional and engaging description for the Indikator QNC Scalper tool in English, tailored for traders and platforms: Indikator QNC Scalper Unlock precision trading in fast-paced markets with the Indikator QNC Scalper —an advanced technical analysis tool engineered specifically for scalpers and day traders. Whether you are trading forex, crypto, or indices, this indicator cuts through market noise to deliver clear, high-probability entry and exit signals. Key Features Real-Time M
OrderFlow Absorption – 專業級MT5買賣差與吸收訊號指標 釋放真正訂單流分析的力量,OrderFlow Absorption 是MetaTrader 5上最強大的買賣差(Delta)直方圖與吸收訊號指標。專為想看清每一個價格波動背後真相的交易者設計,這個工具揭示了隱藏的買賣壓力與推動市場的吸收事件。 功能特色 買賣差直方圖視覺化:   以清晰的色彩直方圖即時顯示買方與賣方壓力。 吸收訊號偵測:   先進邏輯自動辨識多空吸收事件,及早預警潛在反轉。 圖表標記:   吸收訊號直接標示於主圖表,方便視覺辨識。 彈出式警報:   新吸收訊號出現時即時通知。 自訂門檻:   過濾弱訊號,專注高勝率機會。 資源管理:   高效運算,適用於大型圖表也能流暢運行。 全品種兼容:   適用於任何商品與週期,包括外匯、指數、商品等。 簡易整合:   參數簡單,快速上手與調整。 OrderFlow Absorption 的邏輯說明 OrderFlow Absorption 採用專利演算法,能在沒有完整Tick數據的情況下,估算每根K棒的買賣壓力(Delta)。它分析成交量、價格行為、K
TrendMaestro5
Stefano Frisetti
note: this indicator is for METATRADER4, if you want the version for METATRADER5 this is the link:  https://www.mql5.com/it/market/product/108106 TRENDMAESTRO ver 2.5 TRENDMAESTRO recognizes a new TREND from the start, he never makes mistakes. The certainty of identifying a new TREND is priceless. DESCRIPTION TRENDMAESTRO identifies a new TREND in the bud, this indicator examines the volatility, volumes and momentum to identify the moment in which there is an explosion of one or more of these da
OmniSync Projection
Antonio-alin Teculescu
5 (1)
Chronos Fractal Engine is an innovative price projection indicator for MetaTrader 5, designed to transform your technical analysis by intelligently identifying and projecting historical price patterns. Built upon an advanced correlation algorithm and the fractal principles of the market, this powerful tool visualizes potential future price movements, giving you a unique edge in your trading decisions. What is Chronos Fractal Engine? At its core, the Chronos Fractal Engine employs a sophisticat
FX-AIEA 供给需求区智能识别指标(Supply and Demand Indicators MT5)——技术原理与参数讨论 版本:2.51 | 适用平台:MetaTrader 5 引言 供给需求区是机构订单流的重要表现形式,相比传统支撑阻力位能更直接地反映买卖力量的失衡。本指标尝试通过算法自动识别高概率供需区域,以减少手动绘制的耗时与主观性。其核心逻辑基于自适应 ZigZag 算法,提取波峰波谷并生成区域标识 。 核心技术特点 全自动绘制机制 :基于改良版 ZigZag 动态提取有效极值,标记潜在供给区与需求区。指标遵循 MQL5 原生   prev_calculated   机制,在新 K 线生成时自动重绘,支持跨周期强制计算( Forced_TimeFrame   参数)。 区域边界模式 :支持宽带(覆盖K线影线极值)与窄带(仅覆盖实体)两种模式,用户可通过   use_narrow_bands   参数切换,以适应不同交易风格。 滤噪算法 :启用   kill_retouch   后,自动剔除被后续行情反复轻触但未有效突破的弱势区域,以提升信号有效性。 视觉与性能 :支持自
Orderflow Big Trade 透過估算 Delta 熱力圖,揭示 K 線內部的隱藏壓力 您是否錯過了隱藏在標準 K 線 內部 的關鍵交易活動? Orderflow Big Trade 採用先進的高低價位與收盤價加權算法, 估算不同聚合分組價位上的買賣壓力。 它不單單依賴原始成交量, 而是將價格行為動態轉化為清晰直觀的 Delta 熱力圖——幫助您即時識別機構吸收、 突破動能、 被套牢的交易者以及關鍵價位的接受與拒絕。 [ 免費下載 Demo 試用版 ] 立即在您的實時圖表上測試完整功能。在決定購買之前,您可以自由調整參數、評估視覺清晰度,並體驗它如何完美融入您的交易策略中。 核心交易優勢 棒內 Delta 估算: 解析 K 線的高低價範圍與收盤位置, 推算特定價格聚類區間的買壓與賣壓。 收盤價加權技術: 智能提高靠近 K 線收盤價區域的 Delta 權重, 更準確地反映 K 線尾聲的市場控制力。 動能與吸收偵測: 快速判斷激進的市價單是在推動價格突破, 還是撞上了機構的被動掛單流(吸收)。 動態氣泡視覺化: 透過自訂顏色(藍色代表買
Zain Gold ScalpingV5
Ahmed Gamal Abdel Nasser Mohamed
Zain Gold Scalping V5 is a technical analysis indicator for MetaTrader 5 designed for Forex and Gold markets. It provides chart-based market information, trend analysis, signal conditions, and an on-screen dashboard to help traders analyze price movement across multiple timeframes. Main Features The indicator supports multiple timeframes, including M1, M5, M15, M30, H1 and higher timeframes. It can be used with Gold (XAUUSD), Forex currency pairs, indices and other supported instruments. The in
The indicator is designed to close positions on the market in time. For example: to take profits ahead of schedule if the price has not reached TakeProfit, and the market is turning around. The indicator analyzes the momentum, not the trend. He does not give any information about the trend. The indicator is well suited for finding divergence. The Ershov 38 Parrots indicator dynamically adjusts to the market and detects price movement impulses of medium and high amplitude. It almost does not rea
First time on MetaTrader, introducing IQ Star Lines, an original Vedic Astrology Based Intraday Trading Indicator. We don't offer free or bonus indicators in exchange of reviews from you. You won't need any free products with this indicator to make it work. ;) Enjoy! Welcome to the new and updated  IQ Star Lines , the ultimate fusion of ancient planetary cycles and modern quantitative trading, published for the first time on Metatrader. This is an indicator built by the developer, who has spent
AriX
Temirlan Kdyrkhan
1 (4)
AriX Indicator for MT5 A powerful trend-following and signal-evaluation tool AriX is a custom MT5 indicator that combines Moving Averages and ATR-based risk/reward logic to generate clear buy/sell signals. It visualizes dynamic SL/TP levels, evaluates past trade outcomes, and displays win/loss statistics in a clean on-chart panel. Key features include: Buy/Sell signals based on MA crossovers ATR-based SL/TP1/TP2/TP3 levels with visual lines and labels Signal outcome tracking with real-time stat
Meravith Scanner
Ivan Stefanov
5 (3)
MERAVITH SCANNER 是一款适用于 MetaTrader 5 的专业金融市场指标,将多种分析工具整合为一个统一的系统。它基于专有的成交量加权平均价格(VWAP)方法自动完成所有计算,完全消除主观判断。 该指标适用于所有资产类别(外汇、股票、指数、大宗商品、加密货币)以及从 M1 到 Monthly 的所有时间周期。其核心原理是价格跟随成交量。MERAVITH 识别机构资金成交量的集中区域,并从该集中区域中推导出数学上精确的价格水平。它不预测,不推测。它只计算。 使用 MERAVITH SCANNER,您可以在 2–3 分钟内扫描全部 28 个主要外汇货币对的所有时间周期。您也可以扫描任何您选择的市场——例如,大约 100 只股票约需 10 分钟。 该指标计算耗尽水平、平衡线、偏差、统计水平以及目标投射。 图表元素 Origin Point 标记所有计算的起始位置。指标会自动将其放置在最佳位置。红色标签(TOP)表示市场高点并带有看跌倾向。绿色标签(BOTTOM)表示市场低点并带有看涨倾向。 Sentiment Line 是一条动态曲线,反映基于成交量加权计算得出的市场情绪。
Boom & Crash & PainX & GainX Ultimate Spike Detector Trade Spikes With Confidence — Not Guesswork Catching spikes should be one of the most profitable strategies in synthetic markets. But for most traders, it becomes one of the most frustrating. You enter too early… price goes against you. You wait for a spike… it never comes. You finally catch one… but don’t know whether to hold or close. You make profit… then give it all back because there’s no exit plan. This is exactly the problem the Ultim
一句话理解 这是一个 二合一的智能指示器 ——把 RSI 和 MACD 两位“专家”的意见打包成一个简单的结论:出现箭头,就行动;没有箭头,就等待。 而且箭头 不会重绘 ,收盘后是什么样,永远就是什么样。 它解决了什么问题 很多交易者同时看 RSI(判断动量和超买超卖)和 MACD(判断趋势方向),但两者经常给出矛盾信号。 这个指示器的做法是: 只有两人同时同意 ,才发出信号。这就过滤掉了大量假信号和模糊时段。 你实际看到的东西 独立的指示器窗口(不遮住 K 线图) 清晰的 买入箭头 和 卖出箭头 放大版的 MACD 柱状图(更容易看清动量变化) RSI 和 MACD 的线依然在,但你的注意力只需放在箭头上 谁适合用 新手 :不用学两个指标如何配合,跟着箭头做即可 老手 :节省时间,快速过滤噪音,且不重绘的特性让回测结果可信 所有讨厌信号闪烁的人 为什么它不重绘 因为它的判断逻辑基于 完整收盘后的价格数据 。信号只有在满足条件的那一刻才会固定下来,之后不会因为后续 K 线的变化而修改之前的箭头。 这意味着你可以放心做回测,也能在实盘中信任你看到的每一个信号。 底层特点(不复杂地说) 它
Meravith MT5
Ivan Stefanov
5 (3)
MERAVITH 是一款适用于 MetaTrader 5 的多周期成交量与流动性指标,它在每一个时间周期上显示趋势、支撑与阻力区域、入场、目标和止损。它为您提供完整的市场流动性地图,一个对冲基金风格的流动性工具,并用专有的成交量加权平均价格方法自动完成全部计算,因此没有主观解读。 适用于外汇、黄金(XAUUSD)、指数和加密货币,适用于所有时间周期。 购买后赠送:一套关于如何用 MERAVITH 交易的视频课程。购买后请给我发消息。 MERAVITH 的功能 分析所有时间周期,并显示每个周期上正在生效的趋势。 标记流动性区域(Volume Equilibrium),即多头与空头成交量相等的位置。 将所有时间周期的流动性水平直接显示在您的图表上。 写出市场的文字分析供您参考。 根据当前趋势计算入场、目标、支撑位和止损。 计算您交易的风险回报比。 按您的账户余额计算仓位大小,并估算潜在利润。 在市场出现重要变化时提醒您:警报、电子邮件和推送到手机的通知。 主要线条 Bullish / Bearish Volume Exhaustion 线:目标位。 趋势线:随趋势改变颜色(多头或空头),显
Cycles Plotter
Edoardo Centorame
Cycles Plotter 带移动平均线和开始日期的可自定义周期指标 Cycles Plotter 是一种高级技术指标,可根据用户输入绘制两个完全可自定义的正弦周期。它不会自动生成周期:所有周期都完全根据用户设置的参数计算,为交易者提供一种视觉工具,用于研究价格波动和潜在的趋势变化,而不产生自动信号或预测。 关键点: 用户定义的周期:周期 1 P1 和 2 P2 完全由用户配置。可以设置周期长度、幅度、移动平均线以及精确的开始日期和时间。如果用户未输入参数,则不会绘制任何周期。 幅度控制:每个周期可以具有不同的幅度,从而可以相对于参考移动平均线调整波动的高度。 趋势检测:快速和慢速移动平均线表示周期的方向: Fast MA 大于 Slow MA 上涨阶段 绿色 lime Fast MA 小于 Slow MA 下跌阶段 magenta 红色 Fast MA 约等于 Slow MA 横向阶段 flat 橙色 蓝色 周期绘图:每个周期有三条独立的线: 上涨阶段 绿色 lime 下跌阶段 magenta 红色 横向阶段 flat 橙色 蓝色 可自定义的开始日期和时间:可以定义每个周期开始绘制
Volume Arrow Signal Product Description Volume Arrow Signal is a smart trading indicator designed to help traders identify potential buy and sell opportunities using price action, volume behavior, and directional arrow signals. The indicator places clear arrows directly on the chart, making it easy to spot possible market reversals, trend continuations, and entry opportunities without spending hours analyzing charts manually. Whether you are trading Gold (XAUUSD) , Forex pairs, Indices, or Crypt
MasterTrend
Temirlan Kdyrkhan
MasterTrend Indicator for MT5 A powerful trend-following and signal-evaluation tool MasterTrend   is a custom MT5 indicator that combines Moving Averages and ATR-based risk/reward logic to generate clear buy/sell signals. It visualizes dynamic SL/TP levels, evaluates past trade outcomes, and displays win/loss statistics in a clean on-chart panel. Key features include: Buy/Sell signals based on MA crossovers ATR-based SL/TP1/TP2/TP3 levels with visual lines and labels Signal outcome tracking wit
SMC Sweep Fvg MT5
Daniil Sleptsov
5 (1)
SMC Sweep Fvg MT5 — 像聪明钱一样看市场,就在你的图表上 你一定有过这种感觉:价格扫掉你的止损,随后反转,并正好走到你预期的方向。方向你是对的,错的只是入场。 这个指标就是为了让这类情况少发生。它接手分析中最繁重的部分——图表标注,把真正重要的留给你:决策。 你会在图表上看到什么 市场结构 — 真实的结构高点与低点,带有 HH / HL / LH / LL 标记和水平线。趋势一目了然,无需猜测。 失衡区(FVG) — 价格推进过快、之后常会回补的区域。未回补与已回补的区域用不同颜色显示。 流动性行为 — 指标跟踪市场在反转前扫过关键水平的时刻。 现成的交易布局 — 入场箭头、止损位与盈利目标。全部画好,无需心算。 趋势过滤 — 更高周期的趋势线,帮你站在主趋势一侧。 指标关注流动性扫荡、失衡形成与结构状态——并只突出这些因素同时对齐的情形。 统计面板——回应每一个疑虑 你不必只听别人说。图表上的内置面板会按所选历史显示: 分析周期(K线数量); 检测到的情形总数; 多少到达目标、多少触及止损; 仍在运行中的数量; 以点数计的净结果。 切换品种——面板重
Gold Xausd Hunter
Metin Erkamoglu
5 (2)
MATADOR GOLD XAUUSD M5 Scalp Signals for MT5 MATADOR GOLD is a decision-support indicator for MetaTrader 5, designed for traders who analyze short-term Gold movement on the M5 timeframe. The indicator does not open, close, or manage trades automatically. It provides buy and sell signal guidance so the user can make their own trading decisions according to their risk plan, broker conditions, and trade management rules. Main purpose MATADOR GOLD is built to help traders avoid noisy signal flow and
KenKem Master Volume Profiler - Brief Introduction A Display-only volume-profile cockpit for XAUUSD, BTCUSD and other liquid symbols. Draws profile structure, multi-timeframe flow, EMA trend and study-only setup markers. Places no orders. Not a signal service.  It maps where the market has actually traded and reads recent order flow, so you can see structure and lean at a glance.  What it shows: Master and local volume profiles (POC and value-area high/low) - the price shelves that matter. A liv
历史相似性匹配指标  概述 历史相似性匹配器(Historical Similarity Matcher)是 MetaTrader 5 的技术分析指标。它扫描历史价格数据,寻找与用户在图表上选定的参考时期具有统计相似性的片段。当找到匹配时,指标会显示历史模式,并根据这些历史片段的后续走势绘制潜在未来价格走势的投影。 本指标仅供教育和分析用途,不构成财务、投资或交易建议。不保证结果或盈利能力。过去表现不代表未来结果。交易存在重大损失风险。用户对自己的交易决策和结果负全责。  功能特点 - 识别与选定参考时期具有相关性的历史价格片段 - 支持正向和反向模式匹配 - 显示多个匹配的历史模式(数量可配置) - 为每个匹配绘制基于历史延续的独立投影线 - 可选 OpenCL 支持,在兼容硬件上加速计算(不支持时回退到 CPU) - 适用于任何时间周期和交易品种 - 允许在不同于当前图表的时间周期上进行扫描 - 在图表上提供启动扫描和导出结果的按钮 - 导出每个匹配的截图以及包含匹配详情的 CSV 文件  工作原理 1. 用户通过在图表上放置两条垂直线或在输入参数中设置日期来选择
作者的更多信息
Borsa Trend Fusion — Four EMA + RSI + CCI Signals Borsa Trend Fusion is a MetaTrader 5 technical indicator combining four exponential moving averages (50, 120, 250, 600) with RSI(2) and CCI(3) momentum extremes. Features Trend-aligned BUY and SELL signals on fully closed candles. Trend-colored candlesticks and four configurable EMA lines. Clear status panel with trend, RSI, CCI and signal-condition indicators. Optional slope and minimum EMA separation filters. Configurable oscillator matching wi
筛选:
无评论
回复评论