TrendMatrix MTF
- 指标
- 版本: 1.33
- 更新: 18 九月 2026
- 激活: 5

TrendMatrix MTF See the trend across multiple timeframes at a glance.
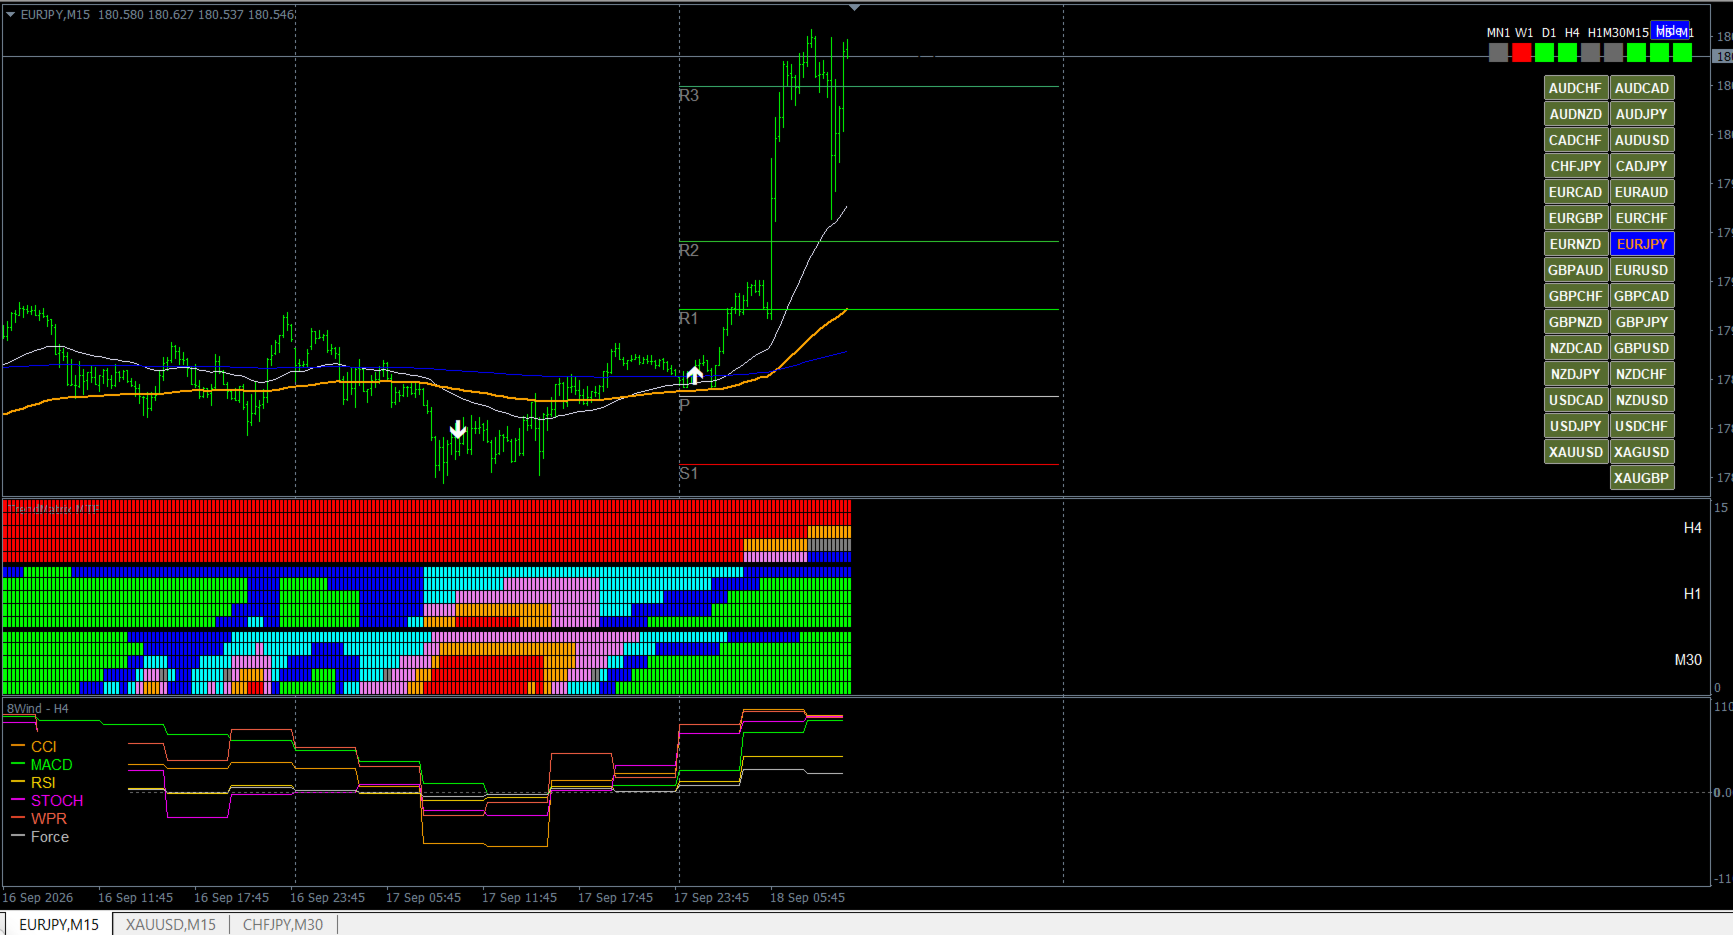
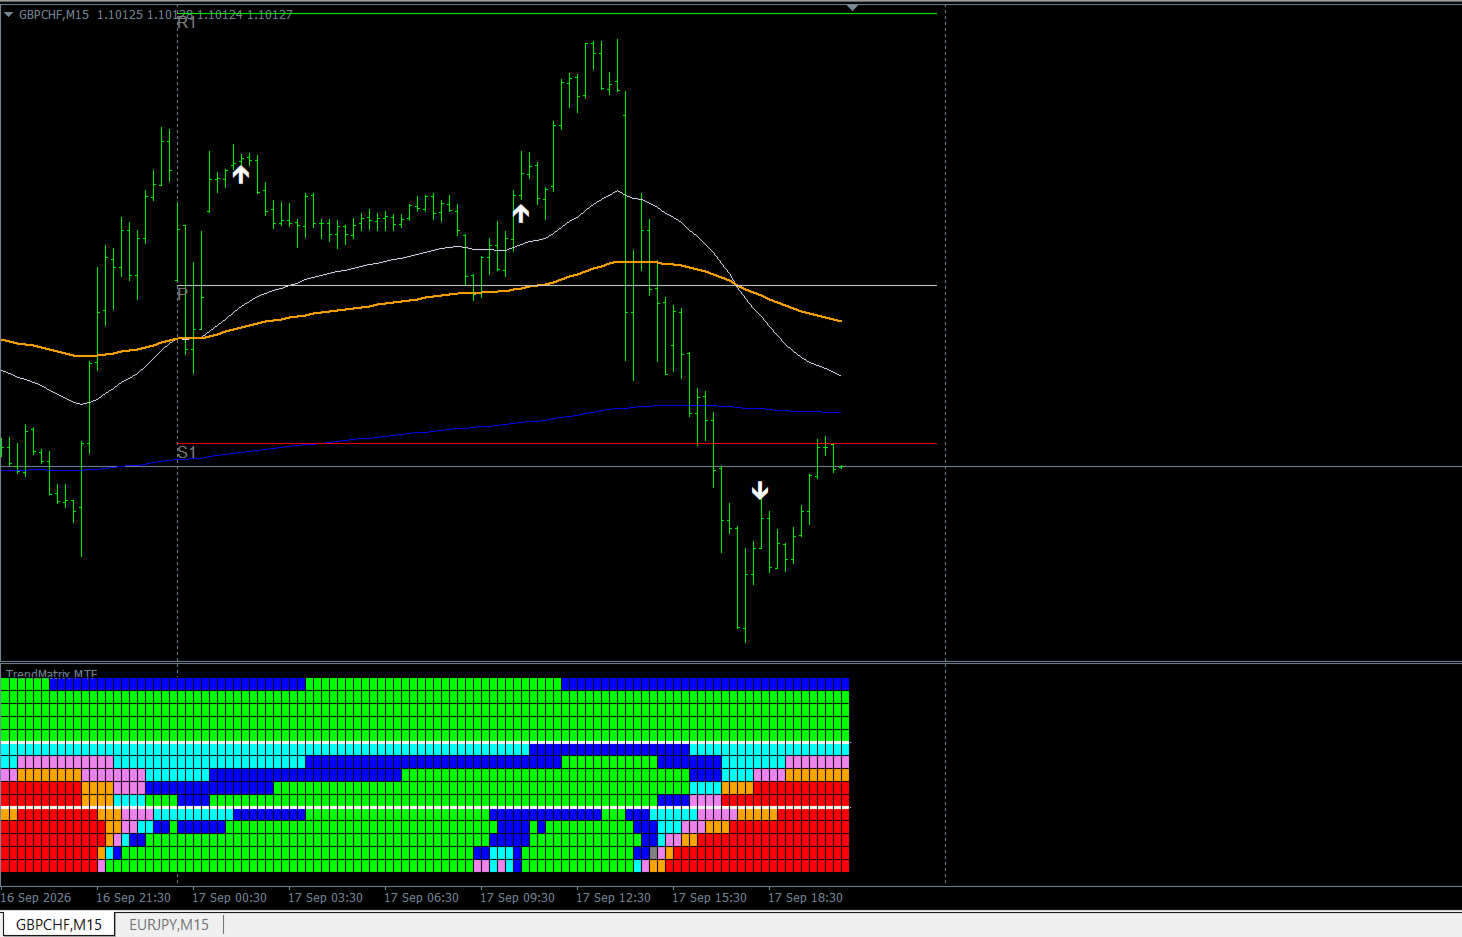
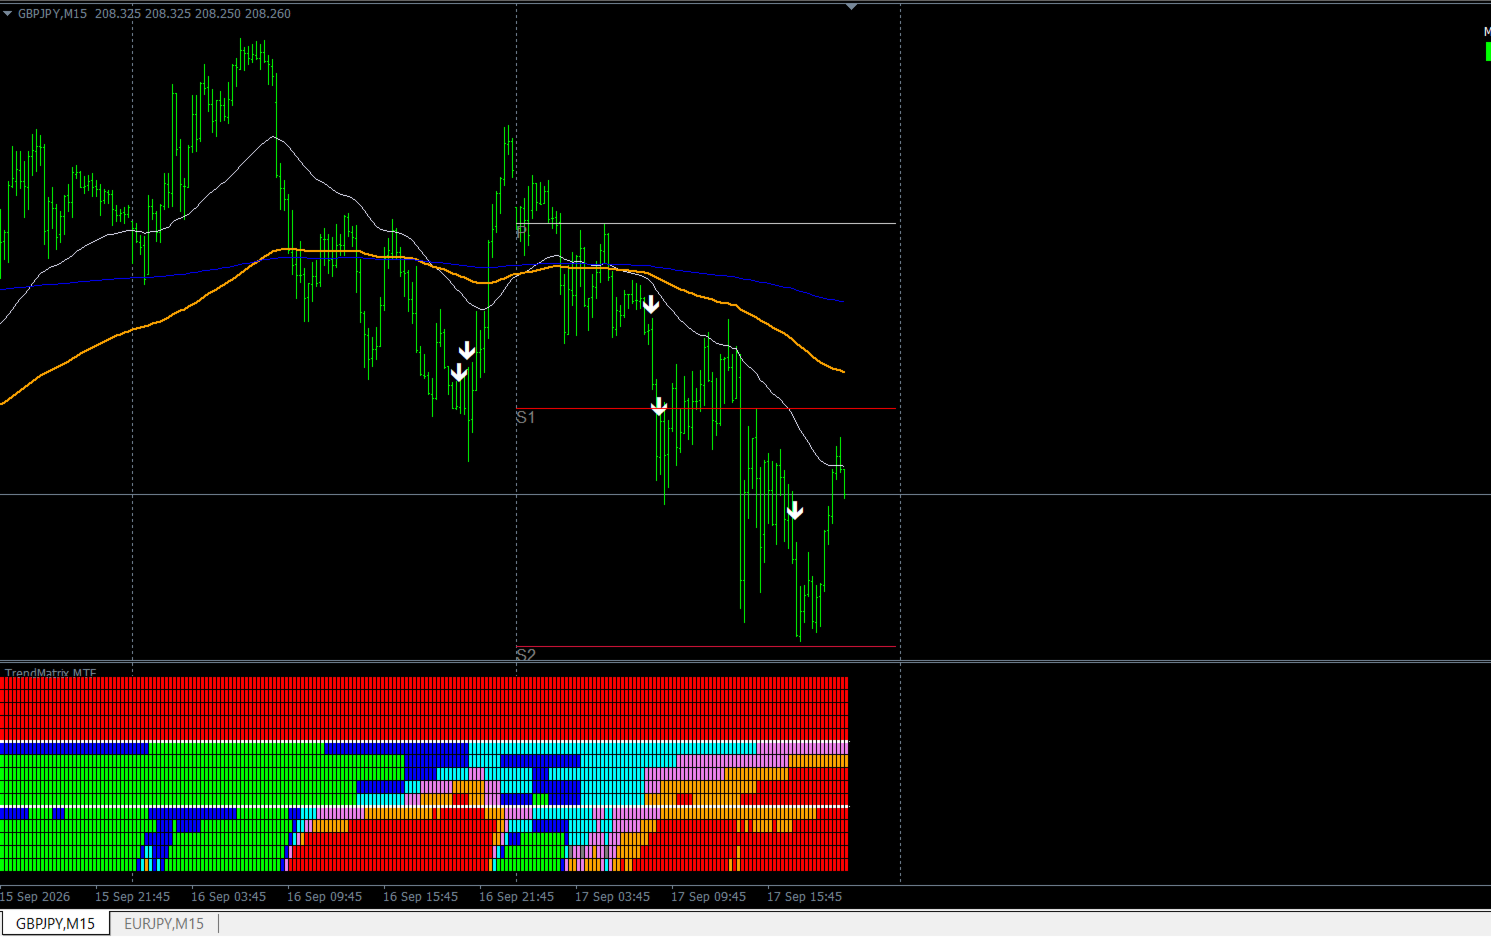
TrendMatrix MTF is a visual multi-timeframe trend-strength indicator for MetaTrader 4. It brings up to 15 trend readings into one compact color matrix, helping you see when different timeframes agree — or when they are moving in opposite directions.
Instead of constantly switching between M15, H1 and H4 charts, TrendMatrix MTF lets you monitor the broader trend structure from a single chart.
3 Timeframes × 5 Trend Measurements = 15 Trend Readings
Each selected timeframe is analyzed using five EMA-based trend measurements. The distance between fast and slow EMAs is normalized with ATR, allowing the indicator to classify different levels of bullish and bearish strength.
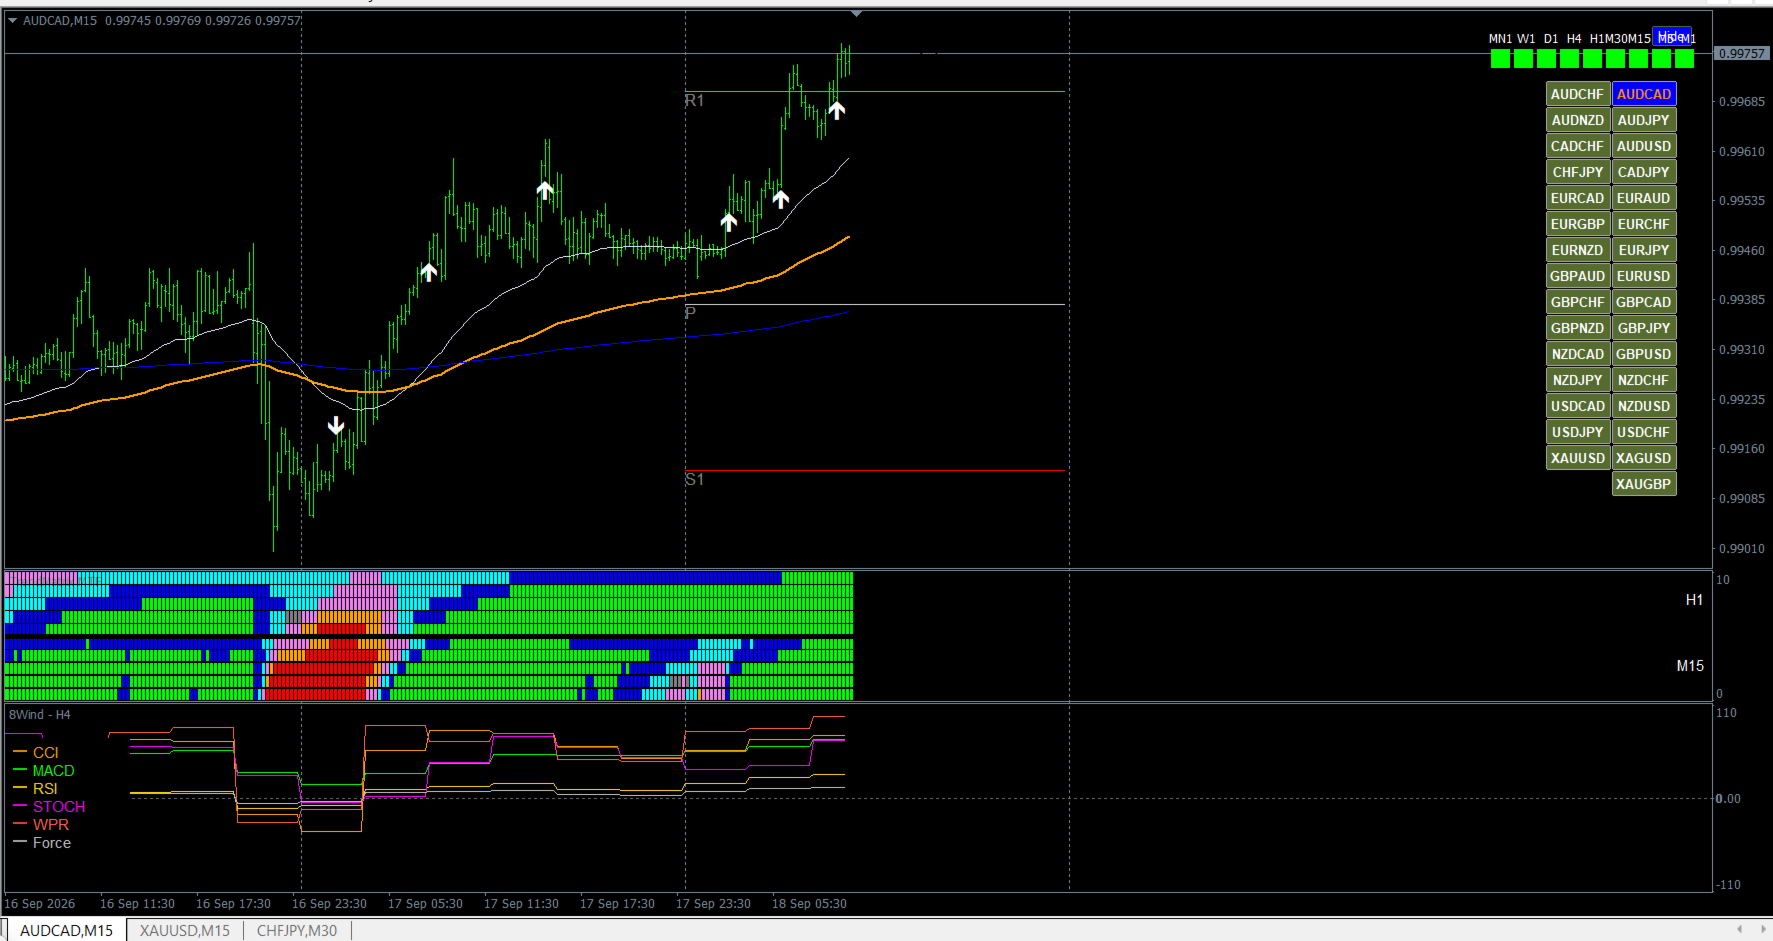
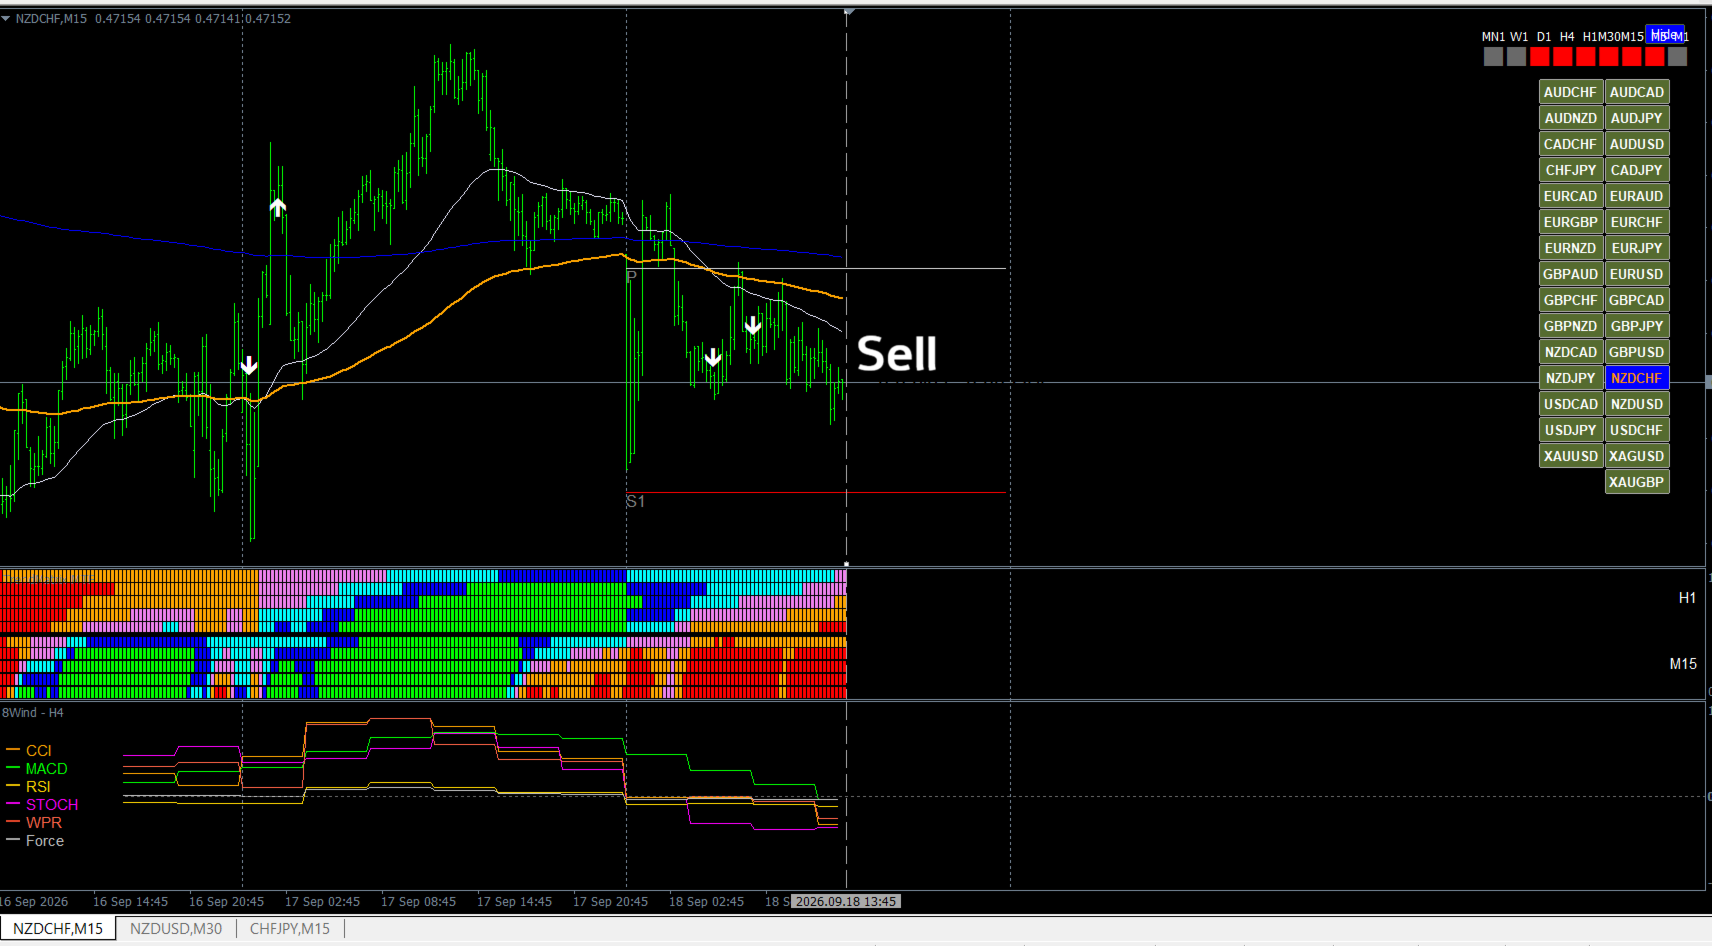
The result is displayed as a simple color matrix that makes trend development and multi-timeframe alignment easy to recognize visually.
Why TrendMatrix MTF?
A trend may look bullish on M15 while H1 or H4 is still bearish. Looking at only one timeframe can therefore give an incomplete picture.
TrendMatrix MTF places several timeframe perspectives together, allowing you to quickly see:
- Multi-timeframe trend alignment
- Bullish and bearish trend strength
- Trend transitions
- Agreement and disagreement between timeframes
- Changes in trend structure over time
Color Matrix
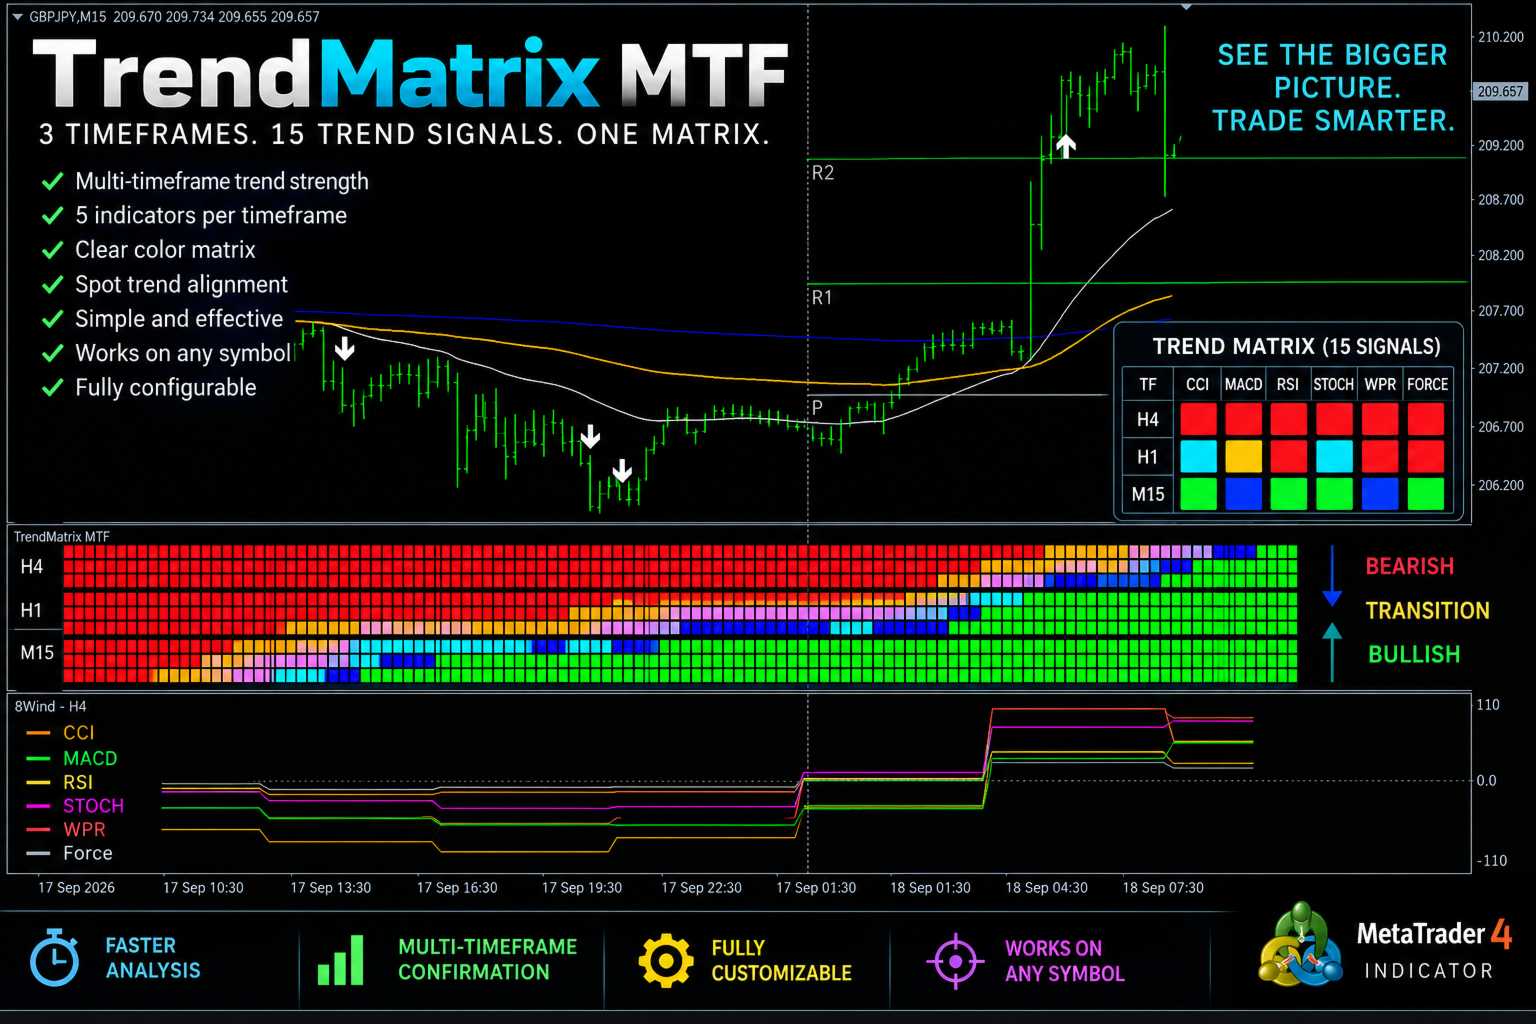
The default colors represent different trend-strength conditions:
Lime — Strong Bullish
Blue — Medium Bullish
Aqua — Weak Bullish
Gray — Neutral
Violet — Weak Bearish
Orange — Medium Bearish
Red — Strong Bearish
All colors can be customized.
Main Features
- Up to 3 independently selectable timeframes
- 5 trend measurements per timeframe
- Up to 15 simultaneous trend readings
- Clear visual color matrix
- EMA-based trend-strength analysis
- ATR-normalized measurements
- Adjustable Strong, Medium and Neutral thresholds
- Configurable EMA periods
- Fully customizable colors
- Adjustable historical display depth
- Timeframe labels and separators
- Each timeframe can be enabled or disabled independently
- Automatic matrix resizing when timeframe blocks are disabled
- Optimized rendering for faster symbol and timeframe switching
- Works with Forex, metals, indices and other symbols supported by MT4
Flexible Timeframe Configuration
TrendMatrix MTF can be adapted to different trading styles.
You can display:
3 timeframes → 15 trend rows
2 timeframes → 10 trend rows
1 timeframe → 5 trend rows
For example:
M15 + H1 + H4 for intraday multi-timeframe analysis.
The timeframes are fully selectable and are not limited to these defaults.
How to Use It
Look for areas where several rows begin moving toward the same directional colors.
When multiple timeframe blocks become predominantly bullish, the matrix visually shows increasing bullish alignment.
When they become predominantly bearish, it shows bearish alignment.
Mixed colors indicate disagreement or a transition between market conditions.
TrendMatrix MTF is designed to provide visual market context and confirmation, leaving the final trading decision to the trader.
Performance
TrendMatrix MTF uses optimized rendering to reduce unnecessary chart processing. Historical depth can also be adjusted according to your computer and analysis requirements.
Important
TrendMatrix MTF is an analytical tool. It does not open, modify or close trades and does not guarantee future market results.
TrendMatrix MTF — 3 Timeframes. 15 Trend Readings. One Matrix.
See the trend across multiple timeframes at a glance.
TrendMatrix MTF is a visual multi-timeframe trend-strength indicator for MetaTrader 4. It brings up to 15 trend readings into one compact color matrix, helping you see when different timeframes agree — or when they are moving in opposite directions.
Instead of constantly switching between M15, H1 and H4 charts, TrendMatrix MTF lets you monitor the broader trend structure from a single chart.
3 Timeframes × 5 Trend Measurements = 15 Trend Readings
Each selected timeframe is analyzed using five EMA-based trend measurements. The distance between fast and slow EMAs is normalized with ATR, allowing the indicator to classify different levels of bullish and bearish strength.
The result is displayed as a simple color matrix that makes trend development and multi-timeframe alignment easy to recognize visually.
Why TrendMatrix MTF?
A trend may look bullish on M15 while H1 or H4 is still bearish. Looking at only one timeframe can therefore give an incomplete picture.
TrendMatrix MTF places several timeframe perspectives together, allowing you to quickly see:
- Multi-timeframe trend alignment
- Bullish and bearish trend strength
- Trend transitions
- Agreement and disagreement between timeframes
- Changes in trend structure over time
Color Matrix
The default colors represent different trend-strength conditions:
Lime — Strong Bullish
Blue — Medium Bullish
Aqua — Weak Bullish
Gray — Neutral
Violet — Weak Bearish
Orange — Medium Bearish
Red — Strong Bearish
All colors can be customized.
Main Features
- Up to 3 independently selectable timeframes
- 5 trend measurements per timeframe
- Up to 15 simultaneous trend readings
- Clear visual color matrix
- EMA-based trend-strength analysis
- ATR-normalized measurements
- Adjustable Strong, Medium and Neutral thresholds
- Configurable EMA periods
- Fully customizable colors
- Adjustable historical display depth
- Timeframe labels and separators
- Each timeframe can be enabled or disabled independently
- Automatic matrix resizing when timeframe blocks are disabled
- Optimized rendering for faster symbol and timeframe switching
- Works with Forex, metals, indices and other symbols supported by MT4
Flexible Timeframe Configuration
TrendMatrix MTF can be adapted to different trading styles.
You can display:
3 timeframes → 15 trend rows
2 timeframes → 10 trend rows
1 timeframe → 5 trend rows
For example:
M15 + H1 + H4 for intraday multi-timeframe analysis.
The timeframes are fully selectable and are not limited to these defaults.
How to Use It
Look for areas where several rows begin moving toward the same directional colors.
When multiple timeframe blocks become predominantly bullish, the matrix visually shows increasing bullish alignment.
When they become predominantly bearish, it shows bearish alignment.
Mixed colors indicate disagreement or a transition between market conditions.
TrendMatrix MTF is designed to provide visual market context and confirmation, leaving the final trading decision to the trader.
Performance
TrendMatrix MTF uses optimized rendering to reduce unnecessary chart processing. Historical depth can also be adjusted according to your computer and analysis requirements.
Important
TrendMatrix MTF is an analytical tool. It does not open, modify or close trades and does not guarantee future market results.
TrendMatrix MTF — 3 Timeframes. 15 Trend Readings. One Matrix.