HL Levels
- 指标
- 版本: 1.0
- 激活: 5

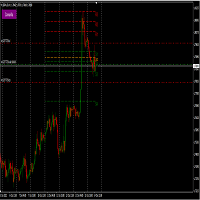
Draws a horizontal line at the previous day's highest price, with the line colored green.
Draws a horizontal line at the previous day's lowest price, also in green.
Draws a horizontal line at the high from two days ago, colored red.
Draws a horizontal line at the low from two days ago, also in red.
Currently, the indicator knows these, but it will be continuously developed, even by sending emails or push messages.