Probabilistic Price Predictor

  • 指标
  • Michail Pavlakis
    Michail Pavlakis
    🔹 Quantitative Trader | Algorithmic Trading | Financial Modeling
    I am a quantitative trader with a Master’s in Finance & Banking, specializing in statistical modeling, algorithmic trading, and derivatives pricing. My expertise includes:
  • 版本: 1.0
  • 激活: 15

Probabilistic Price Predictor (QuantBreak Probability Suite) – The Bayesian Edge for Smarter Trading

Unlock the Power of Probability in Market Forecasting.

The Probabilistic Price Predictor is a revolutionary trading indicator that applies Bayes' Theorem to forecast breakout probabilities with mathematical precision. Instead of relying on traditional, rigid indicators, QuantBreak uses adaptive probability calculations to identify high-probability trade setups based on historical price action and conditional statistics.

Whether used as a standalone system or in conjunction with other indicators, QuantBreak equips traders with real-time probability metrics, allowing for data-driven decision-making in an unpredictable market.

Why Choose Probabilistic Price Predictor?

🔹 Bayesian Probability Engine – Dynamically updates probability estimates to provide statistically relevant trade signals.
🔹 Higher Timeframe EMA Confluence – Incorporates HTF EMA analysis to detect market bias and filter low-quality setups.
🔹 Smart Breakout Forecasting – Computes the probability of bullish and bearish breakouts based on how price interacts with prior highs and lows.
🔹 Standalone or as a Confirmation Tool – Works independently or as a confirmation layer for RSI, Bollinger Bands, Smart Money Concepts (SMC), and other strategies.
🔹 Scientific Trading Panel – Displays real-time probability distributions, trend bias, and empirical price action metrics for enhanced clarity.
🔹 Universal Market Compatibility – Works across Forex, Stocks, Commodities, and Indices, on all timeframes.

Why Probability Works in Predicting Market Behavior

Unlike solid, fixed-rule indicators, probability-based models adapt to the dynamic nature of financial markets. Here’s why probabilistic forecasting is superior:

📌 Markets Follow Stochastic Processes – Price movements exhibit random yet structured behavior, making probability models more effective than static indicators.
📌 Bayesian Learning Updates with New Information – Instead of rigid signal conditions, QuantBreak refines probabilities as new data arrives, improving accuracy.
📌 Conditional Probability Accounts for Context – Unlike traditional indicators that rely on absolute values (e.g., RSI > 70), QuantBreak factors in prior price behavior to assess the likelihood of future moves.
📌 Probability Reduces Noise & False Signals – Solid indicators can generate false signals in choppy conditions, whereas probability-based models filter randomness by considering multiple conditions before confirming a move.
📌 Traders & Institutions Think in Probabilities – Professional quant traders and hedge funds do not trade based on rigid indicators; they trade based on probability-weighted scenarios—just like QuantBreak.

With Probabilistic Price Predictor, you're not just reacting to market movements—you’re anticipating them with quantitative reasoning.

Quantitative Features – The Edge You Need

📈 Empirical Bayesian Modeling – Calculates the likelihood of upward/downward breakouts based on past statistical patterns.
📊 Market-Adaptive Learning – The probability distribution updates in real-time, ensuring relevance to current market conditions.
⚡ No Repainting & No Lagging Signals – Works in real-time, with no repainting or delayed signals.
🔎 Enhanced Risk Management – Allows you to fine-tune stop-loss and take-profit levels based on probability estimates.
📊 Quantitative Backtesting Ready – Use historical probability distributions to validate your strategies before deploying in live markets.

Understanding the Conditional Probabilities

This indicator calculates the likelihood of price breaking above or below previous key levels based on past price action. It applies Bayes’ Theorem to determine how often certain price patterns lead to breakouts.

Here’s what each probability means (Examples):

📈 P(Break High | Previous Bar = Bullish) = 62.94%
→ If the previous bar was bullish (green), there is a 62.94% probability that the current bar will break above the previous high.

📉 P(Break Low | Previous Bar = Bullish) = 50.26%
→ If the previous bar was bullish, there is a 50.26% probability that the current bar will break below the previous low.

📈 P(Break High | Previous Bar = Bearish) = 34.36%
→ If the previous bar was bearish (red), there is a 34.36% probability that the current bar will break above the previous high.

📉 P(Break Low | Previous Bar = Bearish) = 72.50%
→ If the previous bar was bearish, there is a 72.50% probability that the current bar will break below the previous low.

📌 How to Use These Probabilities?
✅ If P(Break High | Bullish) > P(Break Low | Bullish) → The market has a higher probability of continuing upward.
✅ If P(Break Low | Bearish) > P(Break High | Bearish) → The market has a higher probability of continuing downward.
✅ If the probabilities are close to 50%, expect choppy or range-bound market conditions.

How to Use Probabilistic Price Predictor in Your Trading?

✅ Breakout Traders: Identify high-probability breakout zones with statistical confirmation.
✅ Trend Followers: Use HTF EMA bias to ensure trades align with the macro trend.
✅ Mean Reversion Traders: Detect false breakouts to avoid unnecessary stop-outs.
✅ Scalpers & Swing Traders: Adjust probability filters for short-term or long-term market dynamics.

🚀 Get the Quantitative Edge & Trade Smarter!
Ditch the guesswork. Trade based on probability, not emotions.

📥 Download QuantBreak Probability Suite today and start making data-driven trades!


推荐产品
Xtrade Trend Detector
Dago Elkana Samuel Dadie
Xtrade Trend Detector is an indicator capable of finding the best opportunities to take a position in any stock market. Indeed, it is a great tool for scalpers but also for Daytraders. You could therefore use it to identify areas to trade, it fits easily on a chart. I use it to detect trends on Big timeframes and take positions on Small timeframes. Don't hesitate to give me a feedback if you test it.
Baby Trader Coach
Stephanus Mollentze
TSD-47 Baby Trader Coach v1.50 Trading With Two Sensors Most trading indicators only use one sensor: Your Eyes. You watch charts, candles, moving averages and price action, trying to interpret what the market is doing. The TSD-47 Baby Trader Coach introduces a second sensor: Your Ears. Through its built-in coaching system, visual market analysis and voice guidance, Baby Trader Coach helps traders understand market conditions in real time without constantly staring at the chart. See More. Hear Mo
SchermanActionPro
AutomaticTrading
隆重推出 SchermanActionPro:Automatictrading 的全新自动交易机器人 特色功能:  • 可配置指标:根据Ivan 的建议调整平均值和蜡烛数量。  • 运营灵活性:在采购和销售之间进行选择。  • 获利了结:基于ATR 或相反信号的固定期权。  • 损失停止:可根据ATR 或相反信号配置固定。  • 手数类型:固定手数选择、以账户百分比表示的固定风险或固定金额。  • 最大批量保护:可配置。  • 点值和滑点大小:完全可调。  • 滤波器和输出:根据ATR 和扩展级别激活输入和输出滤波器。  • 获利了结和部分损失平仓:可按级别配置。  • 追踪止损和盈亏平衡:可配置距离、百分比和滑点。  • 按蜡烛数量输出:可配置。  • 工作时间:设置每周、每日和周五的特殊时间表。  • 移动通知:激活损失、余额和流动性警报。 使用建议:  • 指数:SP500  • 截止日期:D1(每日)  • 最低存款:1000 美元  • 账户类型:低点差 完全灵活性:由于其高度可配置性,您可以在其他市场尝试 SchermanActionPro。我们建议在使用真实账户进行交易
Trend Line Finder MT5
Stephen Reynolds
5 (2)
Trend Line Finder will project forward a support and resistance lines using 2 previous highs for resistance and 2 previous lows for support.  It will then signal to the trader by alert making the trader more aware that a possible good move is about to happen.     This is not a stand-alone trading system but is very useful in finding key areas of support resistance levels where price will usually either rebound from or breakthrough. Its down to the trader to decide what to do with use of other s
SPR Trading
Md Iqbal Kaiser
SPR Trading | 专业 XAUUSD 自动交易系统 (EA) 免责声明: 交易存在高额本金损失风险。过往业绩不代表未来表现。自动交易软件受 VPS 连接、市场极端行情等技术因素影响,本产品不保证任何盈利。 ️ 全球限量发售 为了维护策略的独特性与实盘表现,本产品仅限售 10 套 。售罄后,价格将上调至最高限额以停止公开发售。这 10 位用户将获得终身更新权限及我个人的专属技术支持。 适用对象: 追求纪律性、隐私保护及稳健风险管理的专业交易者。 研发背景: 该 EA 是我个人深耕交易市场 8 年以上 的核心策略,经过长期实盘优化。 重要提示: 本产品不建议用于跟单服务 (Copy Trading),仅供个人专业化交易使用。 ️ SPR 方法论:策略 (Strategy)、心理 (Psychology)、风险 (Risk) SPR 框架构建于三个核心支柱之上: 策略 (Strategy): 精炼、稳健的算法执行逻辑。 心理 (Psychology): 完全排除人类情感干扰、冲动与迟疑。 风险 (Risk): 系统化的风险管控,确保每一步交易均在规则内执行。 核心技术优
# MT5 挤压动量指标 使用功能强大的**挤压动量指标**,释放爆发式市场机遇。该指标专为 MetaTrader 5 平台专业开发。 这款先进的波动率和动量指标可帮助交易者在重大市场行情发生前识别低波动时期。该指标结合了布林带和肯特纳通道的优势,揭示市场何时处于“挤压”状态,并准备突破。 内置的动量柱状图使趋势方向和动量变化一目了然,帮助交易者自信而精准地入场交易。 ## 功能特性 * 高级挤压检测系统 * 专业 MT5 平台实现 * 突破爆发前检测波动挤压 * 动态颜色变化的动量直方图 * 挤压状态点,方便解读市场状况 * 整合: * 布林带 * 肯特纳通道 * 线性回归动量 * 早期趋势转变检测 * 简洁流畅的独立窗口显示 * 完全自定义设置 * 轻量级优化,运行流畅 ## 动量直方图颜色 * 亮绿色 → 上涨动量增强 * 深绿色 → 上涨动量减弱 * 亮红色 → 下跌动量增强 * 深红色 → 下跌动量减弱 ## 挤压点颜色 * 白色 → 挤压开启(低波动/突破设置) * 金色 → 挤压释放(潜在突破行情) * 红色 → 无挤
Stop spending hours manually drawing boxes, lines, and killzones on your charts. The Propfolio ICT & SMC Advanced Markup is the ultimate all-in-one chart assistant for the modern institutional trader. Designed specifically for Smart Money Concepts (SMC), Inner Circle Trader (ICT), and BTMM methodologies, this indicator automatically maps out the entire institutional narrative on your chart in real-time. Whether you are trading a prop firm challenge or managing live capital, this tool keeps your
Fibrillar
Vitalii Zakharuk
It is very easy to use the Fibrillar indicator, since the simplest is to look at the chart and act according to the indications of the colored arrows. The algorithm takes into account the measurement of prices, and this method also focuses on measuring each of the price drops (H / C, H / O, LC, LO) - which gives more detailed information, but also more averaged. When calculating this indicator, logarithmic gains are first calculated at the closing price, which allows you to filter out the tren
Yawabeh SD Pro –  Professional Supply and Demand Indicator Trade Smarter with Volume-Confirmed Supply/Demand Zones Our institutional-grade algorithm identifies high-probability reversal zones before price reacts, giving you the edge in Forex, Crypto, and Stocks. Key Features Multi-Timeframe Confirmation – View trend strength across multiple timeframes simultaneously – Align your trades with higher timeframe momentum Smart Alert System – Real-time notifications for: – Strong demand/supply zone
本指标是实践实战交易完善的波浪自动分析的指标 !  案例... 注: 波浪分级用西方叫法不习惯,因受到缠论(缠中说禅)命名方式习惯的影响,我是将基础波浪命名为 笔 ,将二级波段命名为 段 ,同时具有趋势方向的段命名为 主趋段 (以后笔记中都是这种命名方式,先告知大家),但是算法上和缠论关系不大切勿混淆.反映的是本人分析盘面总结的 千变万化纷繁复杂的运行规律 . 对波段进行了标准化定义,不再是不同人不同的浪  ,    对人为干扰的画法进行了排除,在严格分析进场起到了关键的作用 . 使用这个指标,等于将交易界面提升美感,抛弃最原始的K线交易带你进入新的交易层次.如果不是为了交易,在宣传上也将使客户观感提升层次. 指标内容: 1.   基础波浪 (笔) : 首先我们找出了价格波动过程中的基础波动拐点,当然他的有序性低,为下一步的计算提供基础. 2.   二级波段( 段 ) :在基础波浪的基础上,通过算法分析得到层级更明显的二级波段,二级波段为波浪提供了分析基础 3.   波浪( 浪 ): 有着更清晰的趋势,更清晰直观的方向.分析一个波浪是否延续,需要看二级波段的形态,分析二级的构成
[b]Titan Pro V7 Institutional Dashboard[/b] is an advanced quantitative HUD terminal engineered for MetaTrader 5, designed for institutional market analysis, quantitative prop-firm verification, and disciplined intraday execution. Unlike conventional single-formula indicators that suffer from lag and market regime shifts, Titan Pro V7 synthesizes a multi-strategy quantitative consensus model combining Trend Momentum, Volatility Breakout, Intraday VWAP, and Smart Money Concepts (SMC) into a sin
Valid BOS Pullback
Brighton Mufaro Mudzingwa
Elevate Your Price Action Trading with the Valid BOS Pullback MT5 Indicator Master market structure and capture high-probability entries with the Valid BOS Pullback indicator. Designed specifically for professional traders, this algorithm filters out market noise by identifying genuine break-of-structure setups following a verified pull-back and retest of old levels. Whether you are trading major Forex currency pairs or specialized Synthetic Crash Indices that feature sudden spikes, this indicat
Atlantic Wick EURUSD H2 Historical statistics Period: 2023-04-10–2026-09-09 Data split: 70% in-sample / 30% out-of-sample (OOS) Cumulative return over the full period: 23.04% Maximum drawdown: 2.37% Trades: 109 Win rate: 76.15% Profit factor: 2.45 Reference-test risk: 1.00% per trade Broker data: Blueberry Markets Pty Ltd Longest losing streak in the reference test: 2 trades Historical reference backtest of the source strategy; these are not live results. This version defaults to 2.00% risk
Marubozu Pro SUP
N'da Lemissa Kouame
Marubozu Pro ELITE X v3.100 – Market Description Overview Marubozu Pro ELITE X is an advanced price action indicator designed to automatically detect optimized Marubozu candlestick patterns combined with a dynamic EMA trend filter . It provides clear BUY / SELL signals along with structured market levels (High, Low, Mid), helping traders make faster and more accurate decisions.  Key Features  1. Automatic Signal Detection BUY signal (blue arrow) when a strong bullish candle with minimal wick is
Confluence Master Signal Scanner A Multi-Timeframe, Multi-Symbol Setup Filter for Serious Traders Overview Confluence Master Signal Scanner is a professional-grade market scanning tool that automatically reviews every symbol in your Market Watch across multiple timeframes and returns only the setups where independent analytical factors all point in the same direction. It is not a signal generator in the traditional sense. It is a filter — a disciplined, tireless scanning engine that discard
DRB Dynamic Range Breakout DRB Dynamic Range Breakout 是一款适用于 MT5 的无重绘指标,旨在识别结构化价格反应区域,并生成经过确认的买入和卖出信号。 信号仅在当前K线收盘后确认。确认后,信号不会重绘、消失或移动到其他K线上。 每个信号都可以显示参考入场价、止损位,以及最多十个可配置的盈利目标。 主要功能 K线收盘后确认的无重绘信号 适用于外汇、黄金、白银、美国指数和加密货币 默认选择外汇配置 可显示买入信号、卖出信号或两者同时显示 八种可选入场方式 八种可选止损方式 可设置 1 至 10 个盈利目标 可根据区域大小调整目标间距 可选 SMA、EMA 和 RSI 过滤器 每个过滤器可独立设置周期和时间周期 可调整每日最大信号数量 实心箭头直接显示在信号K线上 支持信号、目标和止损提醒 自动删除较早的信号,使图表更加整洁 灵活的信号确认 SMA、EMA 和 RSI 过滤器可以分别启用。 当多个过滤器同时启用时,只有在所有选定条件均得到确认后,信号才会出现。 所有过滤器默认关闭,用户可以先使用标准设置,并在需要时增加额外确认条件。 盈利
The indicator helps to enter a trade following the trend, at the same time, after some correction. It finds strong trending movements of a currency pair on a given number of bars, and also finds correction levels to this trend. If the trend is strong enough, and the correction becomes equal to the one specified in the parameters, then the indicator signals this. You can set different correction values, 38, 50 and 62 (Fibonacci levels) are better. In addition, you can set the minimum trend lengt
MFOP Market Forecast
Oscar Josue Pin Bacuzoy
Develop this indicator for periods of 30 minutes or more, focus on getting market trends right and making sure they are met. MFOP v8.1 gets straight to the point: it scans the market and tells you exactly when there is enough strength to enter a trade. This indicator doesn't do magic, it uses mathematical algorithms to filter out market noise, not enter into false breakouts and show you clear BUY (blue arrow) and SELL (red arrow) opportunities. It is designed and optimized specifically to take
CV QuantMarketScreener Pro CV QuantMarketScreener Pro   is a professional multi-asset market screener for MetaTrader 5, developed for institutional-grade market analysis, rapid signal detection, and efficient multi-symbol trading. The screener combines modern market structure analysis, trend filters, volatility evaluation, and advanced visual signal technology in one powerful dashboard system. The integrated screener allows simultaneous monitoring of multiple markets such as: Forex Indices Metal
Candlestick Patterns Scanner MT5
KEENBASE SOFTWARE SOLUTIONS
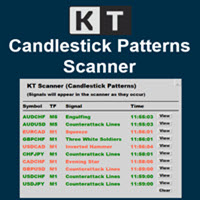
KT Candlestick Patterns Scanner is a Multi-Symbol and Multi-Timeframe scanner that fetches and shows various candlestick patterns on 28 currency pairs and 9 time-frames concurrently . The scanner finds the candlestick patterns by loading the KT Candlestick Patterns indicator as a resource in the background. Features The scanner can find the candlestick patterns on 252* combinations of symbols and time-frames from a single chart. Open the signal's chart loaded with a predefined template with a s
适用于 MT5 的 Crypto_Forex 指标“趋势柱状图”,无需重绘。 ............................................................................... - 趋势柱状图指标比任何标准移动平均线交叉指标都更加灵敏高效。 - 指标支持两种颜色:黄色(金色)表示看跌趋势,绿色表示看涨趋势(可在设置中更改颜色)。 - 趋势柱状图内置移动端和 PC 端警报。 - 建议将此指标与其他交易方法结合使用:价格行为、VSA 和其他指标。 - 该直方图是将价格和成交量数据结合成单一数值的最佳指标之一。 点击这里查看高质量的交易机器人和指标! 本产品为独家产品,仅在 MQL5 网站上提供。
Harraz Master HUD
Muhammad Azraf Bin Dzul Fauzi
HARRAZ MASTER HUD v4.4 - The Ultimate Neural Trading Command Center ​ Transform your MetaTrader 5 into a professional, institutional-grade trading terminal. Harraz Master HUD is not just an indicator; it is a complete Artificial Intelligence ecosystem designed specifically for XAUUSD (Gold) and major pairs. ​ EXCLUSIVE FEATURES: ​1. Live Neural AI Typewriter (Jarvis Mode) Experience a live, animated Heads-Up Display that types out real-time market sentiment and advice. It acts as your persona
Police 911
Mostafa Mahmoud Badawy Hussien
POLICE 911 — Precision Engineering. Coordinated Trading. I developed POLICE 911 to combine precise engineering, diversified trading strategies and structured risk management in one MetaTrader 5 trading robot.   LIVE SIGNAL    https://www.mql5.com/en/signals/2398654?source=Site    Warning: You need the instruction and operation manual before applying this robot to a trading account; it is a sophisticated and complex EA Core Features Gold and Forex: Automated trading across gold and selected fore
Market Markers EA
Tshepo Michael Motaung
This EA is sessions trading robot that allows you to trade the trading session of yours choice as it waits for market markers to make decision for the direction of the day before taking any trades. It has 3 entry signals that uses candle stick patterns, Moving Averages and Range Break to maximize profits and to take advantage of the trending market. The EA practices risk management and has the ability to grow account by risking certain percentage of your account(risk percentage) each time there
TrendMorph
Evgeniy Zhdan
TrendMorph —— 带入场箭头的自适应趋势指标 简介 TrendMorph 用彩色线条显示趋势方向,用 Buy/Sell 箭头标记反转点,并为每个信号给出置信度评分以及止损/目标价位。指标可以根据当前市场状态自动调整线条的灵敏度,因此同一组参数在平静和波动剧烈的行情中都能使用。图表上显示信息面板,所有关键数值也可通过缓冲区供 EA 调用。 MT4-version:  https://www.mql5.com/en/market/product/202707 工作方式 趋势线跟随价格:蓝色表示上升趋势,红色表示下降趋势。 当趋势转向且信号通过各项过滤(RSI、成交量、价位质量、信号间隔)后,出现箭头。箭头在K线收盘后绘制,之后不会移动或消失。 启用自动调节后,线条灵敏度(Band Width 和 Smoothing Period)会适应市场。 每个信号都带有置信度(0–100)以及以 ATR 表示的 Stop 和 Target 价位。 使用方法 箭头是K线收盘后的入场信号。趋势线显示方向,可作为持仓管理的参考。 查看面板中的 Market 行:TREND 表示趋势行情,RAN
FREE
Bestofthebest
Francisco Marcio Serafim
The best indicator I created for scalping and day trading. Forget the rest and study this one. See you later. This indicator shows price exhaustion points based on movements. Over the months, it has proven very effective on the xauusd pair. With scalping and martingale methods, it becomes very accurate. Study and take full advantage of this indicator until you gain confidence. Try to enter slowly and increase your position size appropriately. I hope it improves your trades by more than 100%.
The Propfolio Master Suite is the ultimate all-in-one analytical workstation for professional traders. Combining the power of the Beat The Market Maker (BTMM) methodology, Smart Money Concepts (SND/Liquidity), and Advanced Volume Profile, this suite replaces multiple different indicators with one optimized engine. Monitor up to 14 pairs simultaneously from a single chart, instantly identify market cycles, and seamlessly map institutional footprints with the click of a button. The Command Center
Does your market really lean bullish on Tuesdays? Stop guessing — measure it. Traders repeat weekday folklore for years without ever checking. Statistical Bias checks — on the actual history of the instrument on YOUR chart — and shows the result in a compact, always-visible panel. WHAT IT DOES Over your chosen lookback, the indicator computes for each weekday (Monday to Friday) the percentage of days that closed up , and displays the full weekly profile in a clean panel — with today's weekday
This indicator works on atr with some edited . The AI ​​MACD FILTER indicator is used for confirmation. Certainly, the indicator contains an alert when the signal appears, and you use the exit of the deal on the saturation that occurs at the AI ​​MACD. The accuracy of the work is high on gold, the time frame is five minutes, while staying away from trading at the time of news that occurs on the US dollar. And using high liquidity trading times, which are two hours before the opening of the Lond
Dual-Period Williams %R Oscillator for MT5 A sophisticated trend exhaustion detector that combines two Williams %R oscillators to identify high-probability reversal opportunities through confluence analysis. ======================================================================================== Key Features Intelligent Dual-Signal System Fast and Slow Williams %R periods working in confluence Real-time trend exhaustion detection with reliable signals Optimized calculations for smooth MT5 perfor
该产品的买家也购买
Entry Points Pro for MT5
Yury Orlov
4.55 (152)
Entry Points Pro 会在您下单之前,告诉您在哪里入场、止损放在哪里、用多大的手数交易。 价格 现在 199 USD,按此价格出售 8 份,之后为 249 USD。最终价格为 349 USD。 我靠交易市场赚钱,并公开展示,所以我不需要把这个指标卖给所有人。它是为独立思考的交易者准备的工具,而不是一个神奇按钮。 没有突破,就没有交易。灰色箭头表示信号已取消:价格没有突破信号K线,因此没有入场,也没有亏损。 箭头在 K 线收盘时出现,并且不会重绘。只有两项设置:您的本金和每笔交易的风险。 付款前先验证:免费演示版可在 MT5 策略测试器中运行,只需两分钟。购买后,我会亲自帮您完成设置。 2019 年,我向全世界展示了这款指标的能力。我按它的信号手动交易,用的是真实账户,全程公开——账户在 Myfxbook 上接受监控,我还在 Facebook 上详细记录了这次实验。结果:10,000 美元在四个月内变成了 941,411 美元。风险是我有意设得极高的——回撤一度达到 54%,因为在我们这一行,利润和风险总是相伴而行。Myfxbook 的截图就是图库中的第一张图片。 看来
Ultra Indicator
Ihor Otkydach
5 (1)
ULTRA 是一項採用「一站式」運作模式的技術指標——它能獨立分析市場、產生交易訊號、顯示設定停損單的價位,並建議何時平倉以鎖定獲利或將損失降至最低。 換句話說,無論您是否懂得分析市場、判定價位(該將停損設在哪裡),或是對資金管理感到棘手,都無妨。ULTRA 會為您處理所有這些事情! 買家專屬好禮 : 購買 ULTRA 指標後,請透過私訊聯繫我,即可免費獲贈「ULTRA BOT」。這是一款特別設計的工具,能協助您根據該指標發出的訊號來管理已開倉的交易(它會為每筆交易設定停損點,並依照策略規則自動平倉,以爭取最佳交易結果)。 我還會為買家提供各種資產的預設參數,讓該指標能發揮最大效能。請透過私訊聯繫我,免費獲得這些超級好處! ULTRA 策略的運作方式 ULTRA 指標會分析歷史價格數據(涵蓋約過去 4 年),並自動學習辨識波段反轉,以便在實際交易中為您創造最大利潤。 該指標的訊號絕不會重新繪製!!一切都盡可能做到真實且直觀! ULTRA 指標運用特殊的虛擬化演算法,根據歷史數據計算所有訊號的結果,並將其交易成果顯示於儀表板上。這意味著您甚至在開始交易之前,就能預先了解 ULTRA 指標
Gann Made Easy MT5
Oleg Rodin
5 (13)
Gann Made Easy   是一个专业且易于使用的外汇交易系统,它基于使用先生理论的最佳交易原则。 W.D.江恩。该指标提供准确的买入和卖出信号,包括止损和获利水平。您甚至可以使用推送通知在旅途中进行交易。 购买后请联系我,即可免费获得交易指导和超棒的额外指标! 您可能已经多次听说过江恩交易方法。通常 Gann 的理论不仅对于新手交易者而且对于那些已经有一定交易经验的人来说都是非常复杂的东西。这是因为江恩的交易方法在理论上并不那么容易应用。我花了几年时间来完善这些知识,并将最好的原则应用到我的外汇指标中。 该指标非常易于应用。您所需要的只是将其附加到您的图表并遵循简单的交易建议。该指标不断进行市场分析工作并寻找交易机会。当它检测到一个好的入口点时,它会为您提供一个箭头信号。该指标还显示止损和获利水平。 换句话说,当您像先生一样进行交易时,该指标会为您提供最佳江恩建议。江恩亲自告诉你此时此刻该做什么。但最好的部分是您不需要了解任何有关江恩交易原则的知识,因为该指标会为您完成整个市场分析工作。
Boba Analysis Suite
Trade Ready Solutions LLC
5 (2)
Boba Analysis Suite Boba Analysis Suite 是一款适用于 MetaTrader 5 的分析指标。它将市场结构、关键价格区域和整体市场背景整合到同一图表视图中。 该指标源于交易及交易教学的实践经验,旨在帮助用户建立有条理的分析流程:评估市场方向、识别重要价位,并结合多个时间周期进行分析。 结合市场背景进行分析 单个信号的意义取决于市场背景。Boba Analysis Suite 帮助用户将当前图表状况与更大范围的市场结构相结合,并根据预先制定的规则评估交易思路。 分析功能包括: **趋势与市场结构:**评估市场方向及相关结构背景。 **关键价格区域与价位:**在图表上直观标示值得进一步分析的重要区域。 **多时间周期:**整合不同时间周期的信息,评估整体市场背景。 **可视化分析流程:**直接在图表上查看分析信息。 自主做出交易决策 Boba Analysis Suite 适合希望系统分析图表并结合多个时间周期信息的交易者。 该指标用于辅助分析,不会开仓或平仓,也不能替代交易策略或风险管理。每一笔交易的决策均由用户自行做出。 使用与许可 平台:Meta
Azimuth Pro
Ottaviano De Cicco
5 (7)
Azimuth Pro V2:MT5合成分形结构分析与确认入场 概述 Azimuth Pro 是 Merkava Labs 推出的多层级波段结构指标。四层嵌套波段层级、锚定波段的VWAP、ABC形态识别、三时间框架结构过滤以及收盘确认入场——一个图表,一个从微观波段到宏观周期的完整工作流程。 这不是盲目的信号产品。它是一个以结构为先的工作流程,专为重视位置、背景和时机的交易者打造。 1. V2的变化 合成多时间框架引擎 高时间框架分析从零开始重建,采用与Meridian Pro相同的专有合成架构。更清晰的HTF背景、稳定的实时行为、无经典MTF同步问题。合成引擎还解锁了 固定比率时间框架级联 (x2、x3、x4、x6)——不再在经纪商的固定时间框架之间任意跳转,您可以按图表时间框架的固定倍数分析结构,在每个尺度上保持相同的分形关系。 确认入场箭头 作为稳定且可恢复的执行层而设计的收盘确认箭头。当ABC设置形成且自适应确认逻辑在收盘K线上验证方向时,箭头会写入下一根K线的开盘,并设计为在刷新、切换时间框架、重新加载指标或重启终端等正常图表生命周期事件后仍能一致恢复。 这些不是独立的买
M1 Sniper MT5
Oleg Rodin
5 (7)
M1 SNIPER   是一款易于使用的交易指标系统。它是一个专为 M1 时间框架设计的箭头指标。该指标可以作为独立的系统在 M1 时间框架下进行剥头皮交易,也可以作为您现有交易系统的一部分使用。虽然该交易系统专为 M1 时间框架交易而设计,但它也可以用于其他时间框架。我最初设计此方法是为了交易 XAUUSD 和 BTCUSD。但我发现这种方法在其他市场交易中也同样有用。 指标信号既可以顺势交易,也可以逆势交易。我教授一种特殊的交易技巧,帮助您利用指标信号进行双向交易。该方法基于使用特殊的动态支撑位和阻力位区域。 购买后,您可以立即下载 M1 SNIPER 箭头指标。此外,我还为所有 M1 SNIPER 工具用户免费提供下方屏幕截图所示的 Apollo Dynamic SR 指标!这两个指标的组合可以帮助您更轻松、更准确地利用 M1 时间框架进行交易。 购买后请联系我,免费获取交易提示和奖励指标! 祝您交易成功!
SQN Max indicator for MT5 by ITC
Renaud Herve Francois Candel
Sqn Max Indicator Sqn Max is an exclusive indicator to trade the market with high effectiveness. The indicator is based on price action, volatility and trend. This indicator is as simple as possible but not too simple. The indicator can generate alerts to ease the trading process. You don't have to stay all day in front of your screen. The indicator can be used with any class of assets and with any time frame. It is possible to achieve better results trading our list of selected assets. We achi
Auto Optimized SpeedAngle 是一款机构级的动量向量化系统,通过持续的前瞻优化(Walk-Forward Optimization, WFO)彻底消除了曲线拟合(curve-fitting)。该指标没有采用在市场 状态转换时容易失效的静态输入参数,而是利用出样外验证(Out-of-Sample, OOS) dynamically 动态重新校准设置,从而确保显示的 信号代表真正的统计优势,而非历史巧合。 核心机构级架构 前瞻优化引擎(Walk-Forward Optimization Engine): 核心算法持续扫描数千种回溯周期(lookback)与阈值组合,严格将数据划分为样本内(in-sample)和样本外(out-of-sample)。只有当参数配置在未知数据环境中证明具备数学优越性时,系统才会对其进行 adoption。 量化目标函数(Quantitative Objective Functions): 优化引擎不一味追求绝对毛利,而是聚焦于机构级的稳定性指标。用户可针对系统质量数(SQN)、期望值(每笔交易的平均 R 倍数)或净 R 值进行优化,从而优
Apex Patterns PRO 购买指标 — 免费获取基于该指标的 Expert Advisor。 自我优化的图表形态与突破分析智能 传统的形态扫描器依赖固定输入,在市场波动和结构发生变化时通常表现不佳。 Apex Patterns PRO 旨在适应不断变化的市场条件,将结构性图表形态识别、动量过滤和统计自我优化结合到一个分析框架中。 适应性扫描引擎 自我优化形态模式 在近期历史数据中自动搜索合适的形态参数,使指标能够根据当前市场行为调整其结构检测,而不是使用静态配置。 智能突破过滤 将经典形态识别与动量、成交量和价格行为指标相结合。引擎不会同等对待每次突破,而是评估潜在的市场结构,以识别符合当前统计环境的交易设置。 主要功能 固定的、不重绘的实时信号 自我优化的形态检测参数 丰富的图表结构库(顶部/底部、头肩顶/底、三角形、楔形) 基于动量和成交量的突破过滤 基于市场结构的动态止损和止盈水平 图表信号和实时性能指标 标准的推送、电子邮件和平台提醒 专为适应不断变化的市场条件而设计,而非依赖永久固定的参数 核心理念 目标不是将静态的几何形状强加于动态的市场。 目标是让历史市场数据
Adaptive Price Action Engine 买指标,免费送EA 自适应多时间框架趋势与K线形态智能分析系统 市场环境始终在变化,不同的市场阶段中,并非所有 Price Action 形态都具有相同的参考价值。 Adaptive Price Action Engine 旨在适应不断变化的市场条件,将 趋势结构、多时间框架分析、K线形态与统计优化 整合到一个统一的分析框架中。 两种自适应模式 Dual Alpha Trend Mode(双 Alpha Trend 模式) 自动搜索适合的 Alpha Trend 参数,并结合低周期与高周期市场结构,使指标能够根据近期市场行为动态调整趋势识别。 Candlestick + Alpha Mode(K线 + Alpha 模式) 将 Alpha Trend 市场状态与 22种多空K线形态 相结合。系统不会简单地对所有形态一视同仁,而是对不同的形态组合进行统计评估,并识别在特定市场环境下表现出更强历史统计特征的配置。 主要功能 趋势参数自动优化 多时间框架市场状态分析 22种多头与空头 Price Action K线形态 对数千种可能
Divergence Bomber
Ihor Otkydach
4.89 (94)
购买该指标的每位用户将额外免费获得以下内容: 原创工具“Bomber Utility”,该工具会自动跟踪每一笔交易,设置止损和止盈点,并根据策略规则自动平仓; 适用于不同交易品种的指标设置文件(Set 文件); 三种不同风险模式下的 Bomber Utility 设置文件:“最低风险”、“平衡风险” 和 “观望策略”; 一套详细的 视频操作手册,帮助您快速完成安装、配置并开始使用本交易系统。 注意: 要获取以上所有赠品,请通过 MQL5 的私人消息系统联系卖家。 我为您介绍原创的自定义指标 “Divergence Bomber”(背离轰炸机),它是一套基于 MACD 背离交易策略 的“全功能”交易系统。 该技术指标的主要任务是识别 价格与 MACD 指标之间的背离,并发出交易信号(包括推送通知),指示未来价格可能的运动方向。平均而言,这些信号的准确率超过 98%。有关该指标如何工作的详细说明,请观看本页面上的视频演示。 该系统使用 止损订单 和 动态回撤平仓机制 来管理交易。 Divergence Bomber 指标的主要特点: 支持交易的品种: AUDCAD、AUDCHF、AUDS
货币强度向导是一个非常强大的指标,为您提供成功交易的一体化解决方案。该指标使用多个时间范围内所有货币的数据来计算这个或那个外汇对的力量。此数据以易于使用的货币指数和货币电力线的形式表示,您可以使用它们来查看这种或那种货币的力量。 您所需要的只是将指标附加到您要交易的图表上,该指标将向您显示您交易的货币的真实强度。该指标还向您显示买卖量压力的极值,您可以在顺势交易时利用这些压力。该指标还显示了基于斐波那契的可能目标。该指标可用于各种交易时间范围。该指标支持各种货币对的交易。   该指标为您提供所有类型的警报,包括推送通知。 购买后请联系我。我将与您分享我的交易技巧,并免费为您提供丰厚的红利指标! 祝您交易愉快,获利丰厚!
Naked Forex Tweezer Pro Indicator Tweezer Pro Indicator is a pattern recognition indicator for Forex, Stocks, Indices, Futures, Commodities and Cryptos. The standard Tweezer is a two bar pattern. Our enhanced version is a multi-bar pattern. We filter the patterns for you so that you only get the     best and most effective patterns   and ignore the noise. The Tweezer pattern is a simple and effective pattern to trade. The strategy that comes with the Tweezer is based on price action. The Twe
FX Levels Premium indicator for MT5
Renaud Herve Francois Candel
Fx Levels Premium Indicator Support and Resistance are important concepts in trading. Fx Levels Premium was created to easily draw important levels of support and resistance for the active trader. The indicator will give you all important levels (support/resistance) to watch for a wide range of assets. Trading without these levels on your chart is like driving a car for a long journey without a roadmap. You would be confused and blind. Support and resistance levels should be used as guideline
ARICoins
Temirlan Kdyrkhan
ARICoin is a powerful trading companion designed to generate high-probability entry signals with dynamic TP/SL/DP levels based on volatility. Built-in performance tracking shows win/loss stats, PP1/PP2 hits, and success rates all updated live. Key Features: Buy/Sell signals with adaptive volatility bands Real-time TP/SL/DP levels based on ATR Built-in MA Filter with optional ATR/StdDev volatility Performance stats panel (Success, Profit/Loss, PP1/PP2) Alerts via popup, sound, push, or email Cust
PZ Swing Trading MT5
PZ TRADING SLU
5 (5)
Swing Trading 是第一个旨在检测趋势方向的波动和可能的反转波动的指标。它使用在交易文献中广泛描述的基准摆动交易方法。该指标研究多个价格和时间向量,以追踪总体趋势方向,并检测市场超卖或超买并准备好进行修正的情况。 [ 安装指南 | 更新指南 | 故障排除 | 常见问题 | 所有产品 ] 市场波动的利润不会被窃取 指示器始终显示趋势方向 彩色价格带代表机会基准 彩色虚线表示可能的反转波动 该指标分析其自身的质量和性能 它实现了一个多时间仪表板 可定制的趋势和波动周期 它实现了电子邮件/声音/推送警报 指示器为非重涂或重涂 什么是摇摆交易 摇摆交易是一种尝试在一天到一周内从证券中获得收益的交易方式,尽管某些交易最终可以保持更长的寿命。摇摆交易者使用技术分析来买入弱点和卖出力量,并有耐心等待这些机会的发生,因为在发生一波抛售浪潮之后购买证券而不是陷入抛售更有意义。 机会基准 关于历史数据的大量研究证明,适合于波动交易的市场倾向于在基线价格带上下交易,基线价格带由图表显示,使用平均真实区间计算得出。波动交易者使用基线,该策略是购买常态和卖出躁狂,或做空常态并掩盖沮丧。在没有疲
Apollo SR Master 是一款支撑/阻力指标,其特殊功能使利用支撑/阻力区域进行交易更加便捷可靠。该指标通过检测局部价格顶部和底部,实时计算支撑/阻力区域,没有任何时间延迟。为了确认新形成的支撑/阻力区域,该指标会显示特殊信号,表明该支撑/阻力区域可以作为实际的卖出或买入信号。在这种情况下,支撑/阻力区域的强度会增强,因此从该区域进行交易的成功率也会更高。这正是该指标的核心理念。 SR区域也使止损和止盈的操作更加便捷。根据信号方向,可以将SR区域上方或下方的空间用作止损位。此外,相对的SR区域也可以用作潜在的止盈区域。 我还免费向所有 Apollo SR Master 指标的用户提供我的“Apollo 价格行为系统”指标。这两个指标结合使用将帮助您找到更好的入场点。 购买后请联系我,即可免费获得交易指导和超棒的额外指标!
Neuro Poseidon MT5
Daria Rezueva
4.68 (53)
Neuro Poseidon is a new indicator by Daria Rezueva. It combines precise trading signals with adaptive TP/SL levels - creating best possible trades as a result! Message me and get  Neuro Poseidon Assistant  as a gift to automize your trading process! What makes it stand out? 1. Proven profitability on all assets and timeframes 2. Only confirmed BUY and SELL signals present on the chart 3. Adaptive TP & SL levels generated by the software for each trade 4. Easy to understand - suitable for al
SIO Oscillator
Davit Beridze
SIO Oscillator:自优化半方差失衡振荡器 购买指标,即可免费获得基于该指标的智能交易系统(EA)。 大多数振荡器对所有价格波动一视同仁。SIO 将上行压力与下行压力分开,并衡量两者之间的失衡程度,清楚显示究竟是买方还是卖方在真正掌控市场。当失衡达到极值时,SIO 会给出明确的信号,并附带入场价、止损(Stop Loss)和止盈(Take Profit)水平。 SIO 的独特之处在于它不依赖固定参数。内置的自优化器会持续寻找适合当前品种和周期的参数,并在使用之前对其进行验证。 两种信号模式 均值回归(Mean Reversion):在失衡极值处交易,预期价格回归平衡。 趋势跟随(Trend Following):顺着持续、占主导地位的失衡方向交易。 自动模式:由优化器根据近期数据选择表现更好的模式。 具备真实验证的自优化器 滚动前推优化(Walk-forward):参数只用历史数据选出,然后应用于之后的K线。 真正的样本外保留期(Hold-out):结果会在优化器从未训练过的数据上得到确认。 平台图(Plateau map):所有测试参数的可视化热力图。SIO 优先选择结果稳
ScalpPoint
Temirlan Kdyrkhan
ScalpPoint is a powerful trading companion designed to generate high-probability entry signals with dynamic TP/SL/DP levels based on volatility. Built-in performance tracking shows win/loss stats, PP1/PP2 hits, and success rates — all updated live. Key Features: Buy/Sell signals with adaptive volatility bands Real-time TP/SL/DP levels based on ATR Built-in MA Filter with optional ATR/StdDev volatility Performance stats panel (Success, Profit/Loss, PP1/PP2) Alerts via popup, sound, push, or emai
Superhero
Ihor Otkydach
5 (3)
SUPERHERO 指標是一款基於「全方位」原則設計的多貨幣交易系統。該指標能獨立分析市場,並提供開倉與平倉的交易訊號。它採用止損與獲利了結訂單,風險報酬比(R:R)為 1:1。 此系統可向您的智慧型手機發送推播通知,讓您無需綁定電腦,即可「隨時隨地」進行交易。這對於自營交易公司而言再適合不過了。 每位顧客皆可享額外好禮: 每位購買此指標的買家,都將收到我贈送的一項特別實用工具,該工具: 自動下達止損與獲利了結訂單 當價格達到目標水準時,系統會自動平倉 支援待執行訂單交易 支援均值交易模式 如果您希望將這款優秀且極為便利的工具作為禮物獲贈,請在購買 SUPERHERO 指標後,立即透過 MQL5 平台的私訊與我聯繫。此外,您還將獲得培訓課程「如何安裝與設定 SUPERHERO 並開始穩定獲利」的存取權限。 關於「超級英雄」策略 SUPERHERO 策略是利用價格回調時,順應趨勢方向進行盤中交易。 「超級英雄」程式碼內含數個強大的技術指標,用以分析價格通道的趨勢方向與波動範圍,並能識別在修正性回調後形成的盤中波段反轉形態。 SUPERHERO 指標採用獨特的自我優化演算法,一旦添加至價格
Advanced Supply Demand MT5
Bernhard Schweigert
4.53 (15)
任何新手或专业交易者的最佳解决方案! 该指标是一款独特、高质量、且价格合理的交易工具,因为我们已经整合了许多专有功能和新公式。 依据此更新,您将能够显示双重时间帧区域。 您不仅可以显示一个较高的时间帧,还可以同时显示图表时间帧,加上更高的时间帧:显示嵌套时区。 供需双方所有交易者都会喜欢它。 :) 重要信息披露 高级供需的最大潜力,请访问 https://www.mql5.com/zh/blogs/post/720245   想象您的交易如何得以改善,是因为您能够精准定位入场或目标位吗? 构建于新的底层算法,它可以更轻松地识别出买卖双方之间的潜在失衡。 这是因为它以图形方式展示供需最强劲区域,及其过去的表现(显示旧区域)。 这些功能旨在帮助您更轻松地发现最佳入场区域和价位。 现在您可以针对您的交易品种和时间帧来优化和编辑区域强度! 高级供需指标适用于所有产品和时间帧。 它是一个新的公式,非常新的功能是两个区域强度函数可由用户输入进行调整! 这在交易中是一大优势。 当您学习如何使用专有功能,例如带有价格游离最小 X 因子的区域强度时,您能够判断该区域强劲与否。 供需区域用作警报触发器。
Naked Forex Kangaroo Tail Pro Indicator Kangaroo Tail Pro Indicator is a pattern recognition indicator for Forex, Stocks, Indices, Futures, Commodities and Cryptos. The Kangaroo Tail is a multi-bar pattern. The Kangaroo Tail pattern is very effective and is very simple to trade. The strategy that comes with the Kangaroo Tail is based on price action. The indicator does what it was designed for: displaying Kangaroo Tail patterns.     Don't expect to follow the up and down arrows and make mone
AriFocus
Temirlan Kdyrkhan
AriFocus - Non-Repainting Buy/Sell Signals AriFocus - one clear signal. AriFocus marks buy and sell signals directly on the chart and suggests a stop-loss level for each one. Every signal is confirmed on bar close and never repaints. - Buy/sell arrows, confirmed on bar close - Suggested stop-loss level for every signal - Trend band and candle coloring to show direction at a glance - 10 ready-made presets, or your own settings (14 calculation methods) - Pop-up, push and email alerts with entr
RSI Thunder MT5
Muhammad Abdulrahman Omar Naima Allah Al-rais
RSI Thunder 是一款专为追求高胜率与高质量交易信号的交易者精心打造的专业智能交易指标。 该指标严格遵循“蜡烛收盘后确认”的原则,仅在K线完全收盘后生成信号,从根本上避免重绘和虚假入场问题。 RSI Thunder 将 RSI、EMA、ADX 和 ATR 等核心技术指标有机结合,形成一套完整、严谨的交易决策逻辑。 同时,通过 SMA40 趋势方向过滤器,确保所有交易都顺应市场的主要趋势方向。 指标会系统性地分析最近五根K线的价格结构,仅在动能、趋势和突破条件同时满足时才确认信号。 所有买卖信号都会以清晰直观的箭头形式直接显示在图表上,帮助交易者快速做出决策。 每一次信号都会自动计算基于 ATR 的止盈(Take Profit)水平,使交易管理更加科学和一致。 RSI Thunder 运行高效,占用系统资源极低,适合长时间稳定运行。 无论是新手还是经验丰富的专业交易者,都可以轻松上手并灵活应用。 该指标特别适用于 M15、M30、H1 等主流交易周期。 RSI Thunder 不仅仅是一个技术指标,而是一套成熟、可靠、可执行的完整交易系统。
Meridian Pro
Ottaviano De Cicco
4 (3)
Meridian Pro 2.00:MT5 专业多周期趋势矩阵 Meridian Pro 2.00 是面向 MetaTrader 5 的专业自适应趋势矩阵。它结合了原始 Meridian 趋势引擎、清晰的图表 ribbon、收盘柱确认箭头、8 周期 dashboard、Fuel 动量、加权共识、合成 HTF 处理,以及直接显示在当前图表上的高周期环境线。 目标很简单:在一个有纪律的 workflow 中读取当前趋势、多周期结构、强度、动量和 EA-ready 状态,而不是在多个图表上堆叠互不关联的指标。 Meridian Pro 的不同之处 一个自适应引擎 - 同一套波动率感知 Meridian 逻辑应用于 M1 到 W1。 合成 HTF 架构 - 高周期行由低周期数据推导,减少传统零售 MTF 中常见的 repaint、同步延迟和 broker-dependent HTF 质量问题。 完整矩阵输出 - Bias、Strength、Fuel 和加权 Consensus 一起显示,而不是拆成独立工具。 图表执行层 - ribbon 和箭头专注于当前周期,选配 HTF 线在同一图表上增加高
The Oracle Pro
Ottaviano De Cicco
5 (1)
The Oracle Pro:用于 MT5 的合成多周期偏向引擎 The Oracle Pro 是一款面向高要求与专业交易者的 MetaTrader 5 高级多周期 偏向引擎 。它以纪律回答一个问题:当前每个周期的方向偏向是什么、强度如何、各周期之间的一致程度如何?一切仅在已收盘的 K 线上计算——绝不重绘。 The Oracle Pro 是一套多因子共识系统。它将专有指标与优化算法整合为单一而精密的共识向量,并在单个指标实例内,跨当前周期与更高周期的堆栈进行读取——而不是在多个图表上堆叠互不相关的工具。 它是 Oracle 共识方法的专业进化版:完整重建为高级操作控制台,面向希望在一个纪律化工作流中获得深度、多周期背景与背离洞察的交易者。 是偏向引擎,而非信号生成器 The Oracle Pro 明确自身定位。它是一款提供纪律化方向背景的 多周期多因子偏向指标 。它 不是 信号生成器:不承诺入场、出场或盈利。偏向是背景——你在其方向上交易自己的设置,当共识破裂或质量低下时则按兵不动。一个诚实地说"现在不要"的过滤器,正是它说"现在可以"时你能够信赖的那一个。 为高要求交易者打造 精密
Dynamic Forex28 Navigator MT5
Bernhard Schweigert
5 (1)
多货币强度与动量指标 MT5 Dynamic Forex28 Navigator 是我们长期受欢迎的指标的演进,把五种力量合而为一: Advanced Currency Strength28 Indicator(700 条评价) Advanced Currency IMPULSE with ALERT(530 条评价) Currency Strength EXOTICS GOLD Impulse with Alert CS28 Combo Signals(当前赠品) 无需购买四个指标并把它们堆在图表上。一切都合并在一个强大的指标中:28 个 Forex 货币对的强度、引领它们的市场动量,以及两者的警报——在一个窗口中,在一张图表上。 上述程序在 MQL5 Market 上合计获得超过 1,200 条评价,自 2016 年以来一直是 MT4 社区的一部分。Dynamic Forex28 Navigator MT5 延续同样经过验证的逻辑。 为 MetaTrader 5 完全重建——专为利用 MT5 原生多品种架构而设计。 用户手册: https://www.mql5.com/en/blo
Boom Crash GainX PainX Spike Detector Overview Boom Crash GainX PainX Spike Detector is a professional analytical indicator for Deriv synthetic indices. It is designed to identify potential spike opportunities using multiple technical indicators, price movement analysis, and tick-based cycle monitoring. The indicator supports both market directions in one tool: Boom and GainX: BUY signals for potential upward spikes. Crash and PainX: SELL signals for potential downward spikes. The indicator auto
Volatility Master for MetaTrader is a real-time dashboard tool that scans up to  50 symbols  to identify high-volatility , trending markets instantly. With bullish/bearish signals, customizable alerts, and a user-friendly interface, it helps you avoid range-bound conditions and focus on high-probability trades. Clarity leads to confidence. Trade confidently and protect your capital effectively with this powerful dashboard. We don't offer free or bonus indicators in exchange of reviews from you.
作者的更多信息
Adaptive Momentum Oscillator (AMO) – Next-Gen Momentum Indicator Overview The Adaptive Momentum Oscillator (AMO) is a powerful technical analysis tool that dynamically adjusts its sensitivity to market conditions by incorporating adaptive lookback periods, noise filtering, and normalization techniques . Traditional momentum indicators use fixed lookback periods, which can lead to inefficiencies in trending and ranging markets. The AMO overcomes this limitation by adapting its calculation based o
FREE
筛选:
Alexandros Soulos
180
Alexandros Soulos 2025.03.07 00:44 

用户没有留下任何评级信息

Michail Pavlakis
476
来自开发人员的回复 Michail Pavlakis 2025.03.07 17:02
Thank you very much!!
回复评论