TwoLineMACD
- Indicatori
-
Xin You Lin
 Golden Wings
 - Versione: 1.3
- Attivazioni: 5
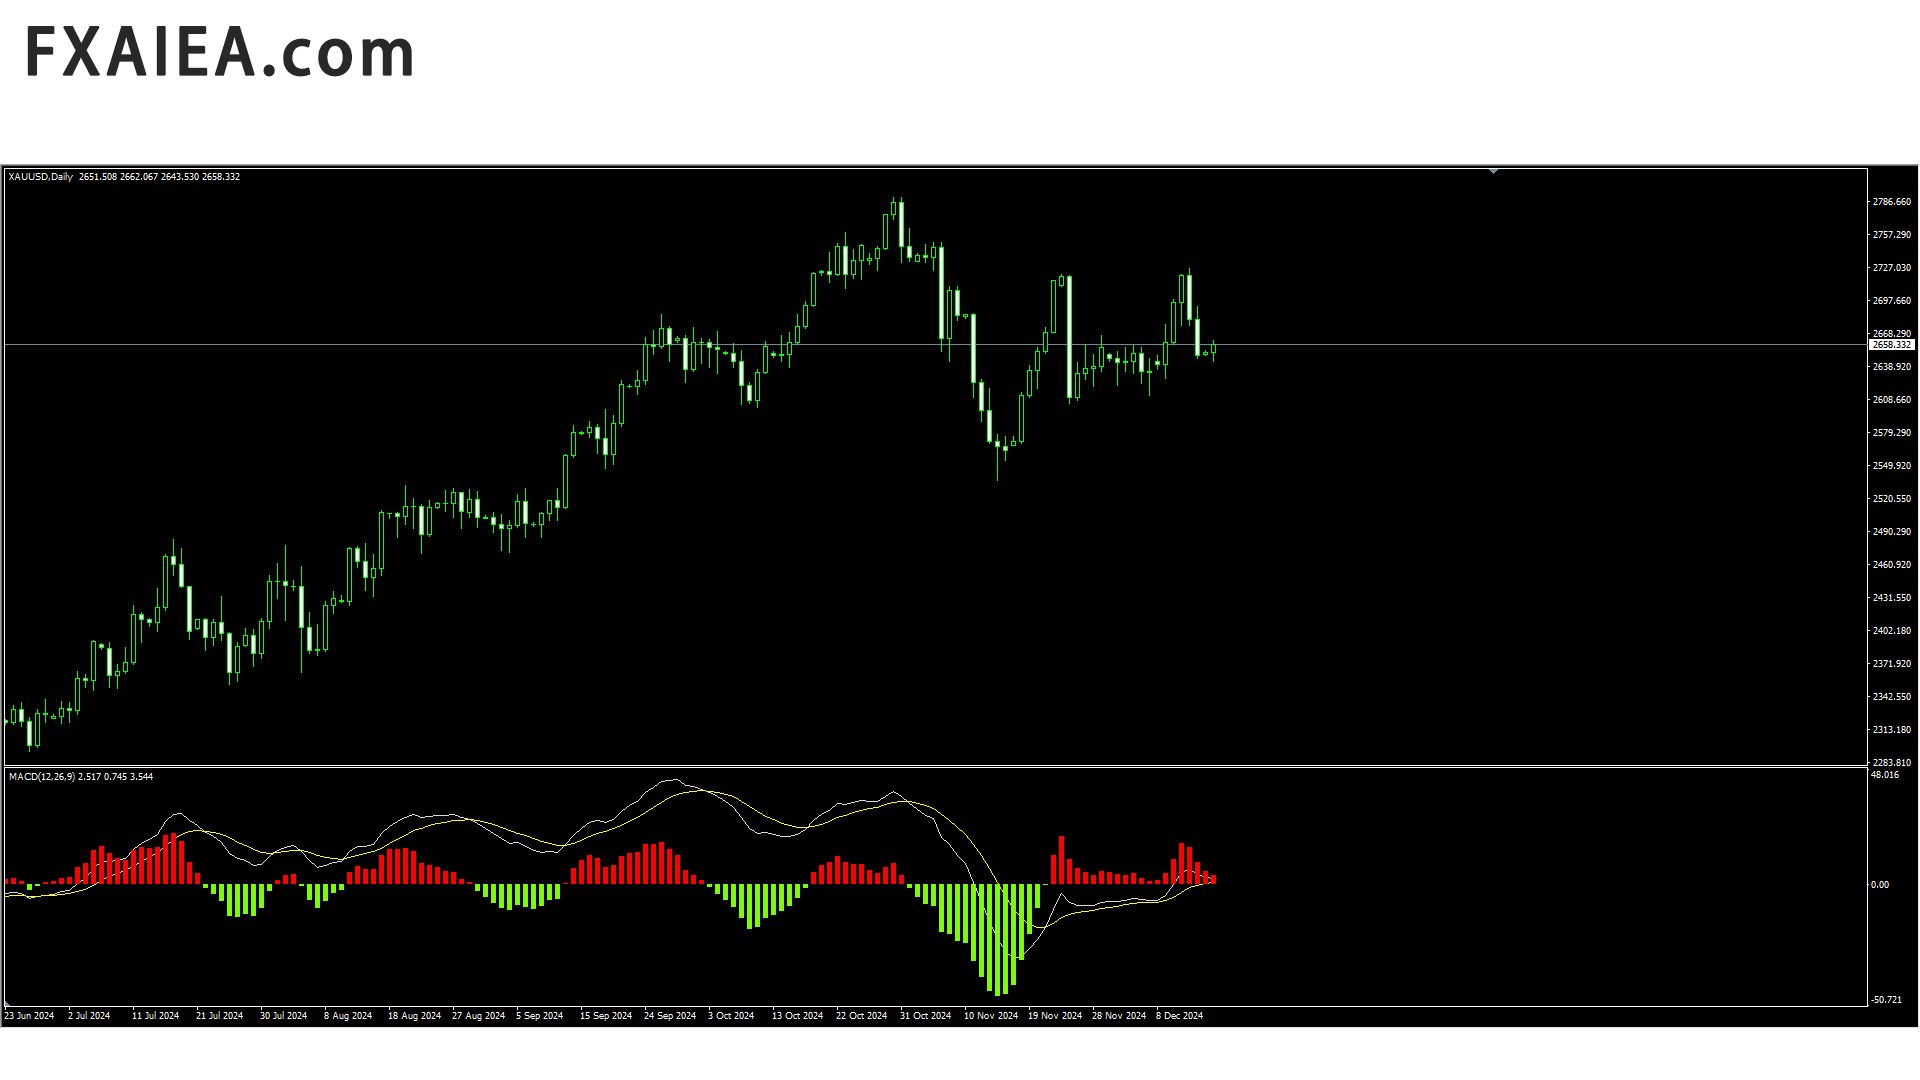
Two line MACD
index composition
MACD line (express line) : Usually calculated by subtracting the 12-cycle EMA from the 26-cycle EMA, it is more sensitive to price changes, can quickly reflect the change of the recent price trend, its fluctuation is relatively frequent, used to capture the dynamics of short-term market trends.
Signal line (slow line) : Generally a 9-cycle EMA of the MACD line, its role is to smooth the MACD line, filter out some short-term noise and false signals, make the indicator signal more stable and reliable, and show the main trend direction of the market more clearly.
Histogram: Represents the difference between the MACD line and the signal line. When the bar chart is above the zero axis and continuously extending, it indicates that the market is in a state of increasing bullish momentum. On the contrary, below the zero axis and continuously getting longer, it reflects the dominance of short momentum. The length and length of the bar chart intuitively shows the contrast and degree of change in the buying and selling forces of the market.
Install
Installation steps: On the MT4 platform, click the "File" menu and select "Open Data Folder". Go to the "MQL4" folder, then go to the "Indicators" folder, and copy and paste the downloaded two-line MACD indicator file (.mq4 or.ex4 format) into this folder. Turn off and re-open the MT4 platform, select Indicators from the Insert menu, then find the two-wire MACD indicator you just installed in the list of Custom indicators and click to add it to your chart.
Parameter setting
The default parameters of the two-line MACD indicator on MT4 are 12, 26, 9, but traders can adjust according to different trading varieties, time frames, and individual trading strategies. For example, in relatively short-term trading, such as intra-day trading, the EMA cycle can be appropriately shortened, and the parameters can be set to 6, 13, 4, etc., so that the indicator can respond more sensitively to price changes and can timely capture short-term trading opportunities. In the long-term trend tracking transaction, the parameter value can be increased, such as 20, 40, 10, etc., to filter out short-term market fluctuations and grasp the main trend direction of the market more accurately. However, parameter adjustment needs to be carried out on the basis of a full understanding of the market characteristics and the principle of indicators, to avoid excessive optimization leading to the failure of indicators in actual trading.
Transaction signal interpretation
Gold and dead crosses: When the MACD line crosses the signal line from bottom to top, a gold cross is formed, which is often seen as a buy signal, indicating that short-term market momentum is beginning to outpace long-term momentum and the market may enter an uptrend; Conversely, when the MACD line crosses the signal line from the top down, a dead cross appears, which is often a sell signal, meaning that short-term market momentum is weakened, bear forces may dominate, and the market has a downward trend. It should be noted that the gold fork and the dead fork signal may appear more false signals in the volatile market, so it is best to combine other technical analysis tools or market conditions to make a comprehensive judgment.
Zero-axis crossover: The MACD line above the zero axis indicates a bullish market, while below the zero axis it indicates a bearish market. When the MACD line crosses the zero axis from the bottom up, it is a strong bullish signal, indicating that the market may turn from bears to bulls; Conversely, when the MACD line crosses the zero axis from the top down, it is a bearish signal and the market may enter a down phase.
Bar chart changes: The elongation and shortening of the bar chart can also provide trading signals. When the bar chart is above the zero axis and gradually extending, indicating that the strength of the bulls is increasing, you can consider continuing to hold long positions or buying dips; If the bar chart is above the zero axis but begins to shorten, it may indicate that the momentum of the bulls is weakening, there is a risk of correction, and the position can be appropriately reduced to profit. Below the zero axis, the extension of the bar chart indicates the strengthening of the bear power and is suitable for short selling on rallies; A shortened bar chart may indicate that bear momentum is exhausted and the market is likely to reverse.