 MetaTrader 5
 Experts
 Indicateurs
 Bibliothèque
 Utilitaires
 Widgets
 Règles
Regardez les tutoriels vidéo de Market sur YouTube
Comment acheter un robot de trading ou un indicateur
Exécutez votre EA sur
hébergement virtuel
hébergement virtuel
Test un indicateur/robot de trading avant d'acheter
Vous voulez gagner de l'argent sur Market ?
Comment présenter un produit pour qu'il se vende bien
Nouveaux indicateurs techniques pour MetaTrader 5 - 193
 Les signaux provenant des indicateurs techniques jouent un rôle crucial dans l'ouverture et la clôture des transactions sur les marchés boursiers et les marchés forex. L'essence des indicateurs est une transformation mathématique du prix d'un symbole financier visant à prévoir les changements de prix futurs. Testez les indicateurs techniques pour mieux prédire le comportement du marché et en tirer profit.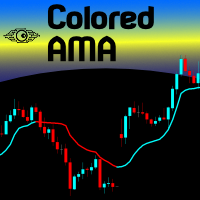
If you like to use traditional Moving Averages (like SMAs and EMAs) to provide your trades for dynamic levels of Support and Resistance, you will love the Adaptive Moving Average (AMA). Created in 1995 by Perry Kaufman and presented to the world in his book " Smarter Trading : Improving Performance in Changing Markets ", the Adaptive Moving Average (also known as KAMA - Kaufman Adaptive Moving Average) has the goal to be the perfect companion for following a trend without noise, but s
FREE

Indicator with 3 features
- Clock : Clock independent of the chart, counting continues even when the market is closed.
- Template : After setting up a configuration in any graphic, be it color patterns, indicators, zoom ... The configuration will be copied to all active graphics.
- TimeFrame : Set the TimeFrame on a chart, and with just one click all the active charts will be changed to the same TimeFrame.

Qstick is a way to objectively quantify candlestick analysis and improve the interpretation of candlestick patterns. Qstick was developed by Tushar Chande and published in his book " The New Technical Trader - Boost Your Profit by Plugging Into the Latest Indicators (1994) ". Qstick is built based on a moving average of the difference between the Open and Close prices. The basis of the idea is that the Opening and Closing prices are the heart of candlestick analysis. We strongly recommend the re
FREE

This indicator is an utility for have always under control, how much time is left at the end of the bar setted.
The utility show on the lower right of the chart, the countdown to the end.
When the remaining seconds is = to the seconds set in the input, the color of remaining seconds on chart, change color and play a warning sound to warn you that the bar is about the end. When the remaining seconds is < to the seconds set in the input, the utility play a beep to warn you that the bar is in co
FREE

Utility for show on charts the visual informations about:
- a vertical line at start of each bar of selected timeframe
- a vertical line at start of each day
- a vertical line at start of each week
- vertical lines at start / end of trading sessions selected
- bid / ask prices, spread, money value for each point (of 1 standard lot) and last tick time recived"
You can enable / disable each information and set the color for each line
FREE
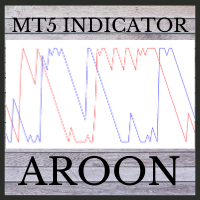
This indicator is powerful for detecting the trend.
The crossing between to line is the entry signal. Buffer 0 is UP line. Buffer 1 is DOWN line. Note: 1. Aroon is great tool for trending detecting. Please try to select the best period for each instrument.
Input AroonPeriod =14- Aroon period
MailAlert =false- Send email when entry signals appeared.
SoundAlert =false- Notify on MT5 platform.

Renko is a timeless chart, that is, it does not take into account the time period, but the price change, which makes the price change on the chart clearer.
Hyper Renko is the indicator that provides this.
To configure, you only have one parameter, the size of the candle in the tick * you want to use.
* tick: is the smallest possible variation of an asset.
Thank you for choosing a Hyper Trader indicator.
Wikipedia: A renko chart indicates minimal variation in the value of a variable - for e
FREE

The Hyper Force indicator, originally created in 1984 by David Weis, indicates in wave form the strength of a symbol's trend.
The bigger the wave, the stronger the trend.
Small waves mean weak trend or market without trend.
In a wave, the greater the difference between one bar and another, the stronger the trend.
When the distance between one bar and another begins to decrease, it means that the wave has started to lose its tendency.
So catching the wave with a strong force and going out w
FREE

Representation of the intercept value of the linear regression and the mean absolute deviation symmetrically to the intercept value.
PARAMETERS
• Periods: number of periods to calculate linear regression
• Amplitude: multiplier of the absolute mean deviation to define the bands
• Displacement: displacement on the horizontal axis
• AppliedPrice: price on which the calculations are made
• MainPlot: display of the main plot
• UpperPlot: display of the upper band
• Lowe
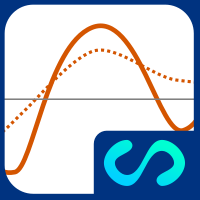
Representation of the slope value of the linear regression. It has a reference plot to visually determine changes in the slope value (acceleration / deceleration of the price).
PARAMETERS
• Periods: number of periods to calculate linear regression
• PeriodsReference: number of periods for the calculation of the moving average on the values of the main plot
• Displacement: displacement on the horizontal axis
• AppliedPrice: price on which the calculations are made
• MainPl
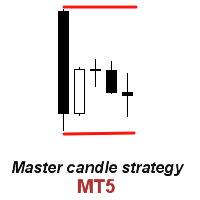
Cet indicateur reconnaît un type spécial de formation de barre intérieure qui est formée d'une grande bougie principale suivie de 4 bougies plus petites (veuillez consulter l'explication de la stratégie ci-dessous). Caractéristiques Trace les lignes d'arrêt d'achat/vente sur le graphique ainsi que les niveaux de profit et d'arrêt de perte. Les niveaux TP/SL sont basés sur l'indicateur Average True Range (ATR). Les couleurs des objets sont modifiables. Vous envoie une alerte en temps réel lorsqu'
Introduction to Fibonacci Volatility Indicator Volatility indicator can help you to detect any statistical advantage for your trading. Especially, if you are trading with Price Action and Price Patterns, then we recommend to use the Volatility indicator together with your strategy. Especically, Fibonacci Volatility indicator combines the market volatiltiy with Fibonacci Analysis to provide you more advanced volatiltiy indicator. Main Features Fibonacci Volatility in Z score Configuration Mode Fi

The Metatrader 5 has a hidden jewel called Chart Object, mostly unknown to the common users and hidden in a sub-menu within the platform. Called Mini Chart, this object is a miniature instance of a big/normal chart that could be added/attached to any normal chart, this way the Mini Chart will be bound to the main Chart in a very minimalist way saving a precious amount of real state on your screen. If you don't know the Mini Chart, give it a try - see the video and screenshots below. This is a gr
As a tribute to all the "quants" and "quantums" in this market who promise to make you rich quickly and easily, my ADR Dashboard is now just $39 — until summer is over, or perhaps a little longer. It won't make you rich quick, but it gives you a perfect view of the potential trading ranges of an asset. The intention of the dashboard is to provide a quick overview of the daily, weekly and monthly range of configured assets. In "single asset mode" the dashboard shows you possible reversal points

Thread indicator is calculating possible values for the upcoming periods. It is built by author’s system, with ability to learn. Input data ( recommended interval ): Sensitivity to oscillatory motion (integer value, 0 - 8) increase of value shifts priority of calculation towards high-frequency vibrations (increase loads the system) Shift of diagram (integer value, 0 - 8) shifts output of indicator to the right Diagram forecast (integer value, maximum 10) defies the number of periods calculated
FREE

Join Deriv link on profile>>>
The best time to trade Using this Indicator is when the time reach exactly hour,half,45 minutes,15 minutes and sometimes 5 minutes..
This indicators is helpful to those who trade boom and crash indecies.How to read this indicator first you'll see Blue allow and Red allow all these allows used to indicate or to detect the spike which will happen so the allow happens soon before the spike happen.This indicator works properly only in boom and crash trading thing wh

The Mercadulls Indicator gives to you many signals types, detecting supports, resistances and accumulation/distribution zones. The indicator constantly checks the graph for direct analysis and the appearance of long trends. Main characteristics No repaint! Stop loss and take profit levels are provided by the indicator. Suitable for Day Traders, Swing Traders, and Scalpers. Optimized algorithm to increase the accuracy of signals. Technical analysis indicator for all assets available in the m

An algorithm to detect a spike instantly with zero lag.. Use default settings for "Crash And Boom" This smart algorithm detects a spike, which can be use to filter out market spikes, give entry signals with exit. Trading:- Booming for Boom and Crashing for Crash
Spike Signal:- The less you decrease the more signals
Multiplier:- This multiplies the Signal
Time Ratio:- For adjusting the Signal
AlertProperties = "====== Alert Properties ======";
SendAlertViaAlertWindow:- if set to true it will mak
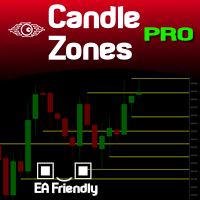
You probably heard about Candlesticks behaviors, which in most of the times could denote and trace Volume behaviors even if you are not watching Volume itself... Well, this indicator will do this. Naked traders love to rely solely on candlesticks patterns and with Candle Zones you can trap special patterns and DRAW THEM on your chart. As simple as that. There are several filters you can tweak in order to achieve the analysis you want. Just give it a try. After several months of testing, we think

AKT for MT5 (Traders Club)
機能: MAゴールデンクロスで買いサイン、デットクロスで売りサインを表示します。 MAの期間は短期足と長期足を入力できます。 MAの種類を選択できます。(SMA、EMA、SMMA、LWMA) 適用する価格を選べます。(CLOSE,OPEN,LOW,HIGH,MEDIAN,TYPICAL,WEIGHTED) サインをアラートで通知します。 サイン発生をE-mailやSNSで通知します。 表示するサインを変更することが出来ます。
サインの色を変更することが出来ます。
サインの表示された時間と価格が表示されます。
※価格は終値になります。
Indicator Noを変えることによるこのインジケータを複数適用することができます。
これにより違う MAの期間による ゴールデンクロスと デットクロスのサインを
表示できます。

Индикатор построен на основе индикаторов VIX и RSI. Комбинация двух указанных индикаторов позволяет обнаруживать зоны крайней перепроданности, где цена с большой долей вероятности изменит направление. Наиболее сильные сигналы дает в периоды слабого тренда. Сигналом индикатора является изменение направления гистограммы (с роста на снижение) выше заданного (сигнального) уровня.
В индикаторе задан широкий спектр параметров, который позволяет оптимизировать индикатор для торговли любыми активами: П

Currency Strength Meter is the easiest way to identify strong and weak currencies. The indicator shows the relative strength of 8 major currencies: AUD, CAD, CHF, EUR, GBP, JPY, NZD, USD.
By default the strength value is normalised to the range from 0 to 100 for RSI algorithm: The value above 60 means strong currency; The value below 40 means weak currency;
The indicator is created and optimized for using it externally at an Expert Advisors or as a Custom Indicator inside your programs. Fo

Oscillateur de tendance avec système de filtrage avancé. Il détermine la tendance, son affaiblissement et son renforcement. Possède un panneau multi-période intégré. AW Trend Oscillator fonctionne sur toutes les périodes et sur tous les symboles (devises, indices, pétrole, métaux, actions). Version MT4 -> ICI / Résolution de problèmes -> ICI Caractéristiques et avantages:
Filtrage avancé des tendances Modification de la sensibilité de l'indicateur en un clic Installation facile Panel multi-pér
This multi symbol indicator has been designed to automatically identify when price reaches major psychological levels. Also known as round numbers, whole numbers or key levels. As a bonus it can also scan for pivot point level on one selected time frame. Combined with your own rules and techniques, this indicator will allow you to create (or enhance) your own powerful system. Features Can write the signals to a file which can be used by an Expert Advisor for auto trading. Can monitor all symbols
SETI is a Break indicator multipair searching SETI is a powerful indicator of for any par and any timeframe. It doesn't requires any additional indicators for the trading setup.The indicator gives clear signals about opening and closing trades. This Indicator is a unique, high quality and affordable trading tool. Can be used in combination with other indicators Perfect For New Traders And Expert Traders Low risk entries. Never repaints signal. Never backpaints signal. Never recalculates
Buy and sell signals based on Larry Williams's exponential moving average strategy 9.4 for failed reversals and trend continuation.
How does it work?
For an uptrend, we need a candle turning the 9 period EMA down and closing below it, followed by a candle turning the 9 period EMA up and closing above it, with a low higher than the previous candle's low. For a downtrend, we need a candle turning the 9 period EMA up and closing above it, followed by a candle turning the 9 period EMA down and cl
Buy and sell signals based on Larry Williams's exponential moving average strategy Setup 9.2 for trend continuation.
How does it work? The indicator activates the buy signal when a candle closes below the previous low while maintaining the 9 period EMA's upwards. For a sell signal, we need a candle closing above the previous high while maintaining the 9 period EMA's downwards.
How to use it? One way of using it, proposed by Larry Williams, is to enter a trade with a buy stop order one tick
Buy and sell signals based on Larry Williams's exponential moving average strategy 9.3 for trend continuation.
Who is he? Larry Williams is an American stock and commodity trader, author of 11 books and creator of indicators such as the "Williams%R" and the "Ultimate Oscillator", with over 60 years of trading experience. Won the 1987 World Cup Championship of Futures Trading, turning $10,000 to over $1,100,000 in 12 months with real money. Ten years later, his daughter Michelle Williams won th

Tops & Bottoms Indicator FREE Tops abd Bottoms: An effective indicator for your trades
The tops and bottoms indicator helps you to find ascending and descending channel formations with indications of ascending and/or descending tops and bottoms. In addition, it show possibles opportunities with a small yellow circle when the indicator encounters an impulse formation.
This indicator provide to you more security and speed in making entry decisions. Also test our FREE advisor indicator:
FREE
Dragon SuperTrend OB indicator
he Dragon was an indicator developed to capture a new beginning of the trend, it is excellent in Binary Options and Forex and even B3 in the Mini Index and Mini Dolar. It has 4 trend levels in 4 different Times Frames, so you can be sure that you are on the right side of the trend! It is very simple and easy to use, in the end I explain how we will operate with the indicator!
Confirmation modes First Line Trend Confirmations: Green Square Upward Trend. Red Squar
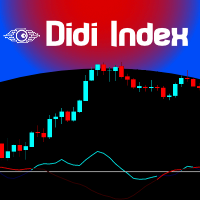
The famous brazilian trader and analyst Didi Aguiar created years ago a study with the crossing of 3 Simple Moving Averages called "Agulhada do Didi", then later was also named Didi Index, as a separate indicator. The period of those SMAs are 3, 8 and 20. As simple as that, this approach and vision bring an easy analysis of market momentum and trend reversal to those traders looking for objective (and visual) information on their charts. Of course, as always, no indicator alone could be used wit
FREE
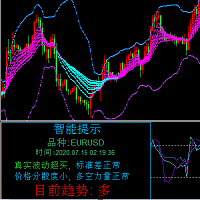
这是一个组合指标分析趋势、支撑阻力、买卖点。运用了均线MA、布林带、KDJ、CCI、RSI。
主图上下线是布林带上下线,采用的是20周期和2.3标准差可以用来支撑阻力。 中间的是分析趋势的均线,趋势分析是用均线多周期: 为涨趋势,反之为下跌趋势。在同一种颜色,基本说明趋势没有发生变化。 子图是由 KDJ、CCI、RSI三个指标组成,大于70超买,小于30超卖, 智能提示是运用了算法,主要计算布林带, KDJ、CCI、RSI指标
有三个或四个指标超出市场常态就会发出提示行情可能反转。 子图指标运用了很多数据,刚刚开始加载会有点慢,耐心等待就可以 这个指标是子图指标,还要再下我发布的MMB分析,这样就刚刚好组成一套分析
电脑分辨率的文本大小请设置100%,不然字体会不一样
FREE
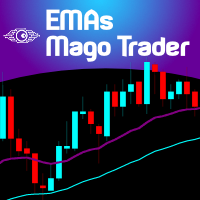
For those traders and students who follow the famous brazilian trader Igor Rodrigues (Mago Trader) here it is his famous 2 EMAs - based on Phi ratios - and packed with a twist: a Filling Area , to easily and visually spot the corresponding trend on the chart. You can turn On and Off this filling. If you don't know Igor Rodrigues and you are a brazilian trader and student, just google for him... Very simple and useful indicator.
If you are looking also for the MACD -based indicator of this trade
FREE
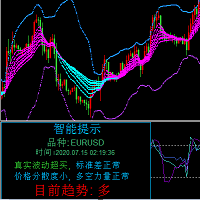
这是一个组合指标分析趋势、支撑阻力、买卖点。运用了均线MA、布林带、KDJ、CCI、RSI。 主图上下线是布林带上下线,采用的是20周期和2.3标准差可以用来支撑阻力。 中间的是分析趋势的均线,趋势分析是用均线多周期: 为涨趋势,反之为下跌趋势。在同一种颜色,基本说明趋势没有发生变化。 子图是由 KDJ、CCI、RSI三个指标组成,大于70超买,小于30超卖, 智能提示是运用了算法,主要计算布林带, KDJ、CCI、RSI指标
有三个或四个指标超出市场常态就会发出提示行情可能反转。 子图指标运用了很多数据,刚刚开始加载会有点慢,耐心等待就可以 这个指标是主图指标,还要再下我发布的RCD分析,这样就刚刚好组成一套分析 电脑分辨率的文本大小请设置100%,不然字体会不一样
FREE

For those traders and students who follow the famous brazilian trader Igor Rodrigues (Mago Trader) here it is another tool he uses: a 2-line MACD specially set with Phi ratios. This MACD is packed with a twist: a Filling Area , to easily and visually spot the corresponding trend on the chart. Obviously, you can turn On and Off this filling feature. If you don't know Igor Rodrigues and you are a brazilian trader and student, just google for him... Very simple and useful indicator.
If you are loo
FREE
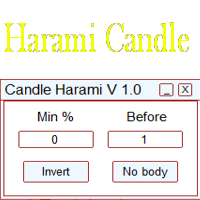
Это простой индикатор, показывающий формирование свечей харами. Входные параметры:
Min % - минимальный процент харами Before - количество свечей до сигнала Invert - инвертировать сигналы No Body - свечи без тела Length - настройка для отображения сигналов В индикаторе есть встроенный фильтр по количеству свечей до сигнала и минимальному проценту харами. Более подробно о настройках индикатора можно прочитать на моем сайте.
MTF-MA2 for MT5 特徴: MTF Moving Averageを8本一気に表示してくれるインジケータになります。 8本も必要ない場合にももちろん非表示にできます。
パフォーマンスを考慮しているのでチャートが重くなるようなことは 無いはずになります。どの通貨でも使用可能になります。 それぞれのMTF Moving Averageの色や太さを変更できます。
各パラメータの説明: Method:MAの種類設定をします。 Applied price:MAで使用する価格を設定をします。 TimeFrame M5:使用するMAの時間足を設定します。 Period M5:使用するMAの期間を設定します。 ※ラベルに関係なく8本のMTF MAはどの時間足でも期間設定可能になります。
Limited bar?:表示に使用するバーを制限するかどうかを設定します。 ※ここをFalseにするとすべてのバーを読み込むことになるのでチャートが重く なるかもしれません。ご注意ください。 Max bars:使用するバーの本数を設定します。過去検証をする場合にはここの値を増やしてくだ

MTF-Candlestick (Traders Club)
特徴: このインジケータは上位足のローソク足を表示します。 この上位足のローソク足を表示のインジケータは特に1分足や 5分足トレーダ用に開発されたものになります。
現在のローソク足で上位足のローソク足を作成する部分 と過去の上位足のローソク足を作成する部分を 分けています。また、更新はティックごとではなく 指定した時間ごとになるので急な価格変動があった場合でも チャートがフリーズした状態には非常になりにくいということになります。
陽線や陰線の色を変更出来たり髭の太さを変更できるので非常に 見やすと思います。
各パラメータの説明: Indicator No:インジケータNoを設定します。もし同じチャートに複数適用したい場合には個々の数字を変更してください。 TimeFrame:表示する時間足を設定します。 Bullish candlestick color:陽線のローソク足の色の指定します。 Bearish candlestick color:陰線のローソク足の色の指定します。 Doji candles
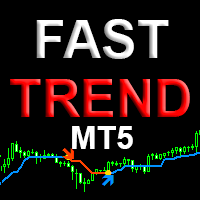
Fast trend - профессиональная версия индикатора определения направления тренда и точек входа. Индикатор с высокой вероятностью определяет направление тренда на любых валютных парах, акциях, криптовалюте без перерисовки результата. Для определения тренда использует Price action и авторский уникальный алгоритм фильтрации. Подходит для всех видов торговли, как для скальпинга так и для долгосрочной торговли. Данная версия индикатора это другая ветка эволюции алгоритма индикатора Simple Trend
The indicator tracks the trend in 5 different chart times for the same asset, based on 6 signals for each chart time.
The main objective of the indicator is to show us the majority trend of the financial asset in which it was placed. The system transmits the information of the trends in several graphic times, in this way the user is able to have a broad view of the movement of the asset, this type of tool makes the user have a higher hit rate by helping the operator to execute orders in favor o
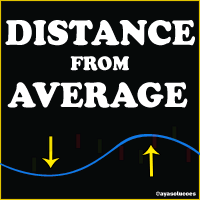
Indicator designed to measure the distance from the price on a given moving average.
The indicator, in addition to displaying the value of the spacing, has an average of the spacing itself, to assist and confirm analyses. Both the type of the average and the average on which the spacing value will be calculated, as well as the spacing average, are parameterizable.
With the option "SET AUTO LEVEL AND SHOW SIGNALS" enabled, the indicator displays buy and sell signals on the graph. Buy and sell
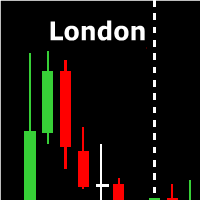
The Market Time indicator shows in a simple and objective way the opening hours of the main exchanges in the world. Define the number of days to be displayed and choose the options available for the appearance of each vertical line of each market in the indicator. With this Market Hour indicator you will be able to see the opening hours of the main markets in the world more easily and quickly. Note that the opening time of each market to be inserted in the indicator is the time of your broker's

Indicator developed in order to notify the user when the RSI enters and leaves the overbought and oversold regions, the information is shown in the form of audible and text alerts. Notifications can be disabled at any time. The indicator period can be changed by the user, and it is possible to insert the RSI indicator in the graph through the alerts. Aurélio Machado
FREE
I recommend you to read the product's blog (manual) from start to end so that it is clear from the beginning what the indicator offers. This multi time frame and multi symbol indicator scans for engulfing and tweezer formations. The indicator can also be used in single chart mode. Combined with your own rules and techniques, this indicator will allow you to create (or enhance) your own powerful system. Features Can monitor all symbols visible in your Market Watch window at the same time. A

this indicator is a Spike detector indicator, it is specially designed to trade Boom 1000, Boom 500, Crash 1000 and Crash 500 We recommend using it on Deriv Boom and Crash indices only Its setting is intuitive, familiar, easy to use it has notification functions; audible notifications and push notifications. this tool is simple to use, easy to handle This update is based on different strategies for spikes
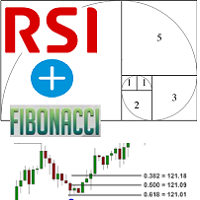
Fibonacci and RSI.
The indicator is a combination of the Fibonacci and RSI indicators.
Every time the price touches one of the fibonacci levels and the rsi condition is met, an audible alert and a text alert are generated.
Parameters number_of_candles : It is the number of candles that will be calculated. If you put 100, the indicator will give you the maximum and minimum of the last 100 candles.
sound_signal: If you want the indicator to notify you that the conditions are met using an aud
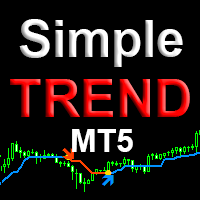
Simple trend mt5 is a professional version of the trend indicator and entry points. It uses Price action and a unique filtering algorithm to determine the trend. Shows the change in the direction of price movement on any currency pairs, without redrawing the result. Suitable for determining entry points for scalping and swing, as well as for intraday, medium-term trading. Features Marks trend reversal locations and directions. Suitable for all types of trading, in any markets. Allows you to en

The Tik Tok indicator was created on the basis of the original extreme search indicators, the indicator is well suited for determining a reversal or a big sharp jerk in one direction, thanks to it you will know when this happens it will notify you when a blue dot for buying red for sale appears.
It basically uses the process of detecting the rate of change in price growth and allows you to find entry and exit points from the market. fundamental technical indicator that allows you to assess the

The Trend Rendezvous indicator searches for and displays pivot points on the price chart. The goal, which was pursued during its creation, is to obtain signals that will produce less noise and respond more quickly to price changes. The Trend Rendezvous indicator is a trend indicator that is used to search for reversals in the breakdown of its borders. The indicator is its signal and has one interesting property. It is necessary to take into account that this indicator reflects extrema and shoul

The implementation of the Trend Self trend indicator is simple - in the form of two-color lines. The indicator will help users determine the direction of the trend. It will also become an indispensable adviser for entering the market or for closing a position. The indicator algorithm is based on standard indicators as well as their own mathematical calculations.
How to read information from the indicator. We buy when the color of the indicator line changes from pink to green. Hold a long p
Fundamentação teórica A VWAP é uma média móvel ajustada pelo volume, ou seja o peso de cada preço corresponde ao volume de ações negociadas no período, dando mais importância ao período em que se tenha mais negociações. [1] VWAP = sum(price[i]*volume[i]) / sum(volume[i]) Metodologia É possível configurar o período que será utilizado para o calculo da VWAP, a cor, a espessura e o estilo da linha. A linha é desenhada desde a o começo da série disponível apenas uma vez para economizar recursos com
FREE
SYSTEM INTRODUCTION: The Binary Options Conqueror System Is Specifically Designed For Binary Options Trading. Unlike Other Systems And Indicators That Were Adopted From Other Trading Environments For Binary Options. Little Wonder Why Many Of Such Systems Fail To Make Money . Many End Up Loosing Money For Their Users. Forward Testing Of The System Has Shown Remarkable Results . The Results Of Forward Testing On Live Trading Account Is Consistent With The Results Obtained By Back Testing .

パラボリックのデータをもとにトレンドの方向性を1分足から月足まで表示します。 1分足から 月足 まで表示されているので今どの方向に価格が動いているのかがすぐに分かります。
更新はティク毎ではなくディフォルトでは1秒毎、もちろん変更も可能なのでチャートの表示が遅くなるようなことはありません。
機能:
どの通貨でも表示可能になります。
アイコンの色を指定することが可能になります。
表示位置(X軸、Y軸)が変更可能 になります。
表示位置 (左上 、 右上 、 左下 、 右下) が 指定 が可能 になります。
フォント を指定することが可能になります。
フォントサイズ が 変更可能 になります。
アイコンのサイズ が 変更可能 になります。
週足、 月足 の非表示 が 可能 になります。
FREE

the indicator will show signal arrows on the graph at the crossing of a given level it has push and audible alerts. By crossing from low to high level 0.3, a blue arrow will come out for the purchase, at the same time an audible signal will sound. By crossing from low to high level 0.7, a red arrow will come out for the sale, at the same time an audible signal will sound. Possibility to deactivate push and audible alerts. MT4 version of this product here

ichimoku indicator with alert; audible alert, email alert, push alert you can enable or disable the settings as you wish When there is a crossing of tenkansen and kijun you will get an alert When there is a cross between Senkouspan A and Senkouspan B you will get an alert Affordable sound settings possibility to modify the parameters of the ichimoku indicator
The Martinware Direction by Candle Body Analysis indicator is a direction indicator that shows the current asset direction, up or down, by checking if previous candle bodies' bases were respected or broken. It works similarly to a moving average, but it's more objective due to its lesser amount of configuration parameters.
The algorithm assumes the theory that although the highs and lows of candles have their value, it is the body that shows the conclusive market sentiment over that asset in

Indicator that uses ATR and standard deviation to calculate the current trend. It has the top and bottom line. The top line is shown when it is high, and the bottom line when it is low. The indicator does not draw a trend line or show the trend for the day, or for a certain period. It has the function of indicating the current trend, and may indicate a reversal.
use it with caution and at your own risk.
FREE
516/5000 Average volume indicator to calculate the average volume for a given period. Useful as a filter to measure the strength of a trend, or false breaks in support or resistance.
It does not give a signal to buy or sell, it only acts as a filter to avoid entering into transactions with a drop in volume, or below-average volume, which may indicate disinterest in trading at the price level.
It has only the parameters of period, method of calculating the average and type of volume.
It h
FREE

Take a Break Indicator gives any chart its own protection rules: pause before news, stop after a daily loss, trade only during your hours, or pause when your own indicator condition is true. News filter, drawdown protection, time filter and custom indicator rules per chart. It is the free companion of the Take a Break EA, which does the pausing for the whole account. Rules you can set per chart Custom indicator rules (MetaTrader 5): put any indicator on the chart and write a condition. RSI>70 ,
FREE

What are Donchian Channels? Donchian Channels are three lines generated by moving average calculations that comprise an indicator formed by upper and lower bands around a mid-range or median band. The upper band marks the highest price of a security over N periods while the lower band marks the lowest price of a security over N periods. The area between the upper and lower bands represents the Donchian Channel. Career futures trader Richard Donchian developed the indicator in the mid-twentieth c
FREE

The OCTO Indicator is a new and easy to use zero-crossing trend/trend reversal indicator that provides entry signals for both long and short positions. It is based on High/Low divergence and correlation of the values over time.
Reliability of the indicator has been backtested with an example trading robot.
How to use The OCTO indicator is added in a separate window, showing a red and a green indicator line, as well as the zero line for crossing. You can see an example of the standard look and
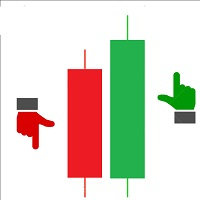
Maximum Minimum Candle indicator is a basic indicator (but useful) that shows the highest and lowest candle in a period of time .
The indicator shows the maximum candle and the minimum candle for a defined period of time. You can choose the number of candles that make up the period The indicator will show with color points the maximum and minimum values. A message tells you when the price reaches the maximum or minimum.
Parameters number_of_candles: It is the number of candles that will be c
FREE
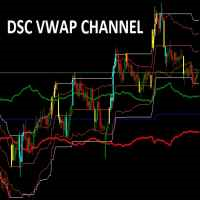
Indicador usado para sabermos os pontos de suporte de resistência no gráfico.
Funciona em todos ativos e timeframes.
Acerte exatamente os pontos de entradas e saídas das suas operações. SEE OUR RESULTS ON INSTAGRAM: https://www.instagram.com/diogo.cansi/ TELEGRAM GROUP = https://t.me/robosdsc More information by email dscinvestimentos@gmail.com or by Whatsapp 55-991372299
FREE
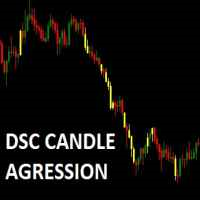
Corretora recomendada para usar esse indicador: https://tinyurl.com/5ftaha7c Indicador que pinta o candle de amarelo em pontos de muita agressão no mercado. Sempre que o mercado for se movimentar o candle irá ficar amarelo. Valido para todos ativos e todos timeframes. SEE OUR RESULTS ON INSTAGRAM: https://www.instagram.com/diogo.cansi/ TELEGRAM GROUP = https://t.me/robosdsc More information by email dscinvestimentos@gmail.com or by Whatsapp 55-991372299
FREE

Trend Line Map indicator is an addons for Trend Screener Indicator . It's working as a scanner for all signals generated by Trend screener ( Trend Line Signals ) . It's a Trend Line Scanner based on Trend Screener Indicator. If you don't have Trend Screener Pro Indicator, the Trend Line Map Pro will not work. LIMITED TIME OFFER : Trend Line Map Indicator is available for only 50 $ and lifetime. ( Original price 125$ )
By accessing to our MQL5 Blog, you can find all our premium indicat

Description The indicator uses market profile theory to show the most relevant trading zones, on a daily basis. The zones to be shown are LVN (low volume nodes) and POC (point of control). An LVN zone is one which represents price areas with the least time or volume throughout the day. Typically, these areas indicate a supply or demand initiative, and in the future, they can turn into important breakout or retracement zones. A POC zone is one which represents price areas with the most time or vo
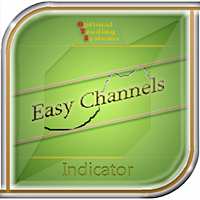
This indicator draws price channels. Easy to use. It has various settings, for example, you can configure it to show channels only for buy or sell, you can display trend lines instead of channels. There are many trading strategies that are based on trading in channels, you can trade on the rebound from the borders of the channels, or the breakdown of the channel. Parameters History - the maximum number of bars for building channels; Distance - the minimum distance from one maximum (or minimum

The Martinware Volume indicator plots a colored moving average over volume bars. The coloring uses three colors and can be done in different ways choosable by the user and is applied both to the average as to the volume bars.
Three types of coloring are possible: None: no coloring is done Increasing or decreasing: changes the color depending on the current value being bigger or lesser than the previous one Volume relative to average: colors vary if the current volume is bigger or lesser then
FREE
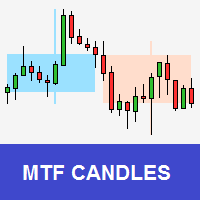
Tool that allows viewing candles in multiple timeframes. This way, it helps the analysis in multiple timeframes.
This is another product developed by Renato Fiche Junior and available to all MetaTrader 5 users!
Input Parameters
- Option 1 - TimeFrame: Standard MT5 timeframe - Option 2 - Custom TimeFrame (in minutes): Or, if this value is different from zero, the timeframe will be customized. This allows you to choose timeframe other than the MT5 standard. - Total Candles: Number of candles. -
FREE
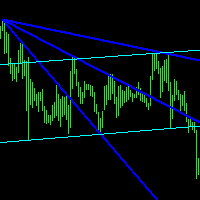
Description
Reverse Rayer is an indicator that draws rays on inclined trend levels.
Recommendations
You can use this indicator to determine the trend and, accordingly, to determine the direction of opening a position or closing an opposite position.
Parameters
===== _INDICATOR_SETTINGS_ ===== - indicator settings Maximum History Bars - maximum number of history bars for calculating the indicator. Average True Range Period - ATR indicator period (used to calculate the difference between
Le MetaTrader Market est le meilleur endroit pour vendre des robots de trading et des indicateurs techniques.
Il vous suffit de développer une application pour la plateforme MetaTrader avec un design attrayant et une bonne description. Nous vous expliquerons comment publier votre produit sur Market pour le proposer à des millions d'utilisateurs de MetaTrader.

Vous manquez des opportunités de trading :
- Applications de trading gratuites
- Plus de 8 000 signaux à copier
- Actualités économiques pour explorer les marchés financiers
Inscription
Se connecter
Vous acceptez la politique du site Web et les conditions d'utilisation
Si vous n'avez pas de compte, veuillez vous inscrire