TransitKiller
- 指标
- 版本: 1.0
- 激活: 5

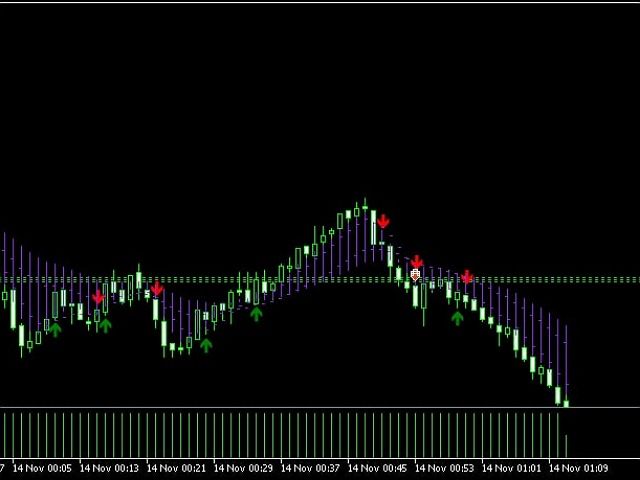
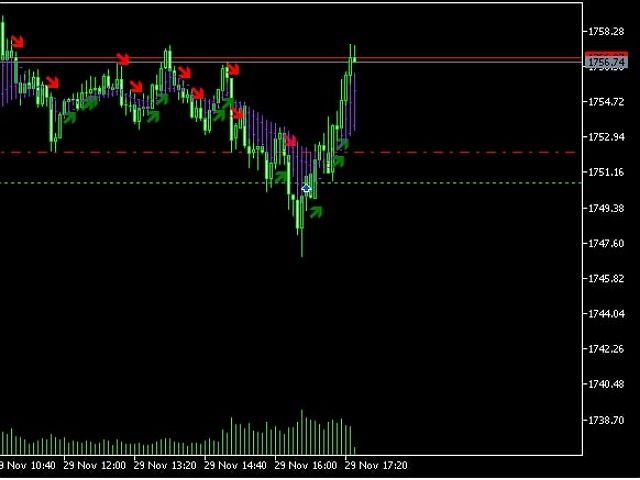
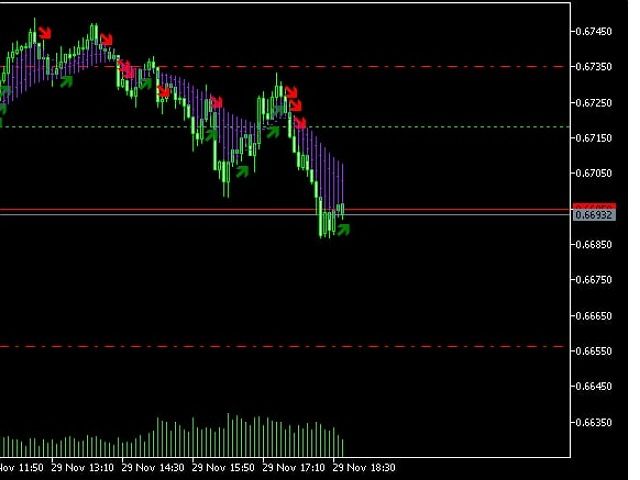
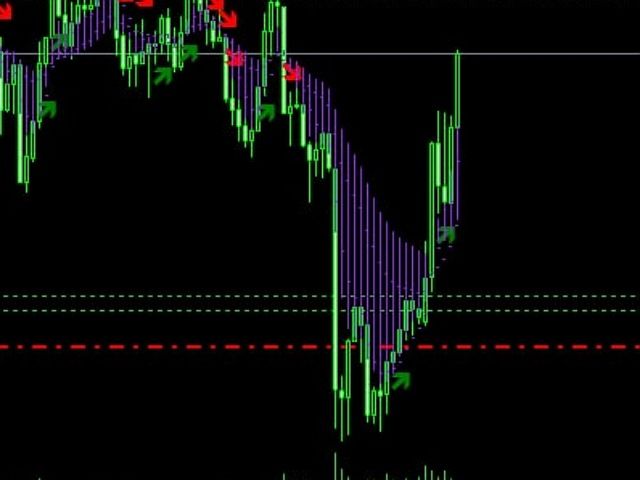
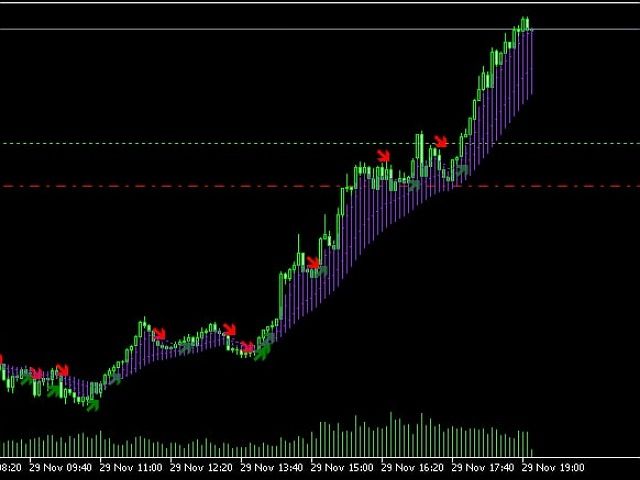
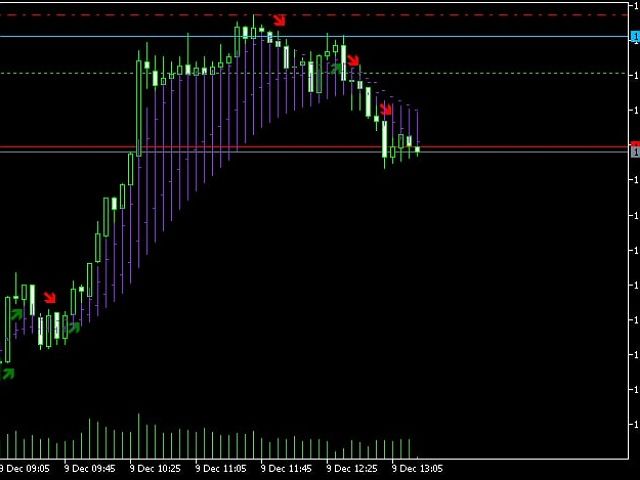
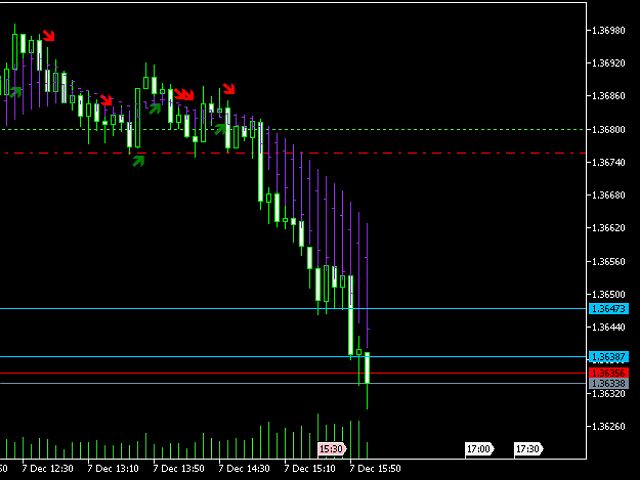
A Metatrade 5 technical Indicator made of the best trading strategy, very easy to use and to understand. Providing good and reliable signals for scalping and swing trading. Always killing the shower on any pair , whether currency’s, stock’s, index, community , Deriv synthetics and many more. TransitKiller is a very useful technical indicator system, that analyze the market using a unique technical strategy so that it can give accurate signal’s for buying or selling , and the bull’s and bear power shown by the size of our volatility bar. TransitKiller is good for scalping and day trading. To get the maximum performance of TransitKiller use a good risk management and check the volatility bars (the purple bars) always.
Join mql5 Transitkiller channel https://www.mql5.com/en/channels/transitkiller
Recommendations
- On 1-30 minutes timeframes is best to use it for scalping.
- On 1-4 hours and Daily timeframes it can be used for swing trades and for holding a position.
- Always take note of the bars(purple bars) as the can be used to show market volatility.
- The right place to put you stop loss at the edge of purple bars; for buying position the SL Should be below the bars and for a selling position the SL should be above.
Note that the price will increase after every 10 purchases.


用户没有留下任何评级信息