 MetaTrader 5
 专家
 指标
 程序库
 实用工具
 窗口小部件
 规则
适用于MetaTrader 5的新技术指标 - 212
 技术指标的信号外汇和股票市场的开仓交易和平仓交易起着至关重要的作用。指标的本质就是一种交易品种的数学转换,旨在预测未来的价格变化。
测试技术指标可以更有利于预测市场行为并从中获利。
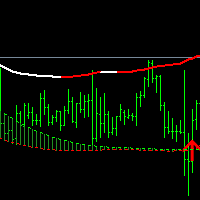
The market price usually falls between the borders of the channel .
If the price is out of range, it is a trading signal or trading opportunity.
Basically, Fit Channel can be used to help determine overbought and oversold conditions in the market. When the market price is close to the upper limit, the market is considered overbought (sell zone). Conversely, when the market price is close to the bottom range, the market is considered oversold (buy zone).
However, the research can be used to
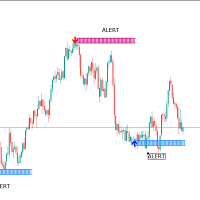
RubdFx Perfect Reversal , The reversal indicator is used to determine areas of support and resistance by Drawing an arrow with a level of supply and demand ( ReversalZones ). - You will catch more swings by reducing the period, and less swings if you increase period - Mobile, computer and email alerts available . it is not pushed by price which means the arrow will stay in one place,suitable for scalping and long term trading Also Compatible with all forex paris , BUY RULES; open a buy positio

The Alligator indicator uses three smoothed moving averages, set at five, eight, and 13 periods, which are all Fibonacci numbers. The initial smoothed average is calculated with a simple moving average (SMA), adding additional smoothed averages that slow down indicator turns. Scan all your favorite pairs with Alligator, and get notified on your preferred time frames.
Setting is Customizable
Click to change time frame or open new pairs
Notification: Phone/Popup/Email

This indicator Allow you to get notification from 7 indicators. Scan all your favorite pairs with your favorite technical indicator, and get notified on your preferred timeframes.
Settings are Customizable
(RSI, ADX, MACD, Alligator, Ichimoku, Double MA, and Stochastic)
Click to change the time frame or open new pairs
Notification: Phone/Popup/Email
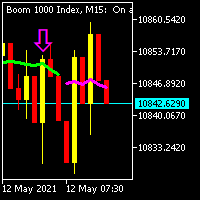
trade boom and crash with trend arrows no repaint arrows direction of use if you buy boom stoploss below arrow if you sell crash stoploss above arrow
please note that you need to follow trend to have perfect trades only use on m15 allow candles to close before taking trades please make sure you find this indicator useful as it has a 80% win rate on m15 h1 and h4 make good trades
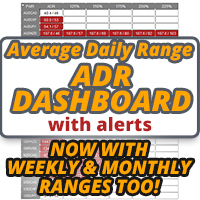
ADR 警报仪表板一目了然地向您显示当前价格相对于其正常平均每日范围的交易位置。当价格超过您选择的平均范围和高于它的水平时,您将通过弹出窗口、电子邮件或推送获得即时警报,以便您可以快速跳入回调和反转。破折号旨在放置在空白图表上,只需坐在背景中并在达到水平时提醒您,因此您无需坐下来观看甚至看!
此处提供 MT4 版本: https://www.mql5.com/en/market/product/62756
新:现在还向您显示平均每周和每月范围,并提醒他们!
获取在您的图表上绘制水平的 ADR 反转指标: https://www.mql5.com/en/market/product/64477
大约 60% 的时间价格在其正常的平均每日范围 (ADR) 内交易并推高这些水平通常是价格急剧波动的指标,通常会出现回调(获利了结)走势。您可以通过交易从每日范围的顶部或底部回落到最近的支撑位或阻力位来利用这些急剧波动。
收集了超过 20 年的历史数据,以找出主要外汇对和一系列交叉盘的价格超出特定 ADR 水平的平均百分比。该数据表明价格仅在 3% 的时间内超过其 ADR 的 200%
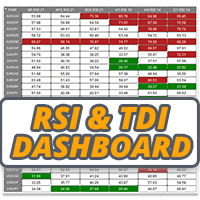
RSI / TDI 警報儀表板允許您一次監控您交易的每個主要貨幣對的 RSI(由您選擇)。
您可以通過兩種方式使用它:
1. 選擇多個時間框架,當有多個時間框架超出正常交易條件時,破折號會顯示給您。一個很好的指標,表明價格最近在推高,因為它在多個時間框架內達到了超買或超賣水平,因此很快就會出現回調或逆轉。
2. 使用一個時間框架(您最喜歡的交易)和多個 RSI 水平向您展示該時間框架內 RSI 擴展的強度。當價格在一個方向上非常強烈地推動太長時間並且市場應該出現獲利了結時,這是一種進行均值回歸交易的好策略。在示例屏幕截圖中,您可以看到 H4 RSI 在 25 水平之上擴展了 2 對,這比典型的價格行為要遠得多,因此是做多的好機會。
當蠟燭在所選時間範圍內收盤時,儀表板將提醒您選擇水平的擴展條件(超買和超賣)。您可以同時監控 6 個單獨的 RSI。您可以獨立選擇每個時間範圍、類型以及超買和超賣水平。
此處提供 MT4 版本: https://www.mql5.com/en/market/product/62698
您可以立即查看任何貨幣對的狀況,並選擇那些準備好回調或反轉
This indicator shows the candles with the highest volume in the market, based on a period and above-average growth percentage. It is also possible to activate the "Show in-depth analysis" functionality that uses algorithms to paint the candles with the probably market direction instead of painting based on the opening and closing positions.
EA programmers: This indicator does not redraw.
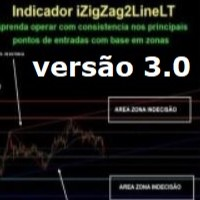
- iZigZag2LineLT
New version 3.0 of the iZigZag2LineLT indicator where it is possible to search for possible exhaustion regions of the market looking for small or large reversals, it follows the same characteristics contained in the indicator of the LTB and LTA lines, Fibonacci, Supports and Resistances with the application of Market Undecided zones (improved version of Stop or Move by Sato´s), in these areas suggestions (through the dotted lines) appear to include pending orders always lookin
Hey guys.
This indicator will show you, in the volume histogram, if the candle was a Doji, a bullish candle, or a bearish candle.
The construction of this indicator was requested by a trader who uses other indicators from my catalog, and I decided to release it free to help traders who think that the indicator can contribute to their operations.
The parameters are:
Volume Type: Real Volume or Tick Volume. Color if the candle is bearish: select the color. Color if the candle is high: select
FREE

White Weis Volume
This indicator shows the sum of the volume in each wave, bulish or bearish, as idealized by David Weis , but it brings an important addition , which is the marking of the bar with the highest volume of the wave (White Bar)!
In coding the indicator, it was sought to optimize the code to require minimal processing during use and not to overload mt5.
The indicator can be used for pre-trading analysis and study, where the trader analyzes possible points of support and resistance
Dark Breakout is an Indicator for intraday trading. This Indicator is based on Trend Following strategy, providing an entry signal on the breakout. The signal is provided by the arrow, which confirms the breaking of the level. We can enter in good price with this Indicator, in order to follow the main trend on the current instrument. It is advised to use low spread ECN brokers. Recommended Brokers This Indicator does Not repaint and N ot lag . Recommended timeframes are M5, M15 and H1. R
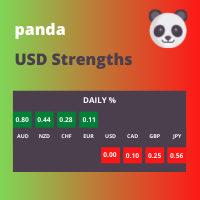
This panel displays the price percentage change
Shows the percentage change in price from the last open: Daily, Weekly and Monthly timeframes. Numbers are easier to use than histogram currency meters. Line up the three timeframes strengths/weaknesses for strong trends. Compare currencies strongest against weakest. USD is the world's reserve currency to compare against.
How to use 1. Match the strongest currency with weakest currency; or 2. Match the strongest or weakest currency against USD;
FREE
Simple alternate MACD version like the one used in tradingview. Two lines (MACD & signal line) and a histogram. This MACD version can be used in many different ways. Potential trades are the crossing of the MACD & signal line, the crossing of the MACD through the 0-line of the histogram, the MACD being under the 0-line of the histogram or the movement of the histogram itself. A combination of these potential signals on different timeframes can be very precise, but always needs additional confirm
FREE
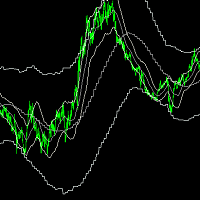
inp_timeframe: Set Timeframe of indicator MA Parameters: (Same as standard moving average indicator) inp_MA_period, inp_MA_shift, inp_MA_method, inp_MA_price: Moving Average Period, Moving Average Shift, Moving Average Method, Moving Average Price Please take note that using a MA_shift of 0 will result in a different result when the indicator is reloaded for higher time frame This indicator only accepts shift>0 This is due to the indicator showing the current time moving average and atr at the c
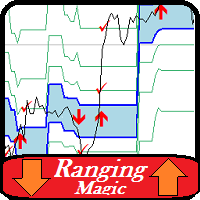
This is a powerful indicator that is very easy to work with. Its default setting is for the euro-dollar pair, but with the right settings it can be used in all markets and all time frames less than daily. The basis of the work of the Ranging indicator is to find areas of price range and get signals from it. You can specify the duration of the valid sufferings and the minimum and maximum price in it. It is also possible to determine the number of reliable signals received from each range.
Other
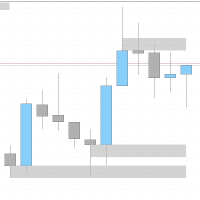
I created an indicator inspired by the "Wicks don´t lie" community on Youtube. It let's you see zones from other timeframes, and lets you keep a zone from a higher timeframe when you go to lower time frames. It operates by creating zones wherever the price has previously turned and not been retested again. This makes it easier to know where to expect a possible hick-up while going with a breakout, or where the price might make a reversal. The indicator also continues to add zones out from the cu

VR Cub 这是获得高质量切入点的指标。该指标的开发是为了促进数学计算并简化对仓位入场点的搜索。多年来,该指标所针对的交易策略已被证明其有效性。交易策略的简单性是其巨大的优势,即使是新手交易者也能成功进行交易。 VR Cub 计算开仓点以及获利和止损目标水平,这显着提高了效率和易用性。查看使用以下策略进行交易的屏幕截图,了解简单的交易规则。 设置、设置文件、演示版本、说明、问题解决,可以从以下位置获取 [博客]
您可以在以下位置阅读或撰写评论 [关联]
版本为 [MetaTrader 4] 计算入场点的规则 开仓 要计算入场点,您需要将 VR Cub 工具从最后一个高点拉伸到最后一个低点。 如果第一个点在时间上早于第二个点,交易者等待柱线收于中线上方。 如果第一个点在时间上晚于第二个点,交易者等待柱线收于中线下方。 根据上述条件,严格在 柱线收盘 后建仓。 换句话说,如果我们在小时图上进行交易,那么从最高点到最低点的时间距离必须超过24小时,最高点和最低点之间的点数必须大于或等于平均价格变动每天。 维持和改变市场地位 可以有多个未平仓头寸;每个头寸都可以单独修改。 VR Cub
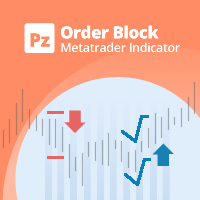
订单块的个人实现,一种简单而有效的头寸交易策略。如果价格范围没有在与突破相反的方向突破,则交易者应进入市场或在最后一个订单块的方向上寻找交易。为清楚起见,未绘制开放块。
[ 安装指南 | 更新指南 | 故障排除 | 常见问题 | 所有产品 ] 一个看涨的开盘是在一个新的市场低点之后的第一个看涨柱 一个看跌的开盘是在一个新的市场高点之后的第一个看跌柱 当打开的块被破坏时出现信号,成为订单块 当一个订单块被打破到相反的一侧时,它就变成了一个反转块 该指标实施各种警报 它不会重新粉刷或重新粉刷
输入参数 周期:创建新高或新低所需的柱线数量。较小的值会产生更多的信号。
最小 ATR 过滤器:订单块的最小主体尺寸,表示为 ATR 的乘数。 Max ATR Filter:订单块的最大主体尺寸,表示为 ATR 的乘数。
颜色:设置线条和箭头的颜色和大小。
警报:启用显示/电子邮件/推送/声音警报。
支持和问题
使用帮助台解决问题或及时获得支持。写一封电子邮件至:help@pointzero-trading.com。
作者 Arturo López Pérez,私人投资者和投机者、软件工程师和

Modified oscillator MACD. A classic indicator that combines a trend indicator with an oscillator to detect entry points. Has a multi-timeframe panel and 3 types of notifications
Benefits:
Works on all instruments and timeseries Trend indicator with oscillator for inputs Multi-period panel on all timeframes Pluggable arrows when signals appear Three types of notifications: push, email, alert
MT4 version -> HERE / Our news -> HERE
How the indicator works:
AW Classic MACD - Indicator o
FREE
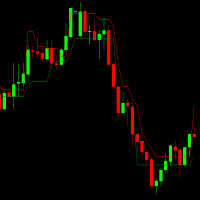
SupportResistance是一个动态支 撑和阻力指标,基于先前蜡烛的高点和低点。
计算参数是可配置的。 您可以使用前一支蜡烛的最大值和最小值作为参考,也可以使用一组前一支蜡烛的最大值和最小值。
指标使用红线表示阻力,绿线表示支撑。
当支撑或阻力破损时,其线将被点缀,仅在再次变得相关时才恢复。
支撑或阻力突破后,一旦到达相反的线,便会在最后一个有效值处找到新的支撑或阻力。
在历史最高或最低的情况下,将没有有效的支撑线或阻力线。
SupportResistance是一个动态支 撑和阻力指标,基于先前蜡烛的高点和低点。
计算参数是可配置的。 您可以使用前一支蜡烛的最大值和最小值作为参考,也可以使用一组前一支蜡烛的最大值和最小值。
指标使用红线表示阻力,绿线表示支撑。
当支撑或阻力破损时,其线将被点缀,仅在再次变得相关时才恢复。
支撑或阻力突破后,一旦到达相反的线,便会在最后一个有效值处找到新的支撑或阻力。
在历史最高或最低的情况下,将没有有效的支撑线或阻力线。

This is a multi timeframe version of the Supply and Demand indicator . It allows you to analyze a chart using the law of supply and demand on three different timeframes at a time. You will see zones of sales and purchases and determine the most profitable points to open positions. The indicator is based on the principle of market fractality. Supply and demand zones show places where a strong buyer or seller has made the price reverse and change its direction. The indicator has several types of
FREE
The Ultimate Dashboard New Year Sale - save $20 (normal price $79) Indicators are useful for traders, but when you put them into a dashboard that can scan 28 symbols at once they become even better, and when you can also combine different indicators and timeframes to give you synchronized alerts, then they become awesome. This easy to use dashboard provides you with 32 leading indicators, use them individually or together, to create powerful combination alerts. So when you want to know that RS

Mr Crypto Magic Lines is an indicator that draws very strong support and resistance lines, in which the price respects and changes its direction of movement. The generated signals can be used for trend or scalper operations. The indicator adapts to any financial asset and the desired graphic time as it considers the ATR indicator to measure volatility and identify trading signals.
It is possible to trade Forex, stocks, crypto, indices and any other assets on the metatrader
The configuration
This indicator uses the metaquotes ZigZag indicator as base to plot fibonacci extension and fibonacci retracement based in the Elliot waves. A fibonacci retracement will be plotted on every wave draw by the ZigZag. A fibonacci extension will be plotted only after the 2nd wave.
Both fibonacci will be updated over the same wave tendency. Supporting until 9 consecutive elliot waves.
Parameters:
Depth: How much the algorithm will iterate to find the lowest and highest candles Deviation: Amount of
This indicator show several candle patterns. Very useful to learn and to trading some stocks or forex.
The supported patterns are: bullish spinning top, bearish spinning top, bullish marubozu, bullish force, bearish marubozu, bearish force, bullish kicker, bearish kicker, bullish engulfing, bearish engulfing, bullish harami, bearish harami, piercing line, dark cloud cover, morningstar, evening star, bearish abandoned baby, bullish abandoned baby, three white soldiers, three black soldiers, mor
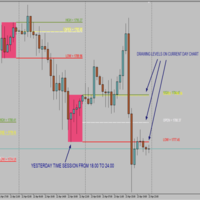
Time Session OPEN-HIGH-LOW-CLOSE This Indicator Will Draw Lines Of OHLC Levels Of Time Session Defined By User. It Will Plot Floating Lines On Current Day Chart. Time Session Can Of Current Day Or Previous Day. You Can Plot Multiple Session Lines By Giving Unique ID To Each Session. It Can Even Show Historical Levels Of Time Session Selected By User On Chart To Do Backdating Test. You Can Write Text To Describe The Lines.
FREE
This indicator marks the relevant volume levels among the day. The two relevant levels are the candle with more volume and the period with more volume of lots transacted.
The filled red background is the range of price with the most relevant volume of the day (probably the big player that is command the game). The purple lines shows the range of price with most volume (probably a area where some big player is accumulating before force a market direction). There is also the dot lines that marks
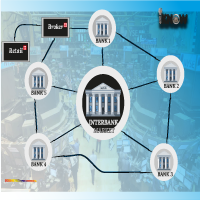
IPDA AND PD RANGES. Interbank Price Delivery Algorithm (IPDA) Range Liquidity and trades in the FX market take place in a decentralized manner as banks, brokers and electronic communication networks (ECNs) interact with one another to set prices. In FX, and ECN is a trading platform or electronic broker that hosts bids and offers and transmit them to users worldwide. ECN broadcasts a price around the world as various participants leave orders to buy and sell. Banks provide streaming prices base

Looking for reliable levels on a price chart? Already tired of searching for similar indicators? Are the levels not working out as they should? Then this is the indicator for you.
Volume Prices Universal is a reliable indicator of horizontal volumes. What does it show? First of all, the main idea of the indicator is to display at which price mark the price has been for the longest time. Thus, the display of price volumes on the price chart is formed. With the help of which you can very simpl

Looking for reliable levels on a price chart? Already tired of searching for similar indicators? Are the levels NOT working out as they should? Then this is the indicator for you.
VPU Levels is a more advanced version of the Volume Prices Universal indicator. In this indicator, in addition to the histogram of horizontal volumes, the indicator itself determines the levels from which the user can work. The PeakLevel and Diffraction fields help to adjust the depth of reaction to the histogram and
Description This addon is originated from my own trading. I spent my whole time waiting for signals and just wanted a notification when a specific signal appears. So i started to wrote my own addon and called it "LifetimeSaver", because thats exactly what it is for me. But because this addon should not only be for my personal trading, I extended the LifetimeSaver and now its highly customizable, so that it can fit your needs.
Functions: Notification at your defined target/signal Notification
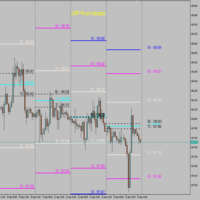
CPR Pivot Lines It Will Draw Pivot Point R1,R2,R3 S1,S2,S3 Tc Bc Best Part Is That You Can Even Add Values Of High,Low,Close Manually Also To Get Your All Levels On Chart.So If Your Broker Data Of High ,Low ,Close Is Incorrect Then You Don’t Have To Depend On Them Anymore. You Can Even Modify All Lines Style. It Will Show Line In Floting Style And Not Continues Mess.
FREE
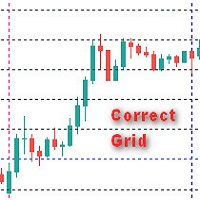
Общие сведения Индикатор отображает правильную сетку с задаваемым в параметрах шага в пунктах , что позволяет более точно визуально оценить масштаб и размер ценовых движений. Параметры индикатора
Step - шаг сетки в пунктах по вертикали Figure - шаг фигуры MaxBars - ограничение истории (0 - вся история)
Цвет вертикальных лини color new_day - Цвет новый день new_week - Цвет новая неделя new_mon - Цвет новый месяц
Цвет горизонтальных линий new_Hfigure - Цвет нов
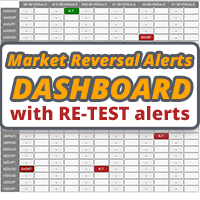
此儀表板是與市場結構反轉指標一起使用的警報工具。它的主要目的是提醒您在特定時間範圍內的逆轉機會,以及像指標一樣重新測試警報(確認)。儀表板設計為單獨放置在圖表上,並在後台工作,以向您發送有關您選擇的貨幣對和時間範圍的警報。它是在許多人要求衝刺以同時監控多個貨幣對和時間框架而不是讓市場反轉指標在一個 MT4 中的多個圖表上運行之後開發的。它會在 M5、M15、M30、H1、H4 和 D1 時間範圍內發出警報。當然,與交易中的任何事情一樣,更高的時間框架效果最好。 我創建的用於繪製矩形並提醒特定貨幣對的市場結構變化的指標運行儀表板。 儀表板僅允許您監控多個貨幣對和時間範圍,並在打開一個圖表時收到警報。
該儀表板被設計為市場結構反轉指標的附加組件。它將獨立工作,並提醒市場反轉警報指標給出的模式和信號。 在此處獲取市場反轉警報指標的 MT5 版本: https://www.mql5.com/en/market/product/46295 此儀表板的 MT4 版本在這裡: https://www.mql5.com/en/market/product/62751/
指標輸入/設置:
調整

Watch Osw:简单有效的蜡烛计时器 MetaTrader 的轻量级指标,可直接在图表上显示当前蜡烛收盘的剩余时间。这是一款基础且实用的工具,旨在让交易者始终能直观地看到新柱线形成还需多长时间,而不会在技术分析中增加额外负担。
参数指南(输入菜单) Watch Color:图表上计时器文本的颜色。 Text size:屏幕上时间数字的字体大小。 Text Font:时间指标的字体类型。 Candle End Alarm:启用或禁用(True/False)新蜡烛的信息警报。 Sound:周期变换时声音提示的音频文件名(.wav)。
视觉解释与功能 该指标投射出显示剩余时间的文本,并动态跟随当前的卖出价(Bid)。计时器格式会根据所打开图表的时间周期自动调整:
秒:显示在 1 分钟(M1)周期。 分和秒:M5 到 H1 周期的标准格式。 时、分和秒:在 H4 和日线图中激活。 天和小时:为周线图和月线图格式化。 新蜡烛警报:如果激活,系统会在当前蜡烛结束、下一根蜡烛开始的准确时刻发出声音提示和警报窗口。
操作指南 Watch Osw 是一款辅助决策的工具。通过了解蜡烛收盘的确
FREE
花生指示器
此指示器基于金色十字线,死十字线和MACD用蓝色和红色的粗线指示趋势。 您可以在参数设置(MA周期,MACD值)中自由调整数字。
因此,您可以将此指标调整为您的交易货币类型,期间等。 该指标的默认数字适用于USD / JPY M30或H1交易。
如何使用
绿线:风险,买入 红线:秋天,卖出 参数(可自定义)
MAPeriod1(短期) MAPeriod2(长期) MACDBUY_Value(MACD高于值。) MACDSELL_Value(MACD低于值。) Audible_Alerts = true或false 请下载免费的演示版,然后检查产品!
如果您需要更多功能来添加此指示器,请随时与我们联系! 我们将完全按照您想要修改此产品的方式进行工作。
惠普: btntechfx.com
电子邮件:support@btntechfx.com
Volume Levels is a very important indicator for exchange trading . At such levels, the majority of transactions were made. In the future, the price often bounces off such levels, and this can be successfully applied in trading. This indicator is able to determine the levels at which there was the most volume over the specified period of history. These levels are shown as lines, and the parameters for determining the levels are configurable. In addition to displaying, this indicator can inform th
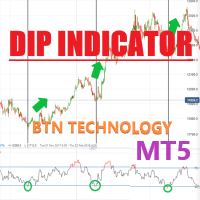
DIP Indicator Oshime DIP指示器Oshime 该指标基于Oshimegai(逢低买入)。这基于移动平均线,因此该指标指示基于长期趋势和短期趋势的线。 因此,当您进行短时交易时,此指标非常有用。因此,当您应该出售或购买仓位时,可以轻松地在 M5 或 M15 和 M30 火焰中找到。 如何使用 蓝色向上箭头-价格将上涨(您应该获得买入的位置。) *什么是Oshimegai(逢低买入)?- https://btntechfx.com/?product=what-is-oshimegaibuying-on-the-dips 参数设置(可定制) Candle_Index Audible_Alerts -------------------------------------------------- -------------------------------------------------- -------------------------------------------------- ----------------------------
Developed to assist in binary options retracement operations, this indicator will show the assets with the best retracement percentages!
How it works: The indicator will calculate the total length of each candle from low to high, the total of the body and total of shadows (up and down) and calculate a total shadows percentage of various configurable assets. The counter is updated with each new candle.
ATENTION: Demo on the estrategy tester is not functional to show multiple assets.

The Fúria indicator was developed to work when the market is in trend, that is, you will rarely see any signs in consolidation zones. It can be used for both Forex and Binary Options.
The signs plotted on the graph do not repaint or recalculate, even if you close and reopen your MT4 / MT5 they will be there.
Wait for the signal to set on the candle before you can enter the next candle.
==================================================
* BUFFERS: 0 (CALL) and 1 (PUT); * TYPE OF ENTRY: next

Looks for strong price movements and draws levels upon their completion.
You determine the strength of the movement yourself by specifying in the settings the number of points and the number of candles of the same color in a row in one direction.
There are 2 types of building in the settings: extrenum - high / low close - close price You can also adjust the number of displayed levels and the number of candles for calculations.
By default, the settings indicate 5 levels for 360 candles.
That
FREE
Developed to assist in binary options retraction operations, this indicator will show the best assets to operate retractions!
How it works: The indicator will calculate the total length of each candle from low to high, the total of the body and total of shadows (up and down) and calculate a total shadows percentage of various configurable assets. The counter is updated with each new candle.
ATENTION: Demo on the estrategy tester is not functional to show other assets, but still can show how t
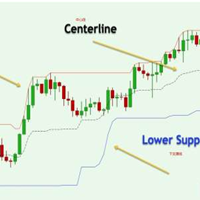
Donchian通道(唐奇安通道指标)是用于交易突破的最古老、最简单的技术指标之一。 一般来说,唐奇安通道的宽度越宽,市场波动就越大,而唐奇安通道越窄,市场波动性也就越小 。此外,价格走势可以穿过布林带,但你看不到唐奇安通道的这种特征,因为其波段正在测量特定时期的最高价和最低价。 交易实用必备工具指标 波浪自动计算指标,通道趋势交易 完美的趋势-波浪自动计算通道计算 , MT4版本 完美的趋势-波浪自动计算通道计算 , MT5版本 本地跟单复制交易 Easy And Fast Copy , MT4版本 Easy And Fast Copy , MT5版本 本地跟单复制交易 模拟试用 Easy And Fast Copy , MT4 模拟账号运行 Easy And Fast Copy , MT5 模拟账号运行 唐奇安通道指标计算: 唐奇安上阻力线 - 由过去N天的当日最高价的最大值形成。 唐奇安下支撑线 - 由过去N天的当日最低价的最小值形成。 中心线 - (上线 + 下线)/ 2 唐奇安通道信号 唐奇安通道常用作突破指标。它提供了两种主要类型的突破信号,一个是上阻力线或下支
FREE
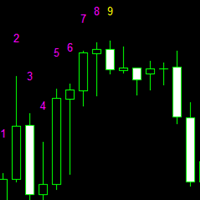
九转序列,源自于TD序列,是因TD序列的9天收盘价研判标准而得名。 汤姆·德马克(Tom DeMark)技术分析界的着名大师级人物,创建了以其名字首字母命名的TD系列的很多指标,价格反转的这个指标就是其中重要的一个,即TD序列。 德马克原版TD序列指标要复杂一些,想研究就自行看关于德马克的资料吧。这里只说简单的TD序列(九转序列)。 九转序列分为两种结构,低九买入结构和高九卖出结构。 TD高九卖出结构:连续出现的九根K线,这些K线的收盘价都比各自前面的第四根K线的收盘价高, 如果满足条件,就在各K线上方标记相应的数字,最后1根就标记为9,如果条件不满足,则K线计数中断,原计数作废重新来数K线。如出现高9,则股价大概率会出现转折。 TD低九买入结构:连续出现的九根K线,这些K线的收盘价都比各自前面的第四根K线的收盘价低,如果满足条件,就在各K线下方标记相应的数字,最后1根就标记为9,如果条件不满足,则K线计数中断,原计数作废重新来数K线。如出现低9,则股价大概率会出现转折。
结构的本质是时间和空间的组合,时间是横轴,空间是纵轴,不同的时间周期和空间大小的组合,形成不同的结构形态,不同的
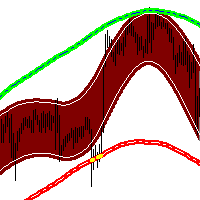
The market price usually falls between the borders of the channel .
If the price is out of range , it is a trading signal or trading opportunity .
Basically , Fit Channel can be used to help determine overbought and oversold conditions in the market. When the market price is close to the upper limit, the market is considered overbought (sell zone). Conversely, when the market price is close to the bottom range, the market is considered oversold (buy zone).
However, the research can b

Round Numbers Osw - 心理与机构水平 Round Numbers Osw 是一款专业指标,旨在自动在任何 MetaTrader 5 图表上绘制整数和心理价格水平,使交易者能够快速直观地识别供应、需求和机构流动性集中的关键区域。
配置参数指南 输入面板按点数规模区块(10、100、1000、10000、100000 和 1000000 点)划分,允许独立自定义每个级别:
每级参数 (Round Number Points) Show: 激活或取消激活对应点数规模的整数水平网格投影。 Color: 定义图表上线条的颜色,以在主要和次要级别之间保持清晰的视觉层级。 Style: 选择线条样式(点线、实线、虚线),以轻松区分每个价格点的重要性。 Width: 调整线条宽度,以在视觉上强调具有更大机构影响力的水平。 Show Numbers: 激活或取消激活每条投影线上精确价格数值的标签。
视觉解读 该指标在图表上投影出一组动态的水平线网格,对应资产的整数关口。颜色鲜明的粗实线代表宏观机构级别(流动性区块和大型参与者的反应区),而虚线则标记日内微观支撑和阻力位。
操作

用户手册:SRO 智能标记系统
1. 简介
SRO 指标是一款适用于 MetaTrader 5 的动态绘图工具,专为价格行为和 SMC 交易者设计。其竞争优势在于清晰的视觉效果:它允许您绘制仅指向未来的关键水平线,避免线条穿过整个图表历史。此外,它还会自动为每个对象标注其创建的时间周期。
2. 快速执行命令
该系统使用快捷键操作。只需将鼠标悬停在所需价格上,然后按下:
“S”键(支撑):从光标向右绘制一条水平线。非常适合标记底部和需求区域。
“R”键(阻力):绘制一条水平上限线。用于识别供应区域和高点。
“O”键(订单块):自动为选定的蜡烛图添加边框。绘制最高价、最低价和一条中心线(50%),该中心线代表盈亏平衡点或机构最敏感的区域。
3. 参数设置
在输入菜单中,您可以自定义外观,无需修改代码:
线条(支撑/阻力):
颜色:以视觉方式区分您的区域(例如,红色代表支撑,蓝色代表阻力)。
宽度:调整线条粗细以突出显示更高的时间框架级别(H4、D1)。
样式:选择实线、虚线或点划线。
订单块:
颜色/宽度/样式:自定义高反应区域的边界框。
4. 交易指南和

您是否有一个非常好的指标...但您希望它有警报? 您是否觉得仔细观察一个指标以查看它是否给您一个信号很累? ... 那么,这个指标可能适合你!
Universal Alerts 根据您自己的参数分析您的图表指标之一并在它们发出信号时提供警报。 配置此指标后,每次出现买入/卖出信号时都会显示一个图标,接下来出现的任何信号都会创建警报、发送邮件或发送应用程序通知。
如果您不需要警报,您仍然可以使用此指标(或多个实例)来更清晰地显示信号,并改善您的交易体验或回测。 您可以在 此博客中阅读有关指标可能设置的更多信息。 特征 支持 大多数指标:线交叉、水平交叉、图表信号、颜色变化... 任何类型的 警报 :选择是否要接收警报、邮件或应用程序通知;选择在蜡烛关闭后或任何时候是否需要它们,设置冷却时间以避免收到太多警报,仅获得买入或卖出警报...
完全 可定制 :更改图标、其位置,或定制您希望从指标中获取的消息。

OSW 自动支撑与阻力 - 自动关键点位 Automatic Support and Resistance OSW 是一款自动化技术指标,旨在即时识别并在图表上绘制最相关的支撑和阻力位。通过智能计算更高时间框架(H1、日线、周线和月线)的高点和低点,它消除了标记关键流动性区域时的决策主观性,使交易者能够专注于价格走势和战略决策。
配置参数指南 S&R Color: 定义图表上显示的水平支撑和阻力线的视觉颜色。 S&R Style: 选择线条的视觉绘制样式(实线、点线、虚线等)。 S&R Width: 调整水平线视觉粗细,以适应您的屏幕显示偏好。
图表视觉解读 该指标在图表背景中绘制自动水平线,以免干扰 K 线或您的手动分析。
根据您工作的时间框架,点位会进行动态计算:
1 至 4 分钟图表:显示从 1 小时结构(H1)中提取的关键点位。 5 至 30 分钟图表:显示日线图(D1)的关键高点和低点。 1 至 2 小时图表:显示周线图(W1)的结构点位。 4 小时至月线图表:显示月线图(MN1)的高点和低点。 线条经过规范化处理,以突出显示价格在历史上反应最频繁的区域。
操作指南

Investment Castle 波动指数 — 读懂市场能量
Investment Castle 波动指数用一个清晰的读数显示当前品种的成交量和市场波动性。它与 Investment Castle EA 用来设定动态距离和把握反向入场时机的波动引擎完全相同。
它能为您做什么 成交量与波动性一目了然: 看清当前市场的活跃度和波动程度。 驱动动态距离: 与 Investment Castle EA 用于自适应间距和反向入场的指数相同。 可按品种优化: 参数可针对每个品种进行调整和优化。 适用任何图表: 任何品种、任何周期。
适合人群: 根据真实市场波动来确定仓位与间距的交易者。
风险提示: 交易存在重大亏损风险。请务必先在模拟账户上测试,并使用您能接受的风险设置。过往表现不代表未来结果。
FREE
I present an indicator for professionals. Prof MACD is very similar to classic MACD in appearance and its functions . However, Prof MACD is based on completely new algorithms (for example, it has only one averaging period) and is more robust, especially on small timeframes, since it filters random price walks. The classic MACD indicator (Moving Average Convergence / Divergence) is a very good indicator following the trend, based on the ratio between two moving averages, namely the EMA

The third indicator from the set for market analysis. The first one is here: https://www.mql5.com/ru/market/product/65258 The second one is here: https://www.mql5.com/ru/market/product/65347
The indicator builds a channel of maximum price fluctuations for a specified period. Additionally, the middle of the channel is drawn.
All color settings, line types are customizable.
The indicator allows you to see the picture of price movement from a slightly different angle. You can use several indic

The second indicator from the set for market analysis. The first one is here: https://www.mql5.com/ru/market/product/65258
The indicator draws a line by levels where the price reaches a aliquot of the value in the Step parameter. You can specify the spread of + - points from the required level.
All color settings, line types are customizable.
Example: Step - 500 Deviation - 20 If the symbol reaches the price for example 1.73500 + - 20, i.e. from 1.73480 to 1.73520, lines are being built. Th
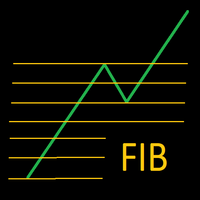
Automatic Fibonacci Retracement Line Indicator. This indicator takes the current trend and if possible draws Fibonacci retracement lines from the swing until the current price. The Fibonacci levels used are: 0%, 23.6%, 38.2%, 50%, 61.8%, 76.4%, 100%. This indicator works for all charts over all timeframes. The Fibonacci levels are also recorded in buffers for use by other trading bots. Any comments, concerns or additional feature requirements are welcome and will be addressed promptly.
FREE
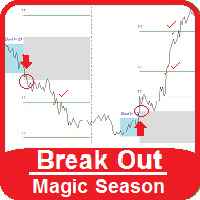
<< See how it works on YouTube >>
Possibilities:
Arrow signal to buy, sell and hit the targets Alert signal send mail Execute custom audio file The Break Out Magic indicator monitors price fluctuations over a set period of time (adjustable rectangle). Then, according to the maximum and minimum price, in the second rectangle, it determines the outline break lines. And sets 3 goals to exit from each side. In the settings we have:
Start Time: Start time of range
End Time: The end of range time
Ex
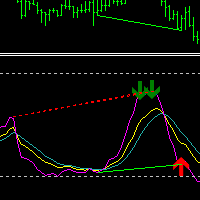
KDJ Index 4 交易实用必备工具指标 波浪自动计算指标,通道趋势交易 完美的趋势-波浪自动计算通道计算 , MT4版本 完美的趋势-波浪自动计算通道计算 , MT5版本 本地跟单复制交易 Easy And Fast Copy , MT4版本 Easy And Fast Copy , MT5版本 本地跟单复制交易 模拟试用 Easy And Fast Copy , MT4 模拟账号运行 Easy And Fast Copy , MT5 模拟账号运行 "Cooperative QQ:556024 " "Cooperation wechat:556024" "Cooperative email:556024@qq.com" 强烈推荐趋势指标, 波浪的标准自动计算 和 波浪的标准自动计算MT5版本
KDJ指标又叫 随机指标 ,是一种相当新颖、实用的技术分析指标,它起先用于期货市场的分析,后被广泛用于股市的中短期趋势分析,是期货和股票市场上最常用的技术分析工具。 随机指标KDJ一般是用于股票分析的统计体系,根据统计学原理,通过一个特定的周期(常为9日、9周等)
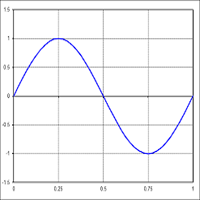
This indicator is based on a mathematical formula and an ANN combined, designed to make a model(using previous prices) of the most recent market condition (any chart*) in order to use the model as a forecasting tool. *This indicator can operate on any chart/timeframe, but it's suggested you use multiple timeframes for each trade because this method relies solely on the time factor, you can not use this indicator to predict price volatility, but if it's fit correctly it will show you when the nex
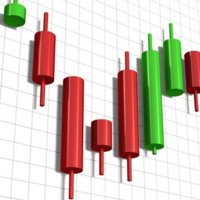
The indicator is designed to display candles (bars) of a higher timeframe on the current one. The indicator has many settings for the displayed candles, as well as a sound signal that will sound a few minutes (seconds) before the bar closes. Input parameters: BarsCount = 50 - the number of displayed bars of the higher timeframe Auto_Candle_UP_TF = false - Automatic selection of a higher timeframe Candle_UP_TF = PERIOD_H1 - Higher timeframe, if Auto_Candle_UP_TF = false Signal_Close_Candle_UP_TF

VTrende Pro - MTF indicator for trend trading with a display panel for MT5 *** Videos can be translated into any language using subtitles (video language - Russian)
Although the signals of the VTrende Pro indicator can be used as signals of a full-fledged trading system,
it is recommended to use them in conjunction with the Bill Williams TS.
VTrende Pro is an extended version of the VTrende indicator. Difference between Pro version and VTrende:
- Time zones
- Signal V - signal 1-2 waves
- S

两个振荡器的组合。第一个显示入场点,第二个显示当前趋势。该指标可以通过两种模式的箭头显示振荡信号,所有快速振荡信号或仅在当前趋势方向的信号。它具有多时间范围面板和三种类型的信号通知。 好处: 适合当日交易和倒卖交易 趋势过滤 简单而灵敏的设置 多时间框架面板 适合融入顾问。 适用于任何交易品种和任何时间范围 三种类型的通知 MT4版本 -> 这里 / 问题解决 -> 这里 指标策略 该指标由两个不同的振荡器组成: 慢趋势线(粗) - 当指标的最高水平从上到下交叉时,它是下降趋势的指标,当较低的水平水平(指标的低水平)从下到上交叉时,它是下降趋势的指标上升趋势。此外,在较低区域找到一条慢线表明当前趋势是下降趋势,反之亦然,在上方区域找到一条慢线表明当前趋势是上升趋势。这就是该指标确定当前市场趋势的方式。 快速入场线(细):识别从下到上与下线相交处的入场点,这是买入信号,在从上到下穿越上线时,这是卖出信号。除了振荡线之外,调整指标线也很重要,因为这会影响信号的数量和准确性。 本产品使用不同的振荡器来显示慢线和快线,每个振荡器必须单独调整。 为了便于操作,该指标在多时间框架面板中显

The MaxMinTrend indicator displays the highs and lows of the price on the chart. This indicator was created to simplify the determination of trend directions, as well as to support open positions, by transferring Stoploss to the current highs and lows of the price, thereby making a large profit. This indicator is not redrawn.
Input parameters:
BarsCount - 1000 - Number of bars to draw the indicator
maxmin - true - Enabled display of Highs and Lows
line - true - Enabled display of the connec

The Flat Horizontal Channel Range Price indicator automatically draws a horizontal channel (range) of prices on a higher or current timeframe. This indicator was developed to simplify the determination of sideways movements of the market, as well as to search for entry signals for a pullback from the boundaries of a channel (range) or for its breakdown.
Input parameters:
BarsCount - 1000 - Number of bars to search for a horizontal channel AutoPeriodDraw - true - Enabled automatic drawing of a

Phi Cubic Fractals Pack1A with FuTuRe PACK 1A é uma melhoria sobre o Pack 1 que inclui a possibilidade de selecionar as linhas LINE 4/8/17/34/72/144/305/610 individualmente. Este produto contém os indicadores do PACK 1A (Lines + LineSAR + Channels + BTL + Ladder) + MODO FUTURO Phi Lines - medias moveis especiais, semelhantes às MIMAs do Phicube, capazes de indicar com muita clareza tanto a tendencia como a consolidação; Phi LineSAR - apaga ou destaca as Phi Lines para mostrar apenas as linha
The indicator displays a stock chart of a non-standard type, in which the price and time have the same value.
The usual chart of Japanese candlesticks does not take into account all the information that the time analysis can give. Renko charts do not use all the information that price can give in relation to time. The "Chart Price and Time" indicator takes into account price and time equally and shows the predominance of price or time.
Taking into account price and time equally gives an idea
The indicator tracks sharp volatility (moments when the market has shown increased activity and movement may occur), on the selected instruments and time periods.
The information is displayed as colored rectangles. Thus, it is possible to assess at a glance which tool should be given priority attention.
The indicator will be useful for scalpers when they need a quick reaction or for traders working with a large number of instruments. The indicator does not redraw. The indicator displays 8 degree
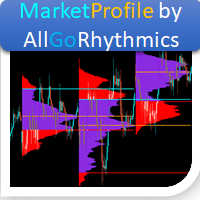
For those who need a Volume Profile / Market Profile indicator, here is the solution!
It contains the essential information:
Control Point (POC); Higher Value Area (VAH); Lower Value Area (VAL); You can choose to SHOW or NOT SHOW the volume Histogram, according to your wish. If you choose to show the histogram, note that according to the type of asset, it is necessary to adjust the scale of the indicator (last parameter of the indicator).
You can also choose from the data source of your hist

Indicator shows buy/sell arrows depending on volatility factor. Indicator does not repaint! It works on any pair and any timeframe. It is well tested through strategy builders and shows quite interesting results as a good filter indicator and as independent signaler as well (check the screenshots). It is possible to search for a lot of interesting parameters for profitable trading, some of which are shown on the screenshots. There are next inputs in indicator settings: N-volatility period; Level

The indicator displays the size of the spread for the current instrument on the chart. Very flexible in settings. It is possible to set the maximum value of the spread, upon exceeding which, the color of the spread label will change, and a signal will sound (if enabled in the settings). The indicator will be very convenient for people who trade on the news. You will never enter a trade with a large spread, as the indicator will notify you of this both visually and soundly. Input parameters: Aler
FREE
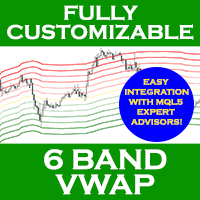
6-BAND VWAP (Volume Weighted Average Price)
Fully customized and EA-friendly VWAP Bands Indicator.
Main Features:
Choose the period of VWAP calculation reset (Daily, Weekly or Monthly): For day trading use the Daily VWAP, and for longer term analysis use the Weekly or Monthly calculations. Choose how many bands (deviations) you want to show, up to 6. Choose zero to display only the main VWAP line. Fine adjustment of the deviation of the bands: Find the best band’s deviation for the instrum
MetaTrader市场提供了一个方便,安全的购买MetaTrader平台应用程序的场所。直接从您的程序端免费下载EA交易和指标的试用版在测试策略中进行测试。
在不同模式下测试应用程序来监视性能和为您想要使用MQL5.community支付系统的产品进行付款。
