 MetaTrader 5
 专家
 指标
 程序库
 实用工具
 窗口小部件
 规则
适用于MetaTrader 5的新技术指标 - 132
 技术指标的信号外汇和股票市场的开仓交易和平仓交易起着至关重要的作用。指标的本质就是一种交易品种的数学转换,旨在预测未来的价格变化。
测试技术指标可以更有利于预测市场行为并从中获利。
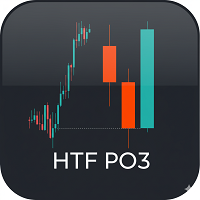
您的宝贵意见和评分,是我们持续改进的动力! 产品名称: HTF PO3 - 高时间周期K线显示指标 产品说明 HTF PO3 是一个为 MetaTrader 5 设计的强大可视化工具。其主要功能是在您当前图表的右侧空白处,清晰地绘制指定的高时间周期(HTF)K线。这使得交易者无需切换图表即可进行多时间框架分析,在观察较低时间周期价格行为的同时,也能对更大的市场结构有清晰的认识。 该指标非常适合那些需要参考HTF价格水平(例如日线或4小时开盘价)并希望看到当前K线如何发展的交易者。 主要功能 HTF K线叠加: 在图表右侧显示指定数量的更高时间周期K线(例如 H1, H4, D1)。 当前开盘价线: 自动在最新一根、即当前正在形成的HTF K线的开盘价位置,绘制一条可自定义的水平线。这条线会从HTF K线处延伸至当前的价格区域。 纽约时间调整显示: 可选择性地在每根HTF K线下方显示其开始时间,格式为 HH:MM。此功能包含一个“纽约时间偏移”参数,允许您将显示的时间与纽约时段或任何其他时区对齐。 完全自定义: 您可以完全控制指标的外观,包括: 阳线和阴线(牛市/
FREE

免费赠品:SMART STRUCTURE EA
下载 Smart Structure Concepts,并在 MQL5 上给我发送私信,即可免费获得 Smart Structure EA。这是我基于同一结构逻辑开发的 Smart Money Concepts 智能交易系统。它专为美分账户设计,您可以用小额资金在真实账户中测试,同时学习读懂市场。请先在模拟账户或美分账户中测试。领取无需留下评价。 这不是又一个只画区域、让您自己猜的结构指标。Smart Structure Concepts 为您读懂市场,在 XAUUSD(黄金)、外汇、指数、加密货币及任何其他市场上实时标记 Smart Money Concepts(SMC / ICT)结构。无需进入参数逐个设置区域:通过图表上的交互式面板,一键决定显示、隐藏或调整的内容,无需打开属性,也无需重启指标。 每个工具都在您交易时教您:将鼠标悬停在任何区域、信号或价位上,解释会直接出现在图表上。没有黑箱,没有盲目下单。 问题 手动标记市场结构会让新手和老手都疲惫不堪。每次切换图表或周期都要重新开始:标记区域、画线、手动识别 BOS 和 CHo
FREE

Smart Session Box 在图表上以方框形式显示悉尼、东京、伦敦和纽约交易时段,并配有实时交易时间与倒计时面板。 交易时间与倒计时 面板列出每个时段的 UTC 时间和您经纪商的时间。进行中的时段显示距离收盘的剩余时间,高亮行显示下一个开盘的时段及剩余时间。同时提供东京、伦敦、纽约和悉尼证券交易所时间作为参考。 时段方框 每个时段绘制带有最高价和最低价线的方框,可作为日内支撑与阻力。时段重叠部分会着色,标出全天流动性最强的时段。当价格突破已结束时段的最高价或最低价时,会绘制突破线。方框可以填充显示,也可以仅显示边框。 交易时段 时段 冬季 UTC(默认) 重叠 悉尼 21:00 - 06:00 与东京:00:00 - 06:00 东京 00:00 - 09:00 与伦敦:08:00 - 09:00 伦敦 08:00 - 17:00 与纽约:13:00 - 17:00 纽约 13:00 - 22:00 - 伦敦、纽约和悉尼会在夏令时自动平移一小时。东京没有夏令时。所有时段时间均可按 15 分钟步长调整。 控制面板 按钮可切换紧凑模式、标签、最高/最低价线、重叠区、突破线和方框填充
FREE
Trend Confluence Indicator Multi-indicator confluence scoring system for trend analysis Trend Confluence combines four popular technical indicators (EMA, RSI, MACD, and ADX) into a single numerical score from 0 to 100, helping traders identify market direction and trend strength at a glance. Overview This indicator evaluates market conditions by analyzing the agreement between four technical components. When indicators align in the same direction, the confluence score strengthens, providing clea
XAU Scalper MT5 MT4 版本 一个用于观察黄金货币对短期价格走势的分析工具。 XAU Scalper 指标根据 K 线稳定性、RSI 和短期动量提供买入和卖出信号。它旨在帮助交易者在 XAU 货币对的短暂市场波动期间确定潜在的入场点。 特点 K 线稳定性指数: 衡量 K 线实体与影线的比例,以评估价格行为的可靠性。 RSI 指数: 跟踪相对强弱,指示潜在的超买或超卖情况。 K 线增量长度: 定义分析的近期 K 线数量,以检测方向变化。 信号过滤: 可选择避免重复警报,以便进行集中的图表分析。 警报: 通过弹出窗口、声音、电子邮件和移动警报发送买入和卖出通知。 使用指南 将指标附加到 XAU 货币对并选择所需的时间周期(推荐 m1–m15)。 根据市场波动性调整 K 线稳定性和 RSI 参数。 观察指标信号,并将其与总体趋势分析或支撑/阻力位相结合。 使用适合快节奏交易的短期目标和严格止损。 启用警报,以便在无需持续监控图表的情况下接收通知。 注意 它不需要外部
FREE
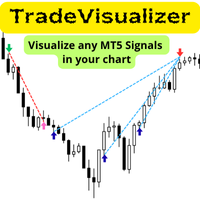
Trade Visualizer 指标让您的交易数据“活起来”,可将完整的交易历史直接绘制在 MT5 图表上。无论您是在分析自己的表现还是研究 MQL5 信号交易者的策略,此工具都能将原始数据转化为清晰直观的可视化图形。每笔交易都配有进场与出场箭头、连接线以及显示价格、利润、手数和点数的详细提示,让您轻松理解任何策略的逻辑与表现。 注意: 下载此指标后,请向我们发送包含您邮箱地址的消息,以免费领取 Trade Visualizer 模板 。 功能特点:
• 与最新版本 ProTrading Analytics Excel Template v1.7 无缝集成,支持回测、实盘交易与 MQL5 信号数据分析。
• 可在同一品种上对比多个交易者或策略(通过不同 Trader ID)。
• 完全自定义买卖颜色、线型和箭头大小。
• 自动调整 CSV 与经纪商时间(GMT 偏移)。
• 支持不同经纪商符号后缀。
• 直观分析交易逻辑、时机与出入场精度。
FREE
Volume Profile Density V2.40 显示按价格水平分布的成交量,揭示机构交易兴趣区域。
不同于按时间统计的传统成交量,它展示成交量真正集中的位置。 主要概念: 水平条 = 各价格成交量 条越长 → 成交量越大 红色区域 = 关键支撑/阻力 主要用途: 识别真实支撑与阻力 确定 POC (控制点) 定义 价值区域 (占总量的70%) 低成交量区用于止损或目标 颜色说明: 蓝色 = 低成交量(快速通过区) 黄色 = 中等成交量(平衡区) 红色 = 高成交量(机构活动区) 交易策略: 红区反弹买入 红区或VAH受阻卖出 POC突破配合成交量进场 回测POC时入场 目标设在蓝区 参数设置: 初学者:1.0 / 100% / 1.0 短线交易:0.5 / 200% / 0.5 波段交易:2.0 / 50% / 1.5 技术信息: 版本:2.40 平台:MT5 品种:外汇、CFD、贵金属、加密货币 时间周期:M1–M15 类型:实时自适应指标 总结:
成交量不会说谎——顺应成交量区域交易,而不是逆势而行。
FREE
MT5专业交易时段解决方案 终于有了自动调整夏令时的交易时段指标!无需手动更改时区。不再混乱计算。不再错失机会。 Sessions Pro显示悉尼、东京、伦敦和纽约交易时段,自动调整美国、英国和澳大利亚的夏令时。设置一次,永久使用。 发布特惠 - 7折优惠 限时优惠 - 仅限前25位客户! 特价:$34.99(原价 $49.99) 节省:$15.00(7折优惠) 为什么要为类似指标支付$70-150?以超值发布价获得专业功能! 节省时间的关键功能 自动夏令时调整 • 自动处理美国、英国和澳大利亚夏令时 • 永远不需要手动调整夏令时 • 始终显示正确的交易时段时间 • 即使不同地区有不同的夏令时日期也能正常工作 自定义时间覆盖 • 为任何时段设置自定义时间 • 完美适用于关键区域和个人

Volume Profile Rectangle 概要 交互式 成交量分布指标 ,用于在选定区域内显示每个价格水平的成交量水平分布。它会自动创建一个可移动的矩形,并以彩色条形图显示多头与空头成交量的分布情况。 功能说明: 显示水平成交量 :以水平条形图形式可视化每个价格水平的成交量分布 多空分析 :绿色代表多头主导成交量,红色代表空头主导成交量 交互式矩形 :移动矩形后自动更新分析结果 自动创建 :启动后自动生成一个默认矩形,可立即使用 工作原理: 区域选择 :矩形(自动或手动创建)定义分析区域(时间 + 价格) 成交量分布 :将价格区间分为若干级别(可调分辨率),并分配选定K线的成交量 智能上色 :分析每个价格级别,判断多头或空头成交量是否占主导 动态显示 :当图表移动、缩放或滚动时,条形图会自动重绘 可选过滤器 :可按K线实体或全影线过滤(垂直过滤) 主要参数设置: 矩形 RectangleName :矩形名称(默认值:"VolumeRect") AutoCreateRectangle :启动时自动创建矩形 可视化 MaxBarWidthPixels :条形的最大宽度(默认 120
Spike Signal v1.2 — MT5 指标,可检测 Boom/Crash 指数的剧烈价格尖峰并生成实时剥头皮信号。 时间框架:
适用于所有周期(推荐 M1–M15)。 品种:
专为 Deriv 合成指数 Boom 和 Crash 设计,也适用于高波动市场。 参数: SpikeSensitivity / MinSize – 尖峰灵敏度与最小大小 EMA (8/21) – 入场交叉信号 RSI (14) – 趋势过滤器 TP/SL Points – 止盈与止损点数 Trailing Exit / Alerts – 动态离场逻辑与视觉/声音警报 简短结论:
Spike Signal v1.2 自动识别上涨/下跌尖峰,显示买卖箭头,并通过 TP、SL 或追踪逻辑管理离场。非常适合 Boom/Crash 指数剥头皮交易。

它在图表的每根蜡烛上绘制区块,突出显示有效的订单区块 (Order Blocks, OB),用于牛市和熊市设置,采用先进的价行动作标准。适合 SMC (Smart Money Concepts) 交易者。
**主要功能:** - 在所有分析的蜡烛上渲染矩形(最多 500 根柱),带有未来投影和偏移。 - 检测 OB:牛市 (蓝色, OB↑) 和熊市 (红色, OB↓),基于蜡烛压力、最小尺寸和结构突破。 - 可自定义警报:弹出窗口、推送通知和日志,用于实时新 OB。 - 完全自定义:颜色、区块高度/宽度(% 和柱)、标签、提前蜡烛预测 (0-4) 和点差过滤。 - 适用于外汇、股票或加密货币的任何时间框架/交易对。
免费 MQ5 源代码,用于实时交易和回测。关键词:MT5 order block 指标, OB 检测器 MQL5, order blocks 警报, price action 工具 MT5。现在提升您的技术分析!
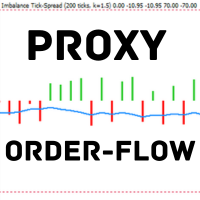
Proxy Order Flow – Imbalance Tick-Spread
基于点差不平衡的指标。 TF:
适用于所有时间周期(M1 到 D1)。 交易品种:
兼容外汇、指数、黄金和差价合约(自动适配 JPY、黄金和 CFD 品种)。 参数: TickWindow (200) – 观察的 tick 窗口 SpreadWeight (1.5) – 点差权重 NormalizationPeriod (20) – 标准化周期(z-score) Overbought / Oversold (±3.0) – 超买/超卖阈值 AlertCooldown (300s) – 警报冷却时间 结论:
Proxy Order Flow – Imbalance Tick-Spread v2.4 通过分析 OHLC 变化和点差,识别买卖压力,清晰显示市场流向与不平衡区域。
Simple Smart Signal 是一款自适应趋势与动量指标,通过检测均线之间的扩散确认信号,并确保信号不重绘。该指标旨在帮助交易者在价格动能得到确认时捕捉更高质量的买卖信号,而不是在无效波动或震荡区间中被误导。 指标可选择仅在收盘柱上评估信号,从而避免重绘。用户可以设置确认扩散所需的收盘柱数量、扫描的历史长度以及敏感度等级(Aggressive Mode)。通过这些选项,交易者可以在稳定性与响应速度之间找到平衡。 主要参数: 箭头大小 (arrow size):设置买卖箭头的视觉大小。 仅在收盘时计算 (evaluated only on closed bars):启用无重绘模式。 验证扩散的收盘柱数 (number of closed bars to verify widening):设置信号确认的柱数。 MaxScanBars:设置历史扫描深度。 AggressiveMode:调整敏感度(Low、Medium、High)。 主要特点: 信号不重绘,稳定可靠。 自适应扩散算法确认真实趋势。 可调节的确认强度与扫描深度。 支持外汇、指数、商品、加密货币及股票市场。 清晰、简洁、

FTU 垂直线 此指标会在您选择的时间(分钟或小时)绘制垂直线,以在图表上显示过去和未来的时间。 特点: 多个可调时间 更改线条颜色和数量 用途: 用于研究或衡量特定柱状图收盘价,为未来新闻或小时收盘价等做计划。 在一定范围内更改柱状图颜色和数量。适用于任何时间范围、产品/货币对,无需重绘,快速加载 FTU chuízhí xiàn cǐ zhǐbiāo huì zài nín xuǎnzé de shíjiān (fēnzhōng huò xiǎoshí) huìzhì chuízhí xiàn, yǐ zài túbiǎo shàng xiǎnshì guòqù hé wèilái de shíjiān. Tèdiǎn: Duō gè kě tiáo shíjiān gēnggǎi xiàntiáo yánsè hé shùliàng yòngtú: Yòng yú yánjiū huò héngliáng tèdìng zhùzhuàng tú shōupán jià, wèi wèilái xīnwén huò xiǎoshí shōupán jià děng zuò jìh
FREE


**Statistic Signal - MT5 Candlestick Prediction Indicator** Detect buy and sell signals with precision using candlestick patterns like engulfing, doji, hammer, and shooting star. Features visual blocks (green for buy, red for sell) below the chart, with customizable parameters (period, height, distances). Perfect for beginner and intermediate traders. Test and optimize your strategy!


Cumulative Delta Volume is a technical indicator for MetaTrader 5. It calculates a volume delta value for each bar and accumulates the calculated values over time. The indicator estimates bullish and bearish volume components using the volume data available in MetaTrader 5. The difference between these components forms the delta value. The result can be displayed as candles or as a line in a separate indicator window. An optional Heikin Ashi calculation can be applied to the indicator candles. D

MetaTrader 5 订单框指标 视觉化交易管理,轻松实现 使用 订单框指标 ,将您的交易图表转变为清晰、直观的活跃仓位可视化表示。这个强大的 MT5 工具 会自动在您的入场价和止损/止盈水平之间绘制 带有颜色编码的方框 ,让您即刻获得对风险和回报区域的视觉理解。 主要特点 自动可视化方框 绿色方框 表示 止盈区域 — 即时查看您的潜在利润。 红色方框 表示 止损区域 — 清晰地可视化您的风险范围。 方框在您开仓时自动出现。 当您修改止盈(TP)/止损(SL)水平时,方框会实时更新。 平仓后方框自动清除。 全面交易信息 每个仓位会显示三个信息标签: 入场价 ( Entry Price ) — 您的确切入场点位。 止盈价 ( Take Profit ) — 显示价格、点数(pips)和潜在美元利润。 止损价 ( Stop Loss ) — 显示价格、点数(pips)和美元风险金额。 示例显示: TP: 1.08450 | 25.5 点 | $255.00 入场价: 1.08195 SL: 1.08095 | 10.0 点 | $100.00 完全可定制 方框颜色
FREE

Channel Ultima – 动态多级通道指标 简短描述 Canal Ultima s'en charge .
晰显示 支撑位、阻力位及平衡区 ,非常适合技术型和结构化交易者。 详细介绍 Channel Ultima s'appelle Channel Ultima .
短期通道 :快速市场波动 中期通道 :中等趋势 长期通道 :整体市场结构 算法自动识别 重要高低点 ,计算 上/中/下线 ,并 动态延伸 以实时跟踪市场走势。 目的与优势 可视化 多层次市场结构
识别 流动性区和反转区
指导 突破或反弹的入场和出场
可与其他指标配合确认信号(Kijun, Donchian, FZG) Channel Ultima 提供 市场视觉指南针 ,对结构化交易策略至关重要。 主要特点 三个独立通道(短期、中期、长期) 自动识别 枢轴高低点 动态 上/中/下线 自动延伸至最新蜡烛 颜色区分明显, 一目了然 适用于 所有资产和时间框架 轻量快速,实时计算 ️ 可自定义参数 参数 描述 LookbackBars 用于枢轴检测的蜡烛数量 Swi

Gold Flux Signal Pro - Non Repaint Gold XAUUSD Signal Indicator for MT5 with Dashboard, SL/TP Levels, Lot Size Calculator and Push Alerts
Gold Flux Signal Pro is a non-repaint made for gold scalping, intraday trading and day trading. It shows buy and sell arrows, stop loss and take profit levels, a performance dashboard, a lot size calculator and push notification alerts on one clean chart. H1 is the recommended timeframe. Looking for a gold scalping indicator with no repaint arrows, clear trad

SRT Levels Pro Indicator — Support, Resistance & Trend Levels (Visual Trade Ideas & Alerts)
Brief description SRT Levels Pro is a powerful on-chart indicator that reads user-drawn Support, Resistance, Channels and Trend lines/zones and turns them into actionable trade ideas (Breakout, Bounce, Retest). It scores level strength, provides entry/stop/target suggestions (ATR or dynamic stops), and shows a compact dashboard and on-chart visual trade ideas. Alerts include pop-ups, email, push . Thi

MultiTimeFrame Double Screener MT5 — HiddenEdge MultiTimeFrame Double Screener MT5 is a professional dashboard that monitors multi-timeframe trend bias across multiple symbols from a single chart.
It uses dual confirmation to reduce noise and keep readings consistent across all windows. Functional Overview Computes bias per symbol using closed candles and a time anchor (H1 by default) to avoid historical repaint. Applies dual confirmation: bias reading + optional N-bar validation on the anchor
FREE

Volume Pressure Meter breakdown tick volume to reveal the buying and selling pressure inside every candle. Unlike standard volume which only shows total activity, this indicator splits volume to show who is actually in control of the market. It helps you identify trend strength and spot potential reversals through volume divergence. Key Features: Pressure Gauge: Visual bar showing real-time Buy vs Sell percentages. Trend Bias: Automatically identifies if the market is dominated by Buyers or Sell
FREE

AllTF Trend Bias Indicator is a professional tool to visualize market bias, designed mainly for 1-minute charts. The colors are not trading signals by themselves, but a visual compass to guide your decision-making: HiddenEdge release model
All HiddenEdge tools follow the same structured release plan.
Each indicator is released initially for free to collect feedback.
After reaching a stable user base, it moves to a fixed paid tier.
Some utilities remain permanently free as part of the Hidde
FREE

The SMC Market Structure indicator tracks key price action shifts using Smart Money Concepts (SMC), helping traders identify institutional behavior and overall trend direction. Pro version MT4 version It automatically detects and displays: Break of Structure (BOS) – Signals continuation of trend Change of Character (CHOCH) – Indicates potential reversal Swing Highs and Lows – Used to define market structure and directional bias
Each structural event is clearly marked on the chart, allowing trade
FREE

Hidden Edge – High-Low PreUS High-Low PreUS is a clean and lightweight indicator that marks key reference levels before the US session begins.
It draws a session box from 00:01 to 09:00 CET, identifying the high and low of the Asian session, and includes additional reference elements to support structured intraday trading decisions. Features Draws a rectangular range from 00:01 to 09:00 CET Marks the high and low of the session clearly Plots a horizontal yellow line as a suggested stop level bas
FREE

Manipulation Hunter — Identify Market Convergence with Algorithmic Precision Manipulation Hunter is an advanced indicator engineered to detect manipulation points, structural pivots, and price convergence zones before major directional moves occur.
Powered by a proprietary multi-variable algorithm based on AMD (Accumulation – Manipulation – Distribution) principles, it automatically analyzes price action to reveal key levels where structure, momentum, and institutional footprints align. Wh

Description — DS Weekly Percent The DS Weekly Percent indicator is designed to track the weekly performance of an asset, using the weekly opening price as its reference point. It automatically draws a percentage grid above and below the weekly open, creating levels that represent price variations in configurable increments (for example, ±1%, ±2%, ±3%, etc.). These levels help traders identify reaction zones and equilibrium areas in the market throughout the week. Main Features: Clear visua

Market Structure CHoCH/BOS Indicator for MT5 Overview
The Market Structure CHoCH/BOS (Fractal) indicator identifies key shifts in market direction based on fractal-based structural analysis. It automatically detects Change of Character (CHoCH) and Break of Structure (BOS) signals, two essential concepts in modern price action and Smart Money trading. How It Works
The indicator analyzes swing highs and lows using a fractal algorithm defined by the Length parameter. When price crosses a previous

VWAP Pro by Angel’s is an advanced Volume Weighted Average Price (VWAP) indicator designed for traders seeking precision and clarity in their trading decisions. With this indicator, you can instantly identify market direction and key support and resistance zones based on volume. Key Features: Simple or Double Mode: Choose between a classic VWAP or a double VWAP for greater sensitivity and trend filtering. Configurable Periods: Adjust the calculation periods according to your trading strategy and
FREE
MACD-V — Volatility-Normalized Momentum Indicator Inspired by award-winning quantitative trader Alex Spiroglou ,
the MACD-V is a powerful evolution of the classic MACD — delivering a volatility-normalized momentum framework that produces consistent, actionable signals across all securities and timeframes. While the traditional MACD measures the difference between two EMAs, the MACD-V goes a step further by dividing this difference by the market’s volatility (ATR).
This normalization makes the
FREE
Laguerre RSI Indicator for MT5
To download All Of Our Products , you can click this link: LINK Are you interested in the Wei Wave Indicator Volume : LINK
Are you interested in the Chandelier Indicator : LINK Are you interested in the Wave Trend Oscillator : LINK Are you interested in the Support & Resistance Indicator : LINK Are you interested in the Alpha Trend Indicator : LINK Are you interested in the NRTR Indicator : LINK
Introduction The Laguerre RSI Indicator for MetaTrader 5 (MT5) is

Trend Magic Indicator for MT5
To download All Of Our Products , you can click this link: LINK Are you interested in the Wei Wave Indicator Volume : LINK
Are you interested in the Chandelier Indicator : LINK Are you interested in the Wave Trend Oscillator : LINK Are you interested in the Support & Resistance Indicator : LINK Are you interested in the Alpha Trend Indicator : LINK Are you interested in the NRTR Indicator : LINK
Introduction The Trend Magic Indicator is a smart tool that blends
Trend Strength Index Indicator for MT5 TSI Indicator for MT5
To download All Of Our Products , you can click this link: LINK Are you interested in the Wei Wave Indicator Volume : LINK
Are you interested in the Chandelier Indicator : LINK Are you interested in the Wave Trend Oscillator : LINK Are you interested in the Support & Resistance Indicator : LINK Are you interested in the Alpha Trend Indicator : LINK Are you interested in the NRTR Indicator : LINK
Introduction The Trend Strength Inde
Hi Traders, ChartObjectsSync is a lightweight MT5 indicator that keeps drawing objects synchronized between two charts of the same symbol.
When you draw or modify an object on one chart, the indicator automatically mirrors it on the other — maintaining consistent visuals and levels. The indicator currently supports syncing the following objects: - Horizontal lines - Trendlines - Fibonacci retracements
- Rectangles - Text labels
1- Key Features : Two-chart synchronization: Works seamlessly bet

CRUDE OIL BUY/SELL (3 Min) Technical Overview The CRUDE OIL BUY/SELL indicator is designed for short-term traders focusing on crude oil price movements.
It identifies high-probability buying and selling opportunities based on a combination of RSI levels , SMA trend positioning , and candle structure analysis .
This tool is particularly effective on the 3-minute timeframe , providing clear visual signals and alerts for both momentum continuation and potential reversals. How It Works The indicator

The Timer PRO indicator shows a countdown for the closing of the current candle on the main chart.
Main Features:
Main Timer: Shows the remaining time for the current candle. Changes to alert color (red) when there are 10 seconds or less remaining. It is activated/deactivated with the 'T' key. Multitemporal Panel (MTF): A floating panel that displays countdowns for multiple timeframes simultaneously. When you click on a timeframe in the panel, that specific chart opens. It is activated/deactiv

Liquidity Map Overview The Liquidity Map indicator is an advanced visualization tool based on ICT Smart Money Concepts .
It automatically identifies daily Buy Zones , Sell Zones , and Liquidity Levels , showing where price is likely to reverse or continue based on institutional order flow.
It calculates key levels from the daily session — such as the previous day’s high, low, and midpoint — then derives a premium (sell bias) and discount (buy bias) structure. When price trades into these mapped

DailyPOC 4X — See the Market Like Never Before! If you’re tired of trading in the dark, DailyPOC 4X is designed to change the way you read price action.
This indicator highlights the most important decision zones of institutional traders, including: Daily POC (Point of Control) — the true “magnet” of price, where the highest trading volume of the day occurs. Value Area High and Low (VAH / VAL) — key regions defining the balance between buyers and sellers. Previous Days’ POCs — track how price r
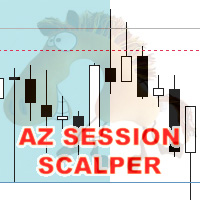
AZ session scalper
A small but useful session indicator, designed primarily for scalping. Enable the session you plan to trade, watch the reaction of the M5/M15 candlesticks to the level of the previous trading session, and enter. We always look at the reaction of the current session to the previous one. For example, if you trade the Americas, enable the European session, and watch how one session takes away liquidity from another. Important: adjust the time to your broker's time zone in the i
FREE
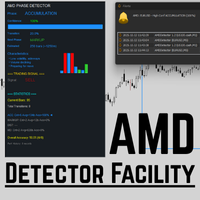
AMD Detector Facility MT5 Description Leading indicator that helps detect market structure phases — Accumulation, Markup, Distribution, Markdown — in real time. Designed for traders using Wyckoff or Smart Money Concepts methods. Features Automatic phase detection based on price dynamics and volume Multi-timeframe confirmation for higher accuracy Smart UI overlay with clear labels and tooltips Real-time alerts when a new phase starts Performance tracker (success rate & average move) Optimized

OrderFlow Vision – Institutional Market Structure Visualizer OrderFlow Vision is a Smart Money Concepts (SMC) indicator designed to automatically detect and display institutional price structure directly on the chart.
It identifies and marks Order Blocks , Fair Value Gaps (FVGs) , Break of Structure (BOS) , and Change of Character (CHOCH) in real time, helping traders understand how price moves in relation to liquidity, imbalances, and structural shifts.The indicator works across all symbols and

RITZ SMART TREND ADAPTIVE FINDER Precision Trend Intelligence. Adaptive. Insightful. Real-Time. Ritz Smart Trend Adaptive Finder is an advanced market intelligence indicator engineered to detect and adapt to evolving market structures with dynamic precision.
It automatically calibrates its analytical period based on real-time volatility, price momentum, and correlation strength — delivering true adaptive trend detection rather than static or lagging signals. By combining Pearson correlation , sl
FREE
Multitimeframe Viewer HiddenEdge – HTF Realtime MiniChart A clear view of higher-timeframe structure — directly inside your main chart.
No need to switch timeframes anymore. HiddenEdge Multitimeframe Viewer shows the last candles of any higher timeframe in a compact, real-time panel — so you can see the bigger picture while staying focused on execution. Key Features Realtime update: the current higher-timeframe candle is drawn live, updating every second. Select how many candles to display:
FREE
AlgoRhythm ZLSMA - The Ultimate Trend Trading Solution Unlock the power of precision trading with AlgoRhythm ZLSMA , an advanced technical indicator designed to deliver razor-sharp trend signals. Engineered for MetaTrader 5, this cutting-edge Zero Lag Smoothed Moving Average (ZLSMA) combines sophisticated smoothing techniques, multi-timeframe analysis, and dynamic bands to give traders a competitive edge in any market. Whether you're a scalper, swing trader, or long-term investor, AlgoRhythm ZLS
FREE

The indicator shows separate breakeven levels for short, long, and total positions. It takes into account all current expenses: swap, spread, and commissions (including those incurred upon closing). It has flexible settings for displaying lines, allows the use of Magicnumber, and enables you to set the desired profit level for each level.
Settings list:
Target profit for Buy trades. Target profit for All trades. Target profit for overall break-even level. Show Buy line. Show Sell line. Show ov
FREE
Volatility Distance Indicator The Volatility Distance Indicator measures in real time the distance between current price and the moving averages you choose, expressed in points . Its purpose is to provide a clear, objective, and quantitative view of the market’s expansion relative to its equilibrium zones , allowing you to instantly assess whether price is in a phase of overextension, compression, or neutrality . Key Features: Point-based measurement: displays the exact distance between current
FREE

An all-in-one indicator that automatically plots all essential price levels for price action analysis, saving you time and enhancing your trading decisions. Tired of manually drawing dozens of lines on your charts every single day? B-Levels is the definitive solution for any trader who bases their strategy on modern price action and Smart Money Concepts (SMC). This powerful tool automates the plotting of all critical levels, keeping your charts clean and allowing you to focus solely on trading o

Mercury GUI Crypto v4.1 — Intelligent, Multifunctional Analytical Suite for Cryptocurrency and Forex Mercury GUI Crypto is a cutting-edge, next-generation indicator specifically engineered for traders active in cryptocurrency and traditional financial markets. It integrates more than 30 analytical modules, displaying critical insights directly on the chart through an intuitive graphical user interface (GUI). The indicator is ideally suited for both scalping and medium-term trading across time

Liquidity Lens See the Market Through the Eyes of Smart Money. Liquidity Lens is a next-generation ICT-style market structure tool designed to reveal the hidden layers of institutional activity.
It automatically identifies support and resistance zones , Fair Value Gaps (FVGs) , session ranges , and market opens/closes — giving you a clean and intelligent view of how liquidity truly moves. This indicator isn’t just about drawing lines — it visualizes how liquidity forms, shifts, and gets taken ac

Gold Flow Master — Institutional Flow Analyzer for XAUUSD Gold Flow Master reveals the hidden structure behind gold price movements by mapping institutional footprints such as Order Blocks, Fair Value Gaps, Liquidity levels, Support/Resistance, Kill Zones, and Fibonacci pockets.
It then scores the current price context to highlight the highest-probability trading zones based on real institutional behavior. Main Features Automatic Detection Bullish and Bearish Order Blocks Fair Value Gaps (FVG) L
Hi Traders, EMA is very popular indicator to determine: trend // support // resistance. Here are the use of this simple yet very powerful Multi-Time Frame indicator: 1- Attach this indicator to your chart . - Choose the desired time frame ( ex: Current, M15, H1, H4, D1,...). - Set your desired EMA periods ( ex: 20, 50, 100, 150, 200,...). - Enable which EMA you want to show by setting the relevant EMA to: True / False (you can show 1, 2, 3, 4 or all of 5 EMAs at the same time). - Set col
FREE

In the fast-paced world of trading, precision and reliability are everything. Traders know that a single false signal can mean the difference between profit and loss. That’s why Super Trend Ultimate X was created: a next-generation trading indicator that takes the proven foundation of the classic SuperTrend and elevates it to an entirely new level of accuracy, stability, and performance.
Unlike the traditional SuperTrend, which relies solely on ATR calculations, Super Trend Ultimate X integrat

FlowSeeker is a custom technical indicator for MetaTrader 5 (MT5), developed by Ultron Trading Solutions ( www.ultrontradingsolutions.co.za ). It is designed to identify momentum shifts and directional changes in the market through two primary signals. Providing visual plots, optional buy/sell arrows, reversal crosses, a multi-timeframe trend panel, a candle timer, and alert notifications. It includes user-configurable settings for signals, plotting, trend trading filters, alerts, and display op
Hi Traders,
Simple, clear, and essential for every trader. It helps keep your chart clean and informative.
// In case you open multiple positions, your chart becomes crowded and messy. Then, you may want to hide "Trade levels" and only concern about the averaging buy or average sell level. // In case you want to know at which price your account would reach the broker’s stop-out threshold (i.e., the price at which your account would be “burned”). //You may also want to get your account's PnL an
FREE

The Elsna ATR is a custom MetaTrader 5 indicator that combines two key features into one clean chart overlay: Average True Range (ATR) Display Calculates the current ATR value for the selected period (default = 14). Can show the value in pips or price units . Candle Countdown Timer Displays a live countdown showing how much time remains until the current candle closes. Updates every second, even when the market is quiet. This indicator helps traders quickly gauge market volatility (via ATR) and
FREE
Time Dashboard MT5 is a powerful and user-friendly MetaTrader 5 indicator designed to provide real-time time zone and clock information directly on your trading chart. Ideal for forex traders and global market participants, this tool displays server time, local time, and the time difference between them, enhancing your ability to manage trades across different time zones. Key Features : Real-Time Time Display : Shows current server time, local time, and their respective time zones with precise o
FREE

Regime Radar — Market Regimes + Bias Stops (MT5) Regime Radar shows the current market regime — Range, Weak Trend, Strong Trend, or Shock — and draws ATR-based stop lines on the chart. It also provides a compact panel with regime, direction, confidence and optional RSI/Bollinger suggestions. This is an analysis tool; it does not provide trading signals and does not guarantee any profit. Main functions Regime detection in four states (Range, Weak Trend, Strong Trend, Shock). Bias indicator with
FREE

BullBear Strength Meter The BullBear Strength Meter is a dynamic market sentiment and momentum indicator that quantifies the real balance of power between buyers and sellers. Instead of relying on a single formula, it fuses multiple proven analytical engines into one comprehensive strength model — giving traders an accurate visual readout of bullish and bearish dominance in real time. This tool measures, compares, and displays the intensity of market forces using advanced statistical and trend-b
FREE

Name: Dynamic Fibo Retracement Short Description: An intelligent tool that automates the plotting of Fibonacci Retracement levels to help you effortlessly identify key potential support and resistance zones. Full Description: Tired of manually drawing Fibonacci lines for every new market swing? The Dynamic Fibo Retracement indicator automates this crucial process for you. It intelligently scans a user-defined number of past bars to find the most recent significant high and low, then instantly pl
FREE
Hi Traders, RSI and Stochastic are among the most popular indicators used to measure momentum and help identify overbought and oversold conditions. This indicator displays two optional RSI and Stochastic values on your chart, helping you save chart space and keep things clean and organized. You can set your desired upper and lower thresholds for RSI and Stochastic to monitor conditions. If the RSI (or Stochastic) value is between the upper and lower thresholds, the text color will remain your de
FREE

Super Strike — The Ultimate Trend Precision System
Super Strike is an advanced trend-following system that combines the proven accuracy of the SuperTrend algorithm with the filtering power of a dynamic Moving Average . Built for traders who demand precision and confidence, this indicator transforms raw price action into a clean, intuitive, and highly informative visual system — a complete framework for making smarter trading decisions.
At the heart of Super Strike lies a dynamic calculation o
FREE

The Luta Volatility Meter is an essential technical indicator for traders in MetaTrader 5 (MT5). It was developed by Eng. Lutandula to clearly measure and visualize market movement, helping you easily identify high and low volatility periods. By calculating the average daily trading range, this tool offers a simple yet powerful way to gauge market activity and potential movement for better trade timing Key Advantages Optimal Trade Timing: Helps you identify whether the market is slow (low vol
FREE
Hi Traders, ATR is one of the most popular indicators used to measure volatility. This indicator displays two optional ATR values on your chart, helping you save chart space and keep things clean and organized. You can set your desired threshold for each ATR to monitor volatility. If the ATR value is greater than your threshold, the text color will remain your default color; otherwise, it will be displayed in red. Happy Trading !
FREE

Fractal Volatility Map — Hurst Heatmap (MT5) Fractal Volatility Map highlights volatility compression before expansion. It paints a five-row heatmap of the Hurst metric over multiple lookback windows and confirms compression with an ATR-based quiet-volatility check. When several rows cluster near neutral and volatility is suppressed, a Compression signal is shown on the last closed bar. This is an analysis/visualization indicator; it does not provide trading signals and does not guarantee any p
FREE
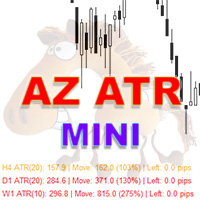
AZ Mini ATR Indicator
By popular demand, I've created a miniature version of the ATR indicator. In addition to its basic functions, such as calculating the average ATR based on specified parameters, it can change the color of a text bar depending on how far the price has already moved. If the price has moved more than 110% of its average ATR, the bar turns red; if it has moved less than 80%, the bar is green. The colors and parameters that influence the color change are configurable. This feat
FREE
STRUCTURAL TREND LINES - MT4/MT5 Indicator
Simple indicator that automatically draws trend lines based on market structure.
Features:
- 3 degrees of structure detection (short, medium, long term)
- Configurable swing strength for each degree
- Single color per degree for clean visualization
- Adjustable number of lines per degree
- Customizable colors and line widths
How it works:
The indicator identifies swing highs and lows based on the strength parameter,
then connects these points to crea
FREE

Engulfing Zones MT5: Your Edge in Price Action Trading Description The Engulfing Zones MT5 indicator is a sophisticated, non-repainting tool designed to automatically detect, highlight, and track the most significant Engulfing Candle Patterns (EG) and, crucially, Engulfing Failures (EF) on your chart. Developed by Coders Guru (XPWORX), this indicator goes beyond simple pattern recognition by drawing persistent, dynamic support and resistance zones based on these high-probab

This indicator combines Laguerre RSI with ATR volatility adaptation to calculate dynamic levels that adjust to market conditions. The tool features adaptive bands that respond to price movements with precise color-coded signals. The key advantage lies in its automatic coefficient adjustment based on ATR periods, enabling more accurate trend detection and level breakouts. Signals are generated when price crosses the upper or lower dynamic bands, providing real-time trading insights.
您知道为什么MetaTrader市场是出售交易策略和技术指标的最佳场所吗?不需要广告或软件保护,没有支付的麻烦。一切都在MetaTrader市场提供。
