 MetaTrader 5
 专家
 指标
 程序库
 实用工具
 窗口小部件
 规则
适用于MetaTrader 5的免费EA交易和指标 - 52
 使用EA交易和指标,使外汇交易获得更多盈利。EA交易可使您自动开启和关闭交易,而指标将帮助您更准确地预测市场行为。
该页面提供MetaTrader 5应用程序的目录。

This utility automates Take Profit (TP) and Stop Loss (SL) levels for your trades, calculated in Pips . It ensures consistent risk management for all your positions. Crucial Note for Manual Traders: If you intend to use this utility on trades opened manually (without an Expert Advisor), you must change the 'Magic Number' setting to 0 (zero) . This allows the utility to correctly identify and manage your manual orders.
FREE

GOLD QUANTUM MATRIX V1.09 >>H4>>Gold Only<< "You can start with 1,000 USD on a Standard account or 3,000 to 10,000 USC on a Cent account." SMC Confluence Engine: It operates on the primary timeframe (such as H4) to detect Market Structure Breaks (BOS) . It identifies ICT-style Order Blocks (ODB) . It filters order block quality by checking for price imbalances/FVG and ensuring the zone remains unmitigated . It also includes a 2-Layer Liquidity Sweep module to detect equal highs/lows and deep
FREE

The “Displaced Moving Averages Suite” indicator is not part of the standard technical analysis library; rather, it was adapted from the “Hull Suite” indicator, published for free by InSilico in the TradingView community library. The system is based on the principle of shifting the moving average line selected by the user backward relative to that same moving average, but at the present time. It is at the crossover of these two moving averages that a bullish or bearish signal is generated. Addi
FREE

The WaveTrend Oscillator indicator is an enhanced version of the classic WaveTrend Oscillator, a momentum indicator. It is designed to identify overbought/oversold conditions and provide potential trend reversal signals. The core difference in this version is the application of a data "normalization" algorithm. This ensures the indicator's oscillation lines remain balanced around the zero line, causing the indicator window to always stay naturally centered. This is especially useful when trading
FREE

MT5 Auto Trading of Gold : Market Struture(Key Level) and Liquidity Breakout Strategy
Key features include: Breakout Trading - Smart Money Concept: Automatically identifies demand and supply zones at swing highs and lows, targeting the most critical market levels. Risk & Order Management: Progressive and flexible lot sizing with consistent take profit and stop loss ensures a balanced approach to growth and recovery. Optional Trailing Stops & Breakeven: Flexible features to customize
FREE

[Power Volume Candle] - Indicator to see the comparison of bullish and bearish volume
Volume comparison indicator on candlestick, by calculating the volume value of the specified candle history to determine the percentage of volume strength. calculates the percentage comparison of each time frame displayed on 1 screen. See other products here (MQL Algo) Forex Tools Subscribe the MQL5 channel for other interesting information : (Automatic) Forex Tools Join new Public Group to Expressing Opinio
FREE

The MACD Overlay Pro brings the classic Moving Average Convergence Divergence (MACD) indicator directly onto your main price chart . By plotting the MACD Line, Signal Line, and an additional trend-confirming SMA directly over price candles, this tool eliminates the need to constantly glance at a separate indicator window, allowing for more focused technical analysis . Designed for clean visualization, this indicator uses dynamic color-coding to highlight trend direction and a semi-transparent fi
FREE

EA可以通过搜索并平掉盈利仓位来平掉无利可图的仓位 。
该助手 在所有位置中 寻找 终端中 最 无利可图的位置 。 进一步地,通过搜索剩余的盈利头寸,他计算出当一个或多个头寸的 利润 大于另一个头寸的损失时可以弥补损失的一系列头寸。 如果找到一组此类头寸,顾问就会将其平仓。 一系列位置可以由任何位置组成。 它们的最大数量可以在顾问设置中调整。 您还可以指定搜索的最小损失和平仓的额外利润。 MT4版本
详细描述 如何购买
如何安装
如何获取日志文件 如何测试和优化 Expforex 的所有产品 您可以在策略测试器中测试 Expert Advisor,并在可视化模式下使用我们的 EAPADPRO 工具栏进行交易! 近减加加在图表上的工作原理 认为 您以 1.600 的价格开设买入 #1 仓位; 价格跌至 1.550 ,目前亏损 -50点; 盈亏平衡点(平均价格)= 1.600 ; 如果我们打开 SELL #2、Sell #3 和 Sell #4; EA 交易开始执行主算法。 那么总利润将为+5$; 智能交易系统 (EA) 激活算法,并且必须平仓
FREE

AI Range Compression Breakout Trader — MetaTrader 5 Trading Robot AI Range Compression Breakout Trader is a fully automated MetaTrader 5 Expert Advisor built around a market-tested idea: price ranges that compress tightly relative to their own historical average are frequently followed by a strong directional expansion. The robot measures the current short-term range against a longer-term baseline range on the same symbol, waits for a genuine squeeze condition, and then arms itself to trade the
FREE
本指标是一款众所周知的 MetaTrader 4 指标,现直接免费在互联网上提供。它完全不会重绘。 它实现了一类突破策略。箭头指示行情的方向。在 M15 或更高时间帧里使用此指标。
FREE

CV MultiFrame MiniCharts – Professional Multi-Timeframe Analysis for MetaTrader 5 CV MultiFrame MiniCharts is a professional multi-timeframe indicator for MetaTrader 5 that displays multiple native MT5 charts with different timeframes directly inside the main chart. Instead of constantly switching between timeframes, traders can monitor short-, medium-, and long-term market movements simultaneously. Up to 8 individually selectable timeframes can be displayed and automatically sorted. Features Up
FREE

Foyda King EA — Session-Based Trend Trader Trend Following Session Filter Risk Management Pending Orders Short description A professional trend-following Expert Advisor based on Smoothed Moving Average (SMMA/RMA) breakout confirmation with built-in session filter, automatic stop-loss, take-profit, and margin safety checks. Full description Foyda King EA is a fully automated trading system that identifies high-probability breakout setups using a two-candle confirmation strategy built on the Smoo
FREE

Algo Edge EA -DE40/ Tec100 EA working with high and low from last Candle. Self learning EA just set the EA on the Chart and Start no Settings optimization.
AUD/USD, EUR/USD, DE40, US30, Tec100 and much more. Multifunctional Expert Advisor can trade with every Forex Pair or Indize. EA can Trade with every Broker. M1 high, M30 medium, H1 low Risk. Functions: For other Indize example US30: Change the Robot Worktime in Europe to 16:30-21:30
-inp1_ =Robot Worktime inp_2 and inp_4 VolumePercent =
FREE
The indicator determines and marks the short-term lows and highs of the market on the chart according to Larry Williams` book "Long-term secrets to short-term trading". "Any time there is a daily low with higher lows on both sides of it, that low will be a short-term low. We know this because a study of market action will show that prices descended in the low day, then failed to make a new low, and thus turned up, marking that ultimate low as a short-term point. A short-term market high is just
FREE

CoinSmith CoinSmith 是一款自动交易 EA(Expert Advisor),它的主要优势并不是追求激进的利润,而是以平稳、谨慎、更加稳定的方式进行长期运行。它的设计目标是在市场中按照纪律和明确的系统进行交易,而不是混乱地追逐快速利润。 在交易逻辑上,CoinSmith 使用结构化网格策略,并根据市场波动率自动调整步长,同时具备模式切换和整体订单篮子利润控制功能。 CoinSmith 最适合主要货币对,例如 EURUSD、GBPUSD 以及其他类似的高流动性 Forex 外汇货币对。在用于其他交易品种之前,建议先在 MetaTrader 5 策略测试器中进行详细测试。 为什么 CoinSmith 赚钱较慢,但更好 CoinSmith 并不是一个“快速赚钱”的机器人。而这正是它的优点,不是缺点。 那些赚钱非常快的 EA,通常是通过承担更高风险来实现的。这往往意味着更激进的进场方式、更大的账户资金压力,以及当市场长时间朝单一方向运行时,更容易陷入不利局面。而这正是快速盈利型机器人经常暴露弱点的时候。 CoinSmith 采用的是另一种方式:它更加耐心,也更加谨慎。因此,利润
FREE

Quantora Smart Trend PRO MT5 Quantora Smart Trend PRO MT5 is a technical analysis indicator for MetaTrader 5 that combines trend, momentum, volatility, and multi-timeframe data in one chart-based tool. The indicator uses SuperTrend, moving averages, ATR, ADX, and RSI values to calculate trend conditions and display BUY or SELL signals when the selected confirmation requirements are met. Trend and Signal Information SuperTrend-based trend calculation Moving average confirmation Trend cloud displa
FREE
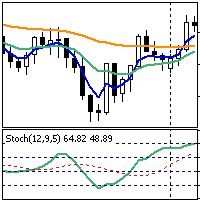
This is a simple trend strategy for Forex. Recommended timeframe is H1, the default settings are for the GBPUSD currency pairs (for other timeframes and currency pairs, it is necessary to select other indicator settings). The following indicators are used in the strategy: Exponential Moving Average: EMA (4) — blue Exponential Moving Average: EMA (13) — green Exponential Moving Average: EMA (50) — orange. Stochastic Oscillator (12,9,5), levels — 20, 40, 60, 80. A buy trade is opened at the openin
FREE

在进场之前就知道今天的行情已经用掉了多少。ADR Levels MTF打印出一个正常的交易日仍可能触及的两个价格,标出区间被走完的那根K线,并把已消耗的百分比放到面板上,这样一次迟到的进场就不会再看着像一次新鲜的进场。它从您所在图表自身的K线里切分出每一天,因此M5和H4上的数字一致,也没有第二个数据源需要等待。它是免费的:没有试用期,没有锁定功能,没有升级页面。 平均日波幅是最近若干个完整交易日波幅的均值,出厂值为五天。当日据此得到两个投影:当日最低价加上ADR,也就是一个普通交易日向上能走到的位置;另一侧则是当日最高价减去ADR。两者之间的那条线,是这一天已经走过的区间的中点。 每一天是按时间戳从图表自身的K线中切分出来的,而不是另行向D1索取,因此本产品在任何时间周期上读数一致,扫描器每个品种只需要一条序列而不是两条。这一选择的代价被明确说出来:在较小的时间周期上,扫描窗口里能装下的天数很少,所以这里的窗口默认更大,而ADR按实际找到的完整交易日来计算。三天而不是五天意味着ADR不那么稳定,但那是一个诚实的数字,而不是一个空白单元格。 图表上有什么 在价格窗口里绘制:这一天已经走
FREE

XpertTrader OBV - Advanced Trading System Professional Expert Advisor with On-Balance Volume (OBV) analysis and comprehensive risk management Overview XpertTrader OBV is a sophisticated trading system that combines On-Balance Volume (OBV) analysis with advanced technical indicators to identify high-probability trading opportunities. The system features multiple filtering layers, comprehensive risk management, and flexible trading modes suitable for various market conditions. Key Features On-Bal
FREE
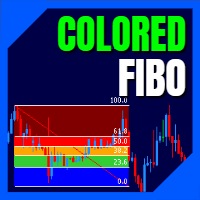
LT Colored Fibo is a simple indicator that paints the price zones between Fibonacci Retracement levels. Its configuration is extremely simple. It is possible to change the colors of each level of the retracement, choose between background or front of the chart and also work only with the current asset or all open. If you found a bug or have any suggestion for improvement, please contact me. Enjoy!
This is a free indicator, but it took hours to develop. If you want to pay me a coffee, I apprecia
FREE

The RFOC Candle Timer 2x was created for the trader to locate himself in time, having access to the pending time for the formation of a new candle. Additionally, it is possible to include in the chart a second timer that shows the pending time for the formation of a new candle in a time period different from the current one. The user will have the option to select up to 4 different positions for the timer display ("No candle", lower left corner, lower right corner or upper right corner). In ad
FREE

AI Chart Assistant MT5
AI Chart Assistant MT5 is a professional manual chart intelligence exporter for MetaTrader 5, designed for traders who want to use ChatGPT with real, structured and deeply prepared MT5 market context.
Most traders use ChatGPT for trading analysis by typing simple questions like:
“Analyze this chart” “Should I buy or sell?” “Find support and resistance”
The problem is that ChatGPT cannot properly analyze a chart without complete market context.
AI Chart Assistant MT5
FREE

Gold TrendGuard Pro Gold TrendGuard Pro is an advanced Expert Advisor designed specifically for XAUUSD (Gold) trading. It utilizes a highly sophisticated hybrid trend-following grid system that prioritizes market momentum and deploys controlled pullback logic only when necessary. Unlike traditional, aggressive grid systems that average down blindly, this EA initiates trades using Buy Stop and Sell Stop pending orders to ride strong breakout movements. If the market experiences a temporary retrac
FREE
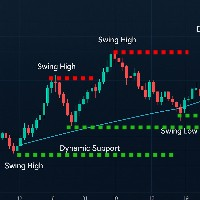
A professional swing point detection indicator that identifies key highs and lows with precision. Features include: Smart Detection : Identifies swing highs/lows based on customizable left/right bar analysis Visual Alerts : Clear arrows and labels (optional) mark swing points Dynamic Lines : Draws support/resistance lines that disappear when price touches them (toggle on/off) Real-Time Alerts : Sound and popup notifications for new swings Non-Intrusive : Preserves all manual chart drawings Perfe
FREE

Grid Scalp Master Indicator Grid Scalp Master Indicator is a powerful, visual-centric market momentum and grid simulation system engineered specifically for MetaTrader 5. It translates complex mathematical breakout and asymmetrical grid logic into a clean, actionable visual framework directly on your chart layout. Designed for traders who want the precision of a grid execution model without giving up manual control, this indicator tracks high-probability breakout zones, maps dynamic grid layers,
FREE

XAU Imbalance Proxy H4 Expert Advisor for MetaTrader 5 — Gold / XAUUSD focus
Version: 1.00 What it is XAU Imbalance Proxy H4 is an Expert Advisor for gold on the H4 chart. OHLC imbalance proxy participation for gold (not real footprint DOM). Built for structured automated participation — not grid , not martingale . Evaluate on your broker and risk profile before any live use. This product is a technical system . Exact thresholds and entry equations remain internal product design and are not pub
FREE

Heiken Ashi candles drawn in the main chart window, with the option to hide the chart's own candles so only the Heiken Ashi bodies remain. Heiken Ashi averages each bar with the one before it. Direction changes less often than on standard candles, which makes a trend easier to hold and a stall easier to see. It is a different way of drawing the same price, not a signal. What it does Plots Heiken Ashi open, high, low and close as coloured candles Separate colours for rising and falling candles Op
FREE

动态RSI卫士 – 精准交易与全面风险管理 动态RSI卫士是一款专为重视稳定性能、严格风险控制和灵活性的交易者设计的专业算法交易系统。基于先进的点差计算和智能RSI驱动的过滤器,它确保每笔交易遵循严格的规则,以最小化风险,同时最大化机会。 主要功能 : 智能入场系统
• 基于RSI的多重过滤器确认
• 检测高概率信号并在图表上以箭头可视化 全面风险管理
• 基于风险百分比的动态手数计算
• 最大持仓量和交易检查(防止过度交易)
• 无效止损水平保护 高级退出策略
• 基于ATR或固定点差的追踪止损
• 可调止损和止盈(基于点差)
• 自动调整止损以适应经纪商限制 可视化HUD仪表板
• 实时状态(买入、卖出、阻止)
• 市场条件显示
• 信号跟踪和分隔线 支持回测与优化
• 专为剥头皮和日内交易设计
• 适用于多个交易对和时间框架
• 易于优化以适应不同策略 策略与使用 :
动态RSI卫士在低延迟环境(ECN/STP经纪商)中表现最佳。
推荐使用: 交易对 :EURUSD、GBPUSD、XAUUSD(黄金)、US30 时间框架 :M1 – M15 低点差经纪商以获
FREE

The TradingView-style hide-drawings button MT5 never had
"From the maker of Risk Sentinel — risk-first position sizing that keeps your risk fixed as you drag the stop: https://www.mql5.com/en/market/product/185711 "
Hide/Show Drawing is a one-tap chart-cleanup utility for MT5. Hide all your drawings — or just trendlines, Fibs, shapes, or text — to read raw price action, then restore everything exactly as it was, per-timeframe settings and all. Nothing is deleted; every object stays in memory a
FREE

The EU_15_111517128_S_Op_CF_SQ3 is an algorithmic trading strategy for MetaTrader, tested on EURUSD using the M15 timeframe from April 1, 2004, to April 24, 2024. There is no need to set up parameters, all settings are already optimized and fine-tuned.
Recommended broker RoboForex because of EET timezone.
You can find the strategy source code for StrategyQuant at the link: https://quantmonitor.net/eurusd-bollinger-bands-breaker/
Key details are:
Main Chart: Current symbol and timeframe
FREE

Mega MNFM MT5
Mega MNFM brings ten technical readings, a seven-timeframe trend map, regional session clocks and account-deal statistics into one MetaTrader 5 dashboard.
Technical dashboard RSI, MACD histogram, Stochastic, EMA trend, ADX, Bollinger Bands, an asset technical Fear & Greed proxy, an indicative synthetic dollar basket, ATR rank and OBV flow. Readings use completed candles. The timeframe map covers M1, M5, M15, M30, H1, H4 and D1. The dashboard includes a directional summary, trend
FREE

VOLUMIZED ORDER BLOCKS [Riz] - MT5 Indicator Smart Money Order Block Detection with Volume Analysis
Volumized Order Blocks is an advanced Smart Money Concepts (SMC) indicator that automatically detects institutional order blocks with integrated volume analysis. It identifies high-probability supply and demand zones where banks and institutions
FREE

让盈利单利润最大化,在行情顺势时持续锁定利润。Auto Trailing Stop Manager 是一款 MT5 移动止损工具,可平滑地让止损跟随当前价格,既保护利润,又给订单留出波动空间。 无需手动拖动止损,EA 按精确的 Start、Stop、Step 参数自动完成。适合想抓住大趋势又不想让利润裸露的交易者。 主要功能 - 动态锁定利润:订单盈利后,止损与价格保持固定距离跟随。 - 自定义步长(Step):精确控制止损更新频率(如每 1 点),避免频繁请求经纪商服务器。 - 延迟启动(Start):行情朝有利方向运行 X 点后才开始移动止损。 - 多品种:单个图表,或在一个窗口管理多个货币对。 - Magic Number 过滤:管理手动订单或其他 EA 的订单。 参数说明 - Auto Trailing Stop:开/关。 - Start:启动移动止损所需的盈利点数。 - Stop:价格与止损之间保持的距离(点)。 - Step:再次更新止损所需的最小移动。 - Symbols:要管理的品种(如 EURUSD)或当前图表。 - Magic Number:选择 EA 管理哪些订单
FREE

WONNFX iSTATS: Account Statistics on Your Chart A free indicator for MetaTrader 5. It shows your account’s trading results in a compact panel right on the chart: balance, equity, profit for the day, week, month, quarter and year, plus key risk metrics. No reports, no History tab, no calculators: everything you need at a glance. The indicator does not trade. It never opens or closes positions; it only reads the account history and open positions.
Features Account card Balance and equity in larg
FREE

Fer Scalphunter Bot is an advanced Expert Advisor (EA) designed for MetaTrader 5 that combines a volatility breakout entry strategy with an intelligent recovery system using Grid and Martingale. Its goal is to capture strong market movements and manage adverse trades through controlled averaging. The bot stands out for its robust risk management system, including news filters, daily loss limits, and an exclusive Support and Resistance (S/R) filter to avoid entries in dangerous zones.
SPECIAL O
FREE

APICT Smart Trendline and Pattern Tool APICT Trendline + Pattern Indicator is a powerful all-in-one technical analysis tool designed to automatically identify market structure, draw dynamic support and resistance trendlines, and detect high-probability chart patterns in real time. Smart Trendline Detection The indicator automatically draws major and minor trendlines , clearly marking key support and resistance levels based on market structure. Separate controls for major and minor trends Adju
FREE

TradePilot MT5 是一个功能全面的交易面板,可让您几乎完全掌控您的交易。它旨在适应多种交易策略,并基于两种交易方式构建:手动交易和由其引擎驱动的自动化交易。
1/ EA 手动功能 Multi-Positions = 主仓位:始终以设定好的止损(SL)、止盈(TP)和手数参数开仓。 子仓位:可从 0 到 20 个附加仓位。
它们共享相同的止损(SL)和手数,但其止盈(TP)会根据用户设定的数值递增。
(示例:TP 增量 = 30 点 → TP1 = 30,TP2 = 60,等等。 模式:通过切换按钮可选择三种下单模式:
MARKET、LIMIT 和 STOP。
挂单会同时触发主仓位和子仓位。 Basket Engine = 该面板(basket)可用于查看您的仓位及仓位组信息:类型(Buy/Sell)、仓位数量、盈利等。
同时也可以选择某一组或单个仓位进行修改 Trailing by Step = 分步跟踪止损功能,其步长由用户自定义。
提供 ON/OFF 按钮以增强安全性。
️ 使用前请务必先激活(arm)跟踪功能:
ENGAGE:启动跟踪
DISENGAGE:停止
FREE

---คำเตือน EA ตัวนี้เหมาะสำหรับโบรคเกอร์ที่ Slippage ต่ำ--- EA ตัวนี้ถูกสร้างมาด้วยหลักการ Long Straddle ของ Option ที่จะวาง Position ดักทางทั้ง 2 หน้า หากราคาไปทางใดทางนึงจนเกินระดับราคา Break Event จะกำไรไม่จำกัด เเต่ถ้าราคาผิดทางจะขาดทุนแค่ค่าพรีเมี่ยม ดังนั้นเมื่อข่าวออกการที่กราฟฉีกตัวไปทางใดทางนั้นบน Option สามารถสร้างกำไรได้ทันที แต่เนื่องจากการเทรด XAUUSD Spot CFDs ไม่ได้มีหลักการขาดทุนเเค่ค่าพรีเมี่ยม การ ฺ Buy Sell สามารถกำไร/ขาดทุนได้ไม่จำกัด ดังนั้นการเทรดข่าวด้วยเครื่องมือ EA News
FREE

Pairs Spread ZScore — is a statistical pairs-trading indicator for two correlated instruments. By default it is configured for BTCUSD against ETHUSD, a widely traded crypto pair, but any two correlated symbols available on your broker can be used as the second instrument. How it works The indicator builds a normalized spread between the base symbol and a second symbol (Symbol2) using a rolling lookback window (Period). Both price series are standardized before the spread is calculated, so the
FREE

Next Arrival : Flip or Die Trading Arena. Flip a trading account: https://flipordie.com/chapter-1-thirteen-doublings-double-a-trading-account/ This indicator visually highlights the Asian, London, and New York trading sessions on your chart using colored rectangles. It automatically calculates and displays the high, low, and price range (in pips) of each session for the most recent day. The session ranges are drawn for a configurable lookback period, allowing you to review session price action
FREE

BeatCoin v6 — Structure-Based Trading System for MT5 BeatCoin v6 is a rule-based Expert Advisor designed to trade market structure instead of emotions . The system focuses on consolidation, breakout behavior, volatility, and trend context , rather than chasing signals or forcing trades. BeatCoin was developed and optimized specifically for Bitcoin price behavior , where lateral ranges and expansion phases frequently occur. What BeatCoin v6 Does BeatCoin identifies lateral market structures
FREE

================================================================================ LUNOX SB-KILLZONE v2.0 - Professional Session Breakout Trading System ================================================================================
OVERVIEW -------- Lunox SB-Killzone is a sophisticated algorithmic trading system designed for professional traders who understand institutional market structure and session- based trading dynamics. The Expert Advisor implements proven session breakout methodologie
FREE
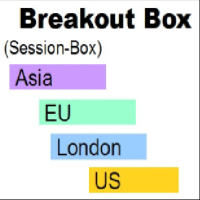
BREAKOUT-SESSION-BOX LONDON EU US ASIA Open
watch the expectation of a volatile movement above or under the opening range We take the high of the range as Entry for a long trade and SL will be the low of the range and vice versa the low of the range as Entry for a short trade and the high for SL The size of the range is the distance to the TP (Take Profit) The range of the opening hours should not be larger than about 1/3 of the average daily range 4 breakout examples are already predefined: A
FREE

BB RSI Mean Reversion Pro is a MetaTrader 5 Expert Advisor that trades mean reversion setups using Bollinger Bands and RSI confirmation. It is designed for major forex pairs on the H4 timeframe and includes optional Donchian filtering, trailing stop, break-even logic, session filtering, and configurable risk controls. Recommended pairs are EURUSD, GBPUSD, and USDCHF. Product Description BB RSI Mean Reversion Pro for MT5 BB RSI Mean Reversion Pro is a MetaTrader 5 Expert Advisor designed to trade
FREE

请给Gold Champion Basic EA一个五星好评,让公益免费被鼓励 ! Gold Champion Basic EA 是The Gold champion EA的基础版本,是一款追随趋势的EA。 Gold Champion Basic EA 只保留了 The Gold champion EA的7个策略中的策略3,只有一个策略。 请注意,单独一个策略3的订单数量并不多。你需要长期坚持使用此Basic版本EA才会取得良好绩效。 实时信号: https://www.mql5.com/en/signals/2374089 参数设置: setting file . 如果你对于EA设置有不明白的地方,你可以在这里讨论: Click here 加入公众讨论群。
Gold Champion Basic EA , 在价格突破关键点位时,订单会入场。订单入场之后,会立即设置一个小的止损,随着价格朝着有利的方向运行,移动止损会启动,它会保护本金,然后保护你的利润。没有大额的止损,没有马丁,没有网格,你不用担心账户会突然爆炸。突破的方法,适合长期追踪XAUUSD的价格波动,运
FREE

Precious Metal Z-Score Hybrid - Ultimate EA Version: 6.70 Strategy Overview This Expert Advisor is a sophisticated, fully automated trading system designed specifically for the XAUUSD (Gold) market. It operates on a powerful hybrid model that combines a precise statistical entry signal with an advanced, multi-layered risk and trade management engine. The core strategy can be broken down into two main components: Signal Generation (Z-Score Engine): The EA initiates trading cycles based on a stat
FREE

The Magic SMA indicator is of great help in determining trend direction. It can be an excellent addition to your existing strategy or the basis of a new one. We humans can make better decisions when we see better visually. So we designed it to show a different color for rising and falling trends. Everyone can customize this in the way that suits them best. By setting the Trend Period, we can optimize it for longer or shorter trends for our strategy. It is great for all time frames.
IF YOU NEED
FREE

Session Box Indicator for MetaTrader 5 IMPORTANT NOTE: **A new input parameter ( Skip weekends ) has been introduced which must be set to false for markets opened 24/7** Version 1.00 Release Version 1.01 Complete code rewrite Version 1.02 Fix: added missing font name and removed emoji as session name, added label positioning Version 1.03 Fix: proper weekend handling, complete minute support for all sessions, independent label position
Description: The SessionBox indicator is designed to visu
FREE

EA CRT Bollinger Bands - Sistema CRT (Candle Range Theory) con Bandas de Bollinger Fundamento Teórico Implementación de la Candle Range Theory (CRT) integrada con análisis de Bandas de Bollinger para la identificación sistemática de oportunidades de trading. Candle Range Theory (CRT) Teoría del Rango : Análisis de la estructura completa de la vela (cuerpo y mechas) Proporciones Armónicas : Relaciones específicas entre componentes de la vela Umbrales Operativos : Parámetros definidos para mec
FREE

Jackson Support and Resistance V it a powerful advance support and resistance indicator which provide signal base on price action, it Design to make things easy for everyone to draw support and resistance. we believe most strategies are built with support and resistance as a foundation .Having support and resistance perfect can be a game change to you way of trading. It flexible to all instrument .don't forget to watch our video on how to us this indicator prefect and progressive.
FREE

Multi Symbol Comparison GDXM The Multi Symbol Comparison GDXM is a professional-grade institutional analysis tool designed for traders utilizing Smart Money Concepts (SMC) and ICT methodologies to identify market divergences and "cracks in correlation" (SMT - Smart Money Technique). Unlike standard comparison indicators, this tool allows you to visualize up to 5 assets simultaneously, normalized on a 0–100% efficiency scale. This makes it effortless to identify which asset is leading or failing
FREE

Rolling Percentiles Indicator 1. What the indicator does Rolling Percentiles draws three lines on the price chart. Each line is a percentile of the last N prices (the rolling window): Upper line (green): the upper percentile, 75th by default. Median (white, thick): the 50th percentile, always fixed. Lower line (red): the lower percentile, 25th by default. It is a non-parametric channel. Where Bollinger Bands assume price is roughly bell-shaped and measure it with a mean and standard deviation, t
FREE

ORP Oscillator ORP Oscillator is a free custom indicator for MetaTrader 5, developed around XAUUSD analysis. It displays directional balance through two smooth curves on a fixed scale from −100 to +100, with all intersections occurring at the central zero line. The indicator combines recent price movement with a measure of how observed pullbacks recover. It is a visual analysis tool and does not open, manage or close trades. How to read the oscillator • Green above zero: the calculated bullish s
FREE

super power fantastic trading Ea for mt5 it works on all pairs all frames it has many super parameters it have inside 11 high quality strategies you can switch between them it works on trend follow , scalping, martingale, grid, vwma, momentum , volatility, sbnis and adaptive also the best that you can controls tp and stop loss on pips and on money also you can control lots how to use that amazing Ea ? go to inputs parameters you have 11 strategies on that ea double click on strategy then choose
FREE
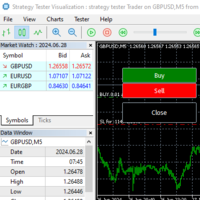
Gives you a trading environment where you can do forward testing without the use of a live trading account. You will be able to trade the same Market without having to wait for the next day, but by just fast forwarding on the strategy tester and going straight to that session. You can trade it over and over again without having to just look at the charts and have a bias analysis when back testing on a chart that is not moving
FREE

XAUUSD Adaptive Edge M15
多策略黄金EA • 风险控制 • 无马丁格尔 • 无网格
XAUUSD Adaptive Edge M15 是一款主要为 XAUUSD(黄金) 和 M15 时间周期设计的 Expert Advisor。
EA 将多个独立的 Buy 和 Sell 策略、可配置的市场条件过滤器以及多层风险控制功能结合在一起。
它的主要目标很简单:分析当前市场环境,寻找符合策略规则的交易机会,并按照预设的风险和交易参数管理交易。
介绍 XAUUSD Adaptive Edge M15
黄金价格可能快速波动,市场条件也可能在交易日内发生变化。
XAUUSD Adaptive Edge M15 不依赖单一交易条件,而是采用多策略架构。
EA 包括:
- 5 个独立 Buy 策略 - 5 个独立 Sell 策略 - 可配置市场过滤器 - Stop Loss 和 Risk/Reward 管理 - 每日盈利和亏损限制 - 连续亏损保护 - 最大同时持仓限制 - 新闻保护 - 最大持仓时间限制
每个策略都可以单独启用或关闭。
用户可以根据自己的测试
FREE
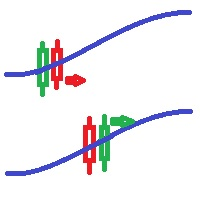
Bollinger bands out/in strategy A strategy created by Joe Ross, and very useful for finding trades when the market is overloaded. Indicator You don't need to find where there are entries on the chart, this indicator shows them for you. The entrance The trade is confirmed when the price closes outside the bollinger bands on a candle and the candle after the price closes inside the bands. comment I want to improve this indicator, so you can help me sending me your reviews and comments, thanks :).
FREE

XE Forex Strengh Indicator MT5 displays visual information about direction and strength of a signal for current pair and chosen timeframes (M5, M15, M30 and H1). Calculations are based on multiple factors and results are shown as a colored panel with scale bar, numerical values and arrows. There are also displayed values of current price and spread on the pair. There can be activated an alert (as a mail or pop-up window with sound) for each available timeframes which send a message when the dir
FREE

IcebergSeal — Prop-Grade Risk Engine with Liquidity Sweep + FVG Entries for Gold (XAUUSD) IcebergSeal is an Expert Advisor built around one priority: protect the account first, find entries second. It was designed for prop-firm evaluation accounts, where the rules (daily loss limits, trailing max drawdown, consistency requirements, news restrictions) are stricter than any retail environment — and where surviving those rules matters more than catching every move. The signal model:
H4 trendline-br
FREE

Prop Firm Titan EA: Automated Gold Prop Firm Trader Prop Firm Titan EA is a Gold Expert Advisor, developed exclusively for Prop Firms , trading Gold (XAUUSD) on the 5-minute timeframe (M5) . It executes a comprehensive process, including technical analysis, trend alignment protocols, sophisticated entry filters, and an intelligent profit optimization system to maximize trade quality . It does not use neural learning or AI — instead, it prioritizes risk management and sustainable account growt
FREE

This strategy uses Bollinger Bands and the Relative Strength Index (RSI) to identify potential trade opportunities. It is designed for both mean-reversion and trend-following approaches, making it suitable for various market conditions. How It Works: Bollinger Bands assess volatility and identify overbought/oversold conditions. RSI gauges momentum and confirms potential market reversals. Trade Entry: Buy: When the price reaches or falls below the lower Bollinger Band, and the RSI is below 30 (i
FREE

Breakout in Confidence Session Range Breakouts • EMA Momentum • Order Blocks Breakout in Confidence is an intraday breakout-analysis indicator designed to help traders identify and evaluate Opening Range Breakouts (ORB) across three major market sessions: Asian London New York Each session can be independently enabled and its Opening Range can be calculated using M5, M15 or M30 data. The indicator then extends the established session range using Fibonacci-based projection levels while incorpora
FREE

免费获取我所有的 MT4 和 MT5 指标 — 点击这里了解方法
新工具 售价 $30 限于 首周 或 前 3 次购买 ! MQL5 Trading Tools 频道 : 加入我的 MQL5 频道,获取我的最新动态 Custom Indicator Buffer Analyzer 帮助识别 MetaTrader 5 中 Custom Indicator 使用的缓冲区索引和比较值。 当您想把外部指标用作 EA 的信号源,却不了解以下信息时,本工具很有用: 哪个缓冲区包含 Buy 信号。 哪个缓冲区包含 Sell 信号。 应该检查哪个数值来判断是否存在信号。 指标在无信号时使用 EMPTY_VALUE、0 还是其他值。 1. 准备 Custom Indicator 请将待分析的指标安装到: MQL5\Indicators\ 所需数据必须通过指标缓冲区提供。如果指标仅通过箭头、标签、文字、矩形或趋势线等图表对象显示信号,而不通过缓冲区提供相同数据,本工具便无法依据缓冲区索引识别这些信号。 2. 选择 Custom Indicator 输入待分析指标的路径。此路径
FREE

此免费EA专用于M5时间周期。 此外,交易货币仅限日元(JPY)计价。 其设计规格不支持以美元(USD)或欧元(EUR)计价进行回测或实际交易。 交易手数也固定为0.01。 请将其视为仅供回测使用的测试版EA。 由于我本人也在实际前瞻交易中使用该EA,如果下载实时信号的需求持续增加,我计划将其公开。
TYO EA LAB的开发理念
TYO EA LAB致力于开发融合了自营交易公司运作理念的量化EA。 我们重视的并非单个EA的短期业绩,而是多种策略组合后的稳定性、分散性以及实际操作中的可复现性。
在开发过程中,除了长期验证数据外,我们还运用了基于AI的数据挖掘技术。 通过对市场数据进行多角度分析,提取如时间段、月度趋势、价格波动偏向等反复出现的统计优势,以此构建交易逻辑。
此外,TYO EA LAB的EA作为量化EA,其设计前提是支持多策略同时运行。 各EA虽各具特色,但设计上旨在使整个投资组合协同运作,其真正的优势在组合运行时比单独运行更能充分展现。
TYO EA LAB以 AI ×
FREE

INFORMATIVE
There is no price for this Trading System "AvA - 8 limited" it is free of charge.
It has limited input parameters and limited number of levels for GAMMA and DELTA modules, but it has enough for you to try and even trade, it is fully functional. The paid version is of course ideal for trading. Being professional traders and system designers, we decided that the best way forward is to be as transparent as possible. This is in regards to how our trading systems are built and how they w
FREE

Multi Time Frame Dashboard A free, standalone MetaTrader 5 indicator that brings trend classification and RSI readings for the current chart symbol into one customizable panel. What the dashboard displays Four supported timeframes: M15, H1, H4 and D1. Choose which rows to display in the inputs. Five trend states: Strong Bullish, Weak Bullish, Neutral, Weak Bearish and Strong Bearish, based on price and EMA ordering under the documented rules introduced in version 1.22. Default EMA periods: 21,
FREE

ATX Chain Current — Trend-Riding Expert Advisor for BTC/USD (H4)
OVERVIEW
ATX Chain Current is a trend-riding Expert Advisor engineered for Bitcoin (BTC/USD) on the H4 timeframe. It is built around a single conviction about crypto's character: Bitcoin's returns are fat-tailed. A small number of powerful, extended moves account for a disproportionate share of the opportunity — and the costliest mistake a trend system can make is to cut those moves short. ATX Chain Current is the one EA in the
FREE

Synthetic Power Meter: Ваш навигатор по рынку за 1 секунду Synthetic Power Meter — это умный и компактный дашборд, который оценивает реальную силу валют и мгновенно выдает готовую торговую идею. Ключевые преимущества: Работает у ЛЮБОГО брокера: В отличие от аналогов, он не запрашивает цены кросс-курсов у терминала. Он математически синтезирует все 28 пар на основе 7 надежных мажоров. Никаких ошибок "Symbol not found", даже на демо-счетах с ограниченным набором инструментов. Наглядная сил
FREE

Finally a Metatrader version of the very popular (and expensive) Market Cipher B indicator, or the Vumanchu Cipher B + Divergences very popular on Tradingview platform.
This tool is very heavy on calculations, total are 31 plots using 97 buffers from several indicators. On my mid end computer, timeframes below M15 start getting a bit laggy, so it would require a powerful computer to run it properly at very low timeframes. It's still usable here, but somewhat sluggish response in Metatrader (lik
FREE

VoltyPulse v2.0 – Adaptive Volatility Band Signal System VoltyPulse combines a modified TDI core with an adaptive volatility band. The core signal (Extreme Cross) fires when the smoothed RSI price MA crosses the statistical volatility band – after a confirmed stay in the extreme zone. Signal Modes Mode 1 – All Signals: Every extreme zone crossover is output immediately. Mode 2 – Crossover: Only signals where a HistoMA/SignalMA crossover occurs simultaneously. Mode 3 – Pending: After the extreme
FREE
MetaTrader市场是一个简单方便的网站,在这里开发者可以出售自己的交易应用程序。
我们将帮助您发布您的产品,并向您解释如何为市场准备您的产品描述。市场上所有的应用程序都是加密保护并且只能在买家的电脑上运行。非法拷贝是不可能的。
