- 显示:
- 4588
- 等级:
- 已发布:
- 已更新:
-
 需要基于此代码的EA交易或指标吗?请在自由职业者服务中订购
进入自由职业者服务
需要基于此代码的EA交易或指标吗?请在自由职业者服务中订购
进入自由职业者服务
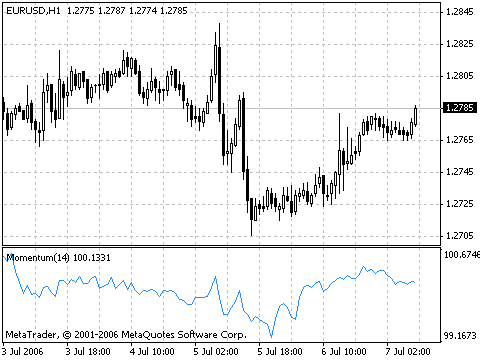
The Momentum Technical Indicator measures the amount that a security’s price has changed over a given time span. There are basically two ways to use the Momentum indicator:
-
You can use the Momentum indicator as a trend-following oscillator similar to the Moving Average Convergence/Divergence (MACD). Buy when the indicator bottoms and turns up and sell when the indicator peaks and turns down. You may want to plot a short-term moving average of the indicator to determine when it is bottoming or peaking.
If the Momentum indicator reaches extremely high or low values (relative to its historical values), you should assume a continuation of the current trend. For example, if the Momentum indicator reaches extremely high values and then turns down, you should assume prices will probably go still higher. In either case, only trade after prices confirm the signal generated by the indicator (e.g., if prices peak and turn down, wait for prices to begin to fall before selling).
-
You can also use the Momentum indicator as a leading indicator. This method assumes that market tops are typically identified by a rapid price increase (when everyone expects prices to go higher) and that market bottoms typically end with rapid price declines (when everyone wants to get out). This is often the case, but it is also a broad generalization.
As a market peaks, the Momentum indicator will climb sharply and then fall off — diverging from the continued upward or sideways movement of the price. Similarly, at a market bottom, Momentum will drop sharply and then begin to climb well ahead of prices. Both of these situations result in divergences between the indicator and prices.
Momentum is calculated as a ratio of today’s price to the price several (N) periods ago.
MOMENTUM = CLOSE(i)/CLOSE(i-N)*100
Where:
CLOSE(i) — is the closing price of the current bar;
CLOSE(i-N) — is the closing bar price N periods ago.
Technical Indicator Description
Full description of Momentum is available in the Technical analysis: Momentum
 Moving Average Convergence Divergence, MACD
Moving Average Convergence/Divergence (MACD) is the next trend-following dynamic indicator.
Ichimoku Kinko Hyo, Ishimoku
Ichimoku Kinko Hyo indicator is predefined to characterize the market trend, Support and Resistance Levels, and to generate signals of buying and selling.
Moving Averages, MA
The Moving Average Indicator shows the mean instrument price value for a certain period of time.
Moving Average of Oscillator, OsMA
Moving Average of Oscillator is the difference between the oscillator and oscillator smoothing.