
Professional-Grade Technology-Driven Trading System: China Tianji Global State Resolution System

1. This Is Not an Ordinary Signal Indicator
There are many indicators in the market.
What is truly rare is a system that can make complex market conditions easier to read.
China Tianji Global State Resolution System is not an ordinary signal indicator.
It is a professional-grade trading system powered by Chinese technology-driven algorithms.
It does not simply give a signal for an up move or a down move.
Its more important function is to show market state, price structure, and direction changes more clearly.
In any MT5 instrument and on any timeframe, market conditions are always changing.
Some lows are valid long opportunities, and some lows are not.
Some declines are only a pause before another move down.
Some declines are close to ending and may lead to a rebound.
Some upward moves can continue, and some are already close to weakening.
Many traders cannot clearly see these differences, so they often enter at the wrong place.
This is where the value of this system is.
It makes complex chart changes more direct.
It helps users identify the current state of the market more quickly and understand what the current move really means.
It is not only about showing one point on the chart.
It is about showing the key changes behind the chart more clearly.
For experienced traders, this system can improve analysis efficiency.
For beginners, it is also easier to understand and easier to use.
It turns complex market conditions into chart information that can be observed, analyzed, and judged more clearly.
2.What Can It Help You See More Clearly
The value of this system is not only in showing whether the market is rising or falling.
Its more important role is to help users see the state behind price movement.
Many people look at a chart and only see price going up and down.
But professional traders focus on a different set of questions.
Is
For a long position, you should wait until the indicator line crosses the second lower channel at least.
For a short position, you should wait until the indicator line crosses the second upper channel at least.
this level a valid low?
Is this low a good place to go long?
Is this decline only a pullback, or will it continue lower?
Is this upward move still strong, or is it already close to weakening?
These are the questions that truly affect trading judgment.
China Tianji Global State Resolution System helps users see these changes more clearly.
It helps identify whether the current level is a low worth paying attention to.
It also helps distinguish whether the market is in a sideways decline or is close to a bottom rebound.
During an upward move, it can also help judge whether the market is still moving higher or is already close to a sharp drop from the top.
The focus of this system is not only to tell you a result.
Its more important function is to help you see market state changes earlier.
When the state changes, the meaning of direction also changes.
When the structure changes, the previous judgment may no longer be valid.
If these changes are not clear, it becomes easy to make the wrong decision at the wrong place.
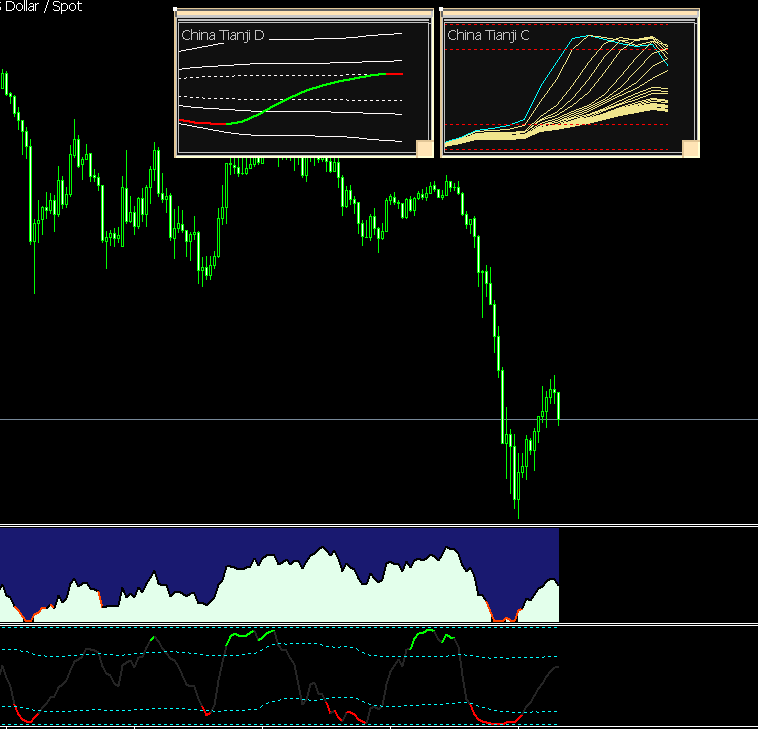
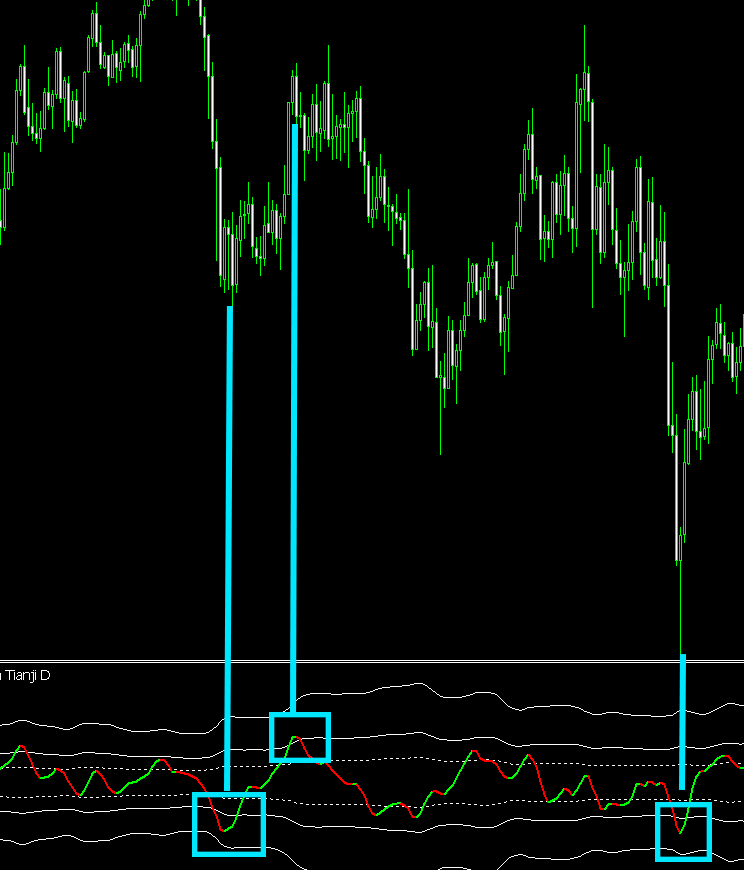
At this low area, the system provided a long reference. Later, the system gave an exit signal. After the position was closed, the market moved down again. This shows that the system can help identify low-entry opportunities and also provide clearer exit timing when the structure starts to weaken.As shown in the figure below.↓↓↓

This chart mainly shows that not every low is suitable for a long position.
The system helps users distinguish whether the current level is a low with long-entry value.
This can reduce blind entries at the wrong location.↓↓↓

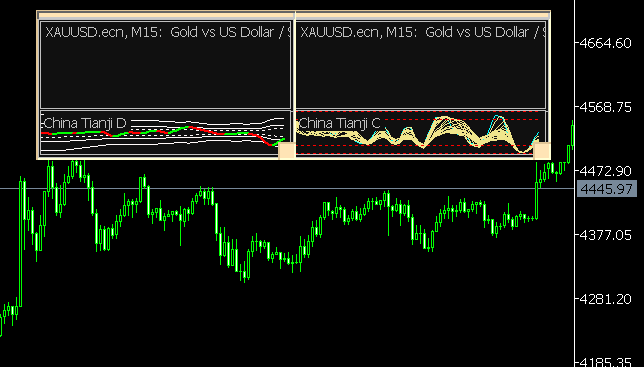
The market had already declined clearly before this.
In the middle, there was a level that looked like a possible rebound point, but the market continued to fall afterward.↓↓↓

3. Detailed Instructions for Use
3.1 What to Look at First When Using It for the First Time
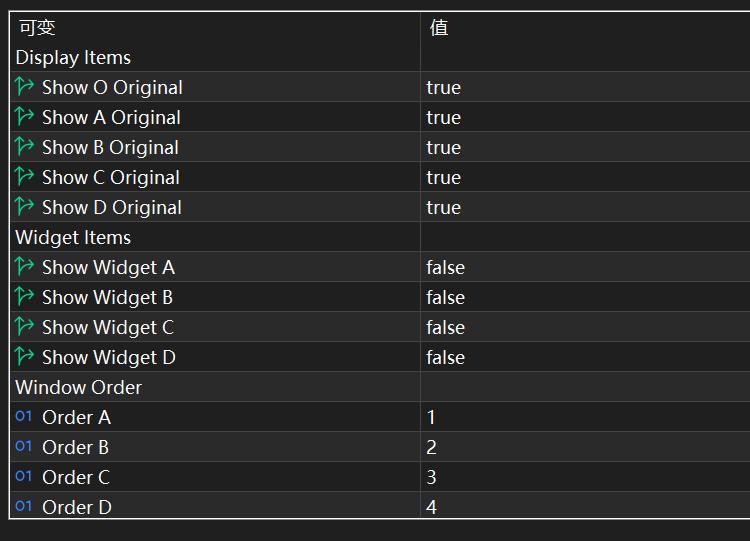
When you insert the indicator system into the chart for the first time, you will see the settings window shown above.
When I designed this indicator system, I fully considered the user's need for personalized settings.
Now I will explain it step by step.
Step 1
As shown in the figure, "Original" means the original MT5 indicator display mode.
In this mode, one indicator uses one indicator window.
You can use "true" and "false" to show or hide it.
The "Widget" items are the widget windows.
For example, if you think the four indicator windows take up too much space on the screen, you can turn off the original indicators that you have already reviewed and know how to use, and then turn on the widget windows, as shown in the figure below.
You can solve it by turning off the widget in the settings and then turning it on again several times ↓↓↓
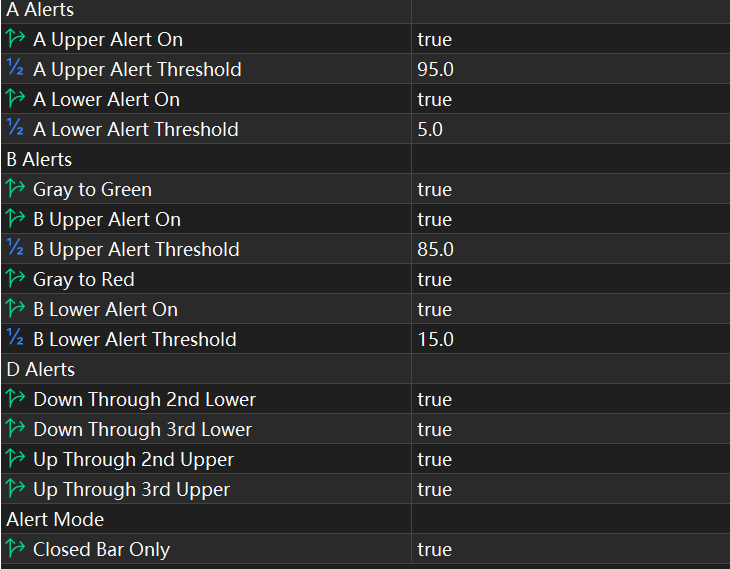
The figure below shows the alert system.
You can adjust the alert settings freely.
In most cases, the default settings are already enough ↓↓↓
3.2 How to Read Indicators A, B, C, and D
How to Use Indicator A
The condition for a bullish signal in Indicator A is that the line must turn red.
The lowest point is 0.
The lower it is, the stronger the bullish signal.
the best rebound area is when the indicator line is very close to 0.
The condition for a bearish signal is that the line must turn green.
The highest point is 100.
The higher it is, the stronger the bearish signal.
the best downward area is when the indicator line is very close to 100.↓↓↓
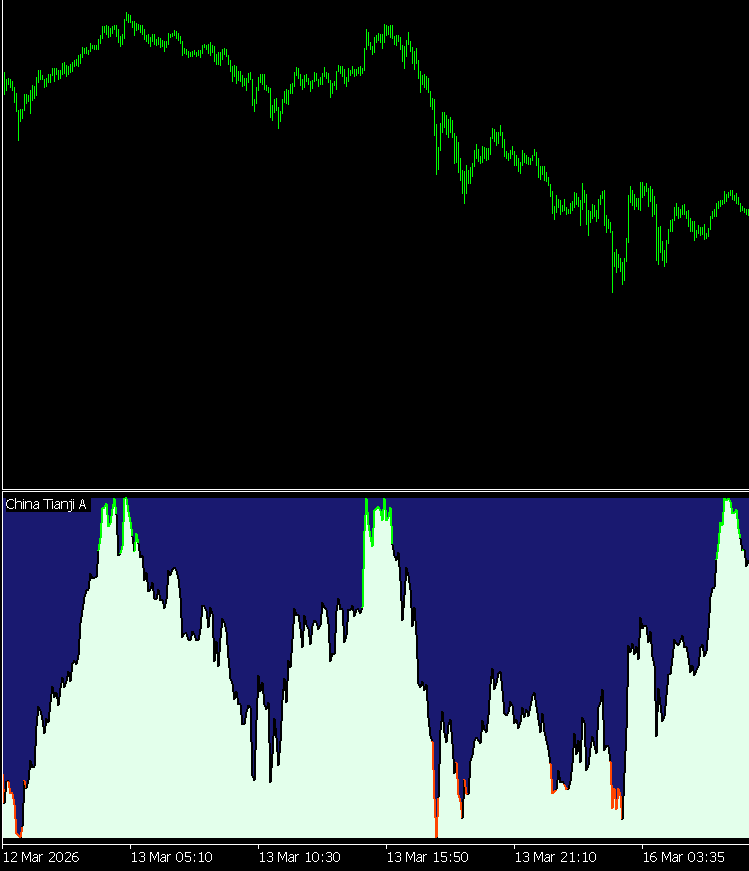
How to Use Indicator B
The condition for a bullish signal in Indicator B is that the line has crossed below the lower blue dynamic channel.
The lowest point is 0.
When using this indicator for long positions, please pay extra attention: the best rebound area is when the indicator line is very close to 0.
The condition for a bearish signal is that the line has crossed above the upper blue dynamic channel.
The highest point is 100.
When using this indicator for short positions, please pay extra attention:
the best downward area is when the indicator line is very close to 100.↓↓↓
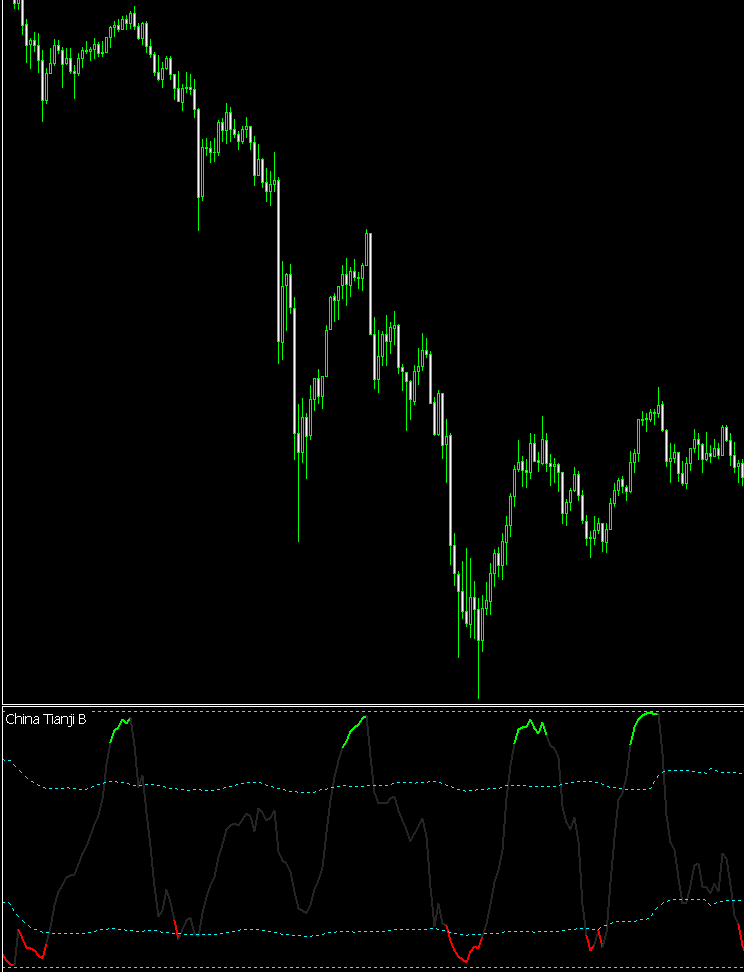
How to Use Indicator C
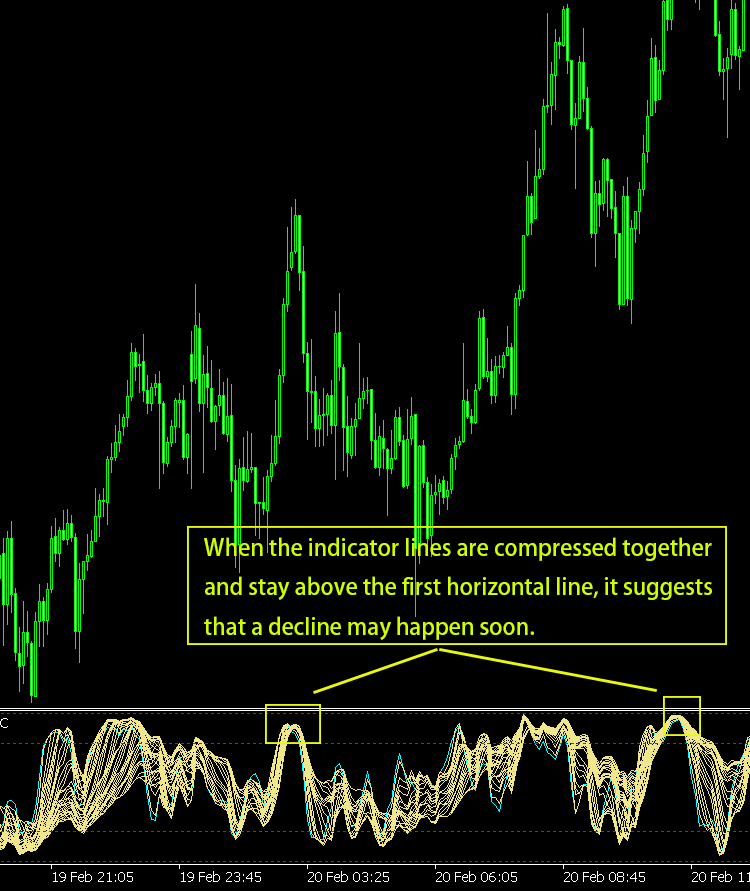
When the indicator lines are compressed together and stay below the first horizontal line,
it suggests that a rebound may happen soon. The lower the better.↓↓↓↓↓↓
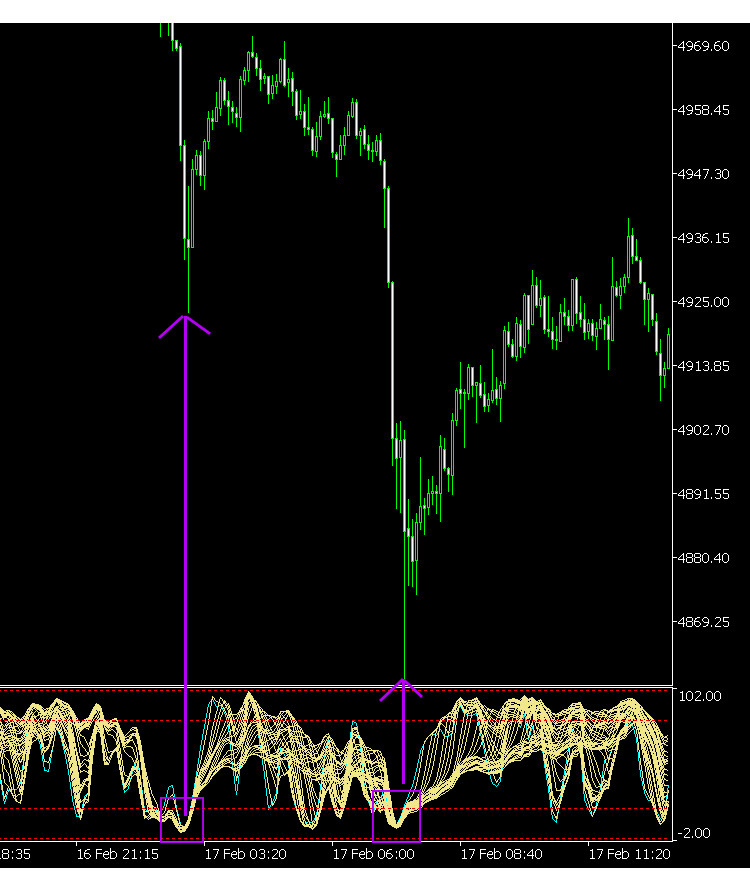
Important Note for Indicator C
When the blue line in Indicator C has already reached the first upper horizontal line or the first lower horizontal line, but the other gold lines are still very far away from the blue line, it may suggest that the current trend can continue.


How to Use Indicator D
Indicator D is used to observe the current trend momentum.
For a long position, you should wait until the indicator line crosses the second lower channel at least.
For a short position, you should wait until the indicator line crosses the second upper channel at least.↓↓↓
The content above is the most basic way to use Indicators A, B, C, and D.
You can first use these basic methods to understand each indicator.
In real trading, you can also build your own way of using them based on your trading style and your review experience after purchase.
As your understanding becomes deeper, you can also improve and upgrade your own method of use.
3.3 How to Combine Indicators A, B, C, and D
Understanding one indicator is only the first step.
The more important way to use this system is to read multiple indicators together.
This is because one indicator can only show part of the information.
When several indicators show a similar direction and state at the same level, the judgment becomes clearer.
This is the meaning of multi-indicator resonance.
So in actual use, do not look at only one indicator. Use A, B, C, and D together ↓↓↓
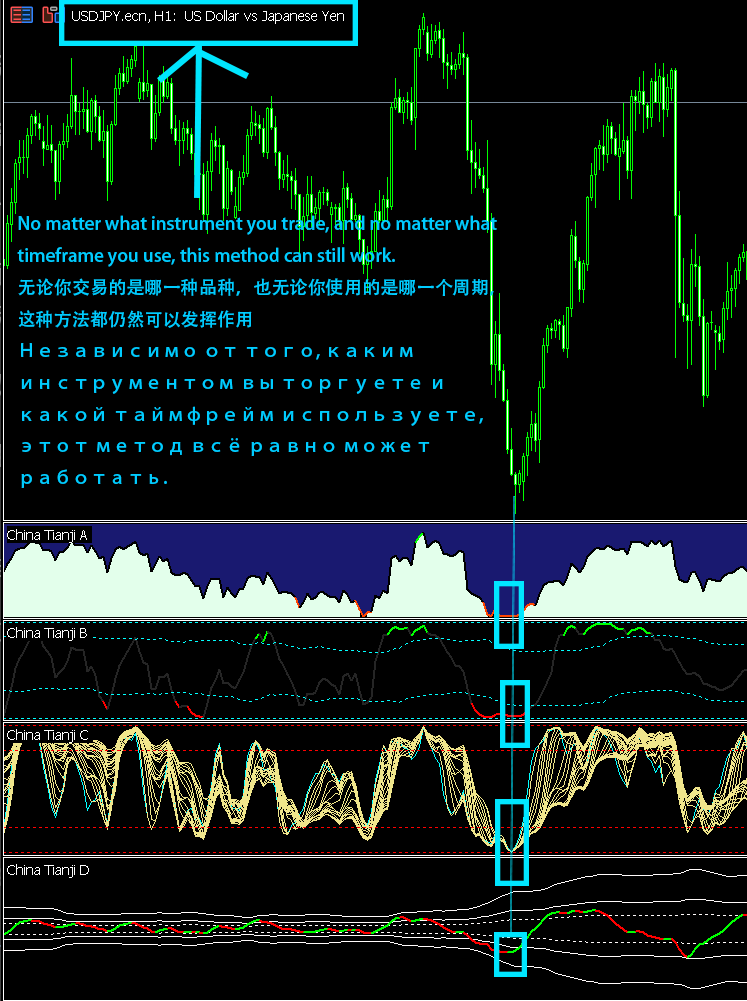
After using multiple indicators together, you can basically reach a level close to that of a professional trader.
No matter what instrument you trade, and no matter what timeframe you use, this method can still work.
But I need to emphasize one point: if your trade is based on the 5-minute indicator, then your exit is also best judged with the 5-minute indicator.
Also, the larger the timeframe is, the longer you may need to wait, and the larger the potential profit may be.
At the same time, the position risk you face may also become bigger.
4 .Important Notes for Use
When using this system, there are several important points to pay attention to.
These points are very important.
Understanding the indicators is one thing.
Using them correctly is another thing.
1. Do not look at only one indicator
This system is not made to use only A or only B.
If you look at only one indicator, you can only see part of the information.
A better way is to use A, B, C, and D together.
When several indicators show a similar direction at the same level, the reference value of that level becomes higher.
This is the real meaning of multi-indicator resonance.
2. If the indicators do not agree, it is better to wait
Sometimes one indicator already gives a long or short signal.
But the other indicators have not confirmed it yet.
In this case, do not enter too quickly.
If the indicators are not in the same state, it means the current level is still not clear enough.
At this time, waiting is usually safer.
A high-quality setup is usually not decided by only one indicator.
3. Not every price move is worth trading
The market does not give a good opportunity at every moment.
Some levels look like opportunities, but they are only short-term moves.
If the current level does not show a clear state, do not force an entry.
The value of this system is not only to find opportunities, but also to filter out low-quality positions.
Knowing how to wait is as important as knowing how to enter.
4. Do not only look at entry, also look at exit
Many people only focus on where to go long or where to go short.
But a complete way of using this system also includes exit.
When the market state starts to change, you should think about whether to keep holding the position.
If you only care about entry and not exit, your earlier judgment may be damaged by a later pullback.
So both entry and exit should be judged together with indicator state.
5. The entry timeframe and exit timeframe should better stay the same
If your trade is based on the 5-minute indicator, then your exit is also best judged with the 5-minute indicator.
This makes the judgment more consistent and clearer.
If you use a larger timeframe, the waiting time is usually longer, and the profit space may also be larger.
But at the same time, the position pressure and market fluctuation pressure may also become bigger.
So the timeframe you use should match your own trading style.
6. Do not change the settings too much before you fully understand the system
This system already provides a complete basic framework.
Before you fully understand it, do not change too many settings.
It is better to use the default settings first and get familiar with the system.
After you understand it better, you can slowly adjust it based on your own ideas.
First learn how to use it correctly, then think about personal optimization.
7. Review is very important
When you use the system for the first time, you see the indicators.
But after reviewing past charts, you will understand the indicators more clearly.
A lot of real experience does not come from the first look.
It comes from repeated review and summary.
So review is a very important part of using this system.
The deeper your understanding becomes, the more mature your method will be.
8. This system helps judgment, but it does not replace judgment
This system can help you see market state, price structure, and direction changes more clearly.
But the final trading decision still needs to be made by you.
So during use, treat it as a system that helps you understand the market, not as a machine for automatic trading.
Only when you combine the system, your understanding, and your review, can its real value be fully shown.
9. The more familiar you become with it, the stronger its advantage will be
The most basic way to use this system is not complicated.
But the longer you use it and the more you review it, the more details you will start to see.
You will become clearer about which levels are worth trading and which are not.
You will also become clearer about which moves may continue and which moves may weaken.
So this system is not a tool for only one or two uses.
It is more suitable for continuous use, continuous understanding, and continuous improvement of your trading judgment.
Hope this system can help you understand the market more clearly and build your own trading judgment step by step
Best wishes
Mingchen Guo


