|
9+ yıl
deneyim
|
128
ürünler
|
55
demo sürümleri
|
|
0
işler
|
0
sinyaller
|
0
aboneler
|
Merhaba!
Uzun yıllardır yazılım geliştirme deneyimine sahip, kendi benzersiz alım satım sistemine ve zengin EA işlem deneyimine sahip bir yazılım mühendisiyim. Ana para birimlerimiz EUR/USD, GBP/USD, USD/JPY, AUD/USD, USD/CAD, altın ve EUR/NZD çapraz kurudur.
Amacımız, erişilebilir ve kaliteli hizmet sunmak, piyasa katılımcılarına, tüccarlara ve analistlere bilinçli ve zamanında ticaret kararları alabilmeleri için ihtiyaç duydukları araçları sağlamaktır.
Artık geçmiş fiyat grafikleri yerine her bir para biriminin geleceği üzerinde Oyun Teorisi stratejisi uyguluyoruz. Bu bir üst seviyedir. Dinamik Piyasa Oyun Teorisi, başka hiçbir Para Birimi Göstergesinde bulamayacağınız Gelişmiş Para Birimi Sağlık Çubukları göstergesinin özel bir özelliğidir! Bu çok benzersiz bir fonksiyondur. Dinamik Piyasa Oyun Teorisi stratejisi Sağlık Çubukları, tüm piyasa aktivitesine (35 çiftin tümü) dayanmaktadır.
Bu EA, matematiksel algoritmam sayesinde gelecekteki kayıp oranını düzeltebilir.
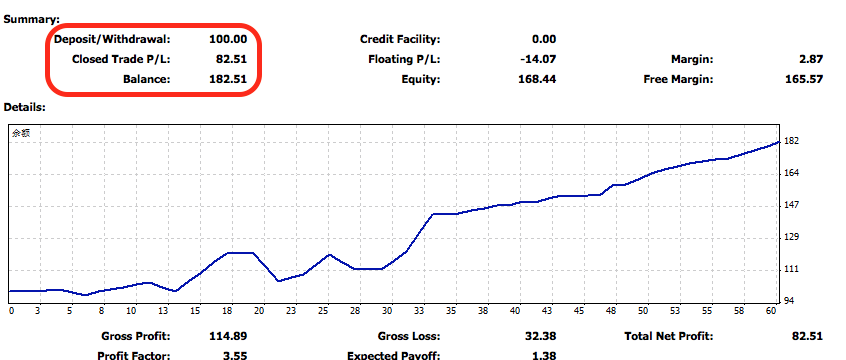
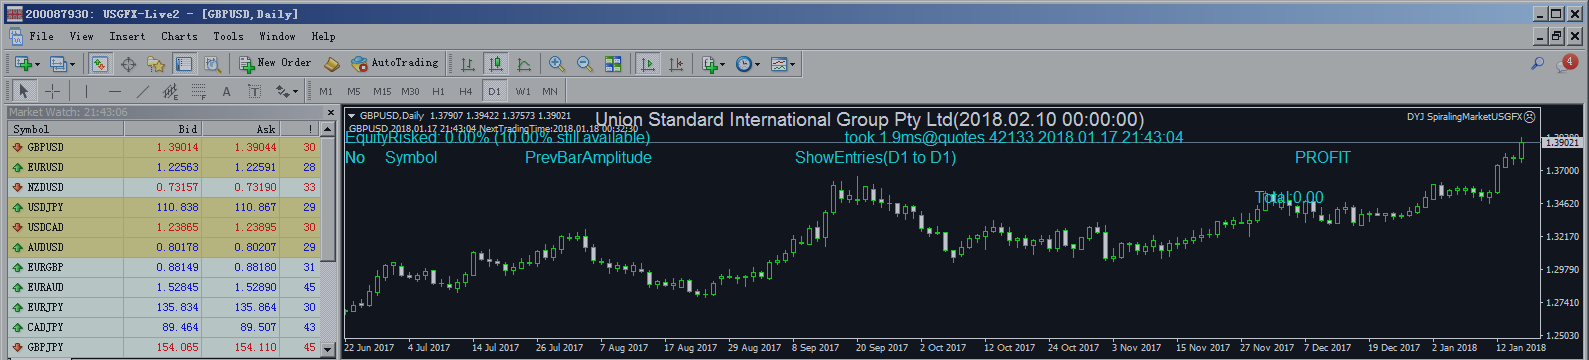
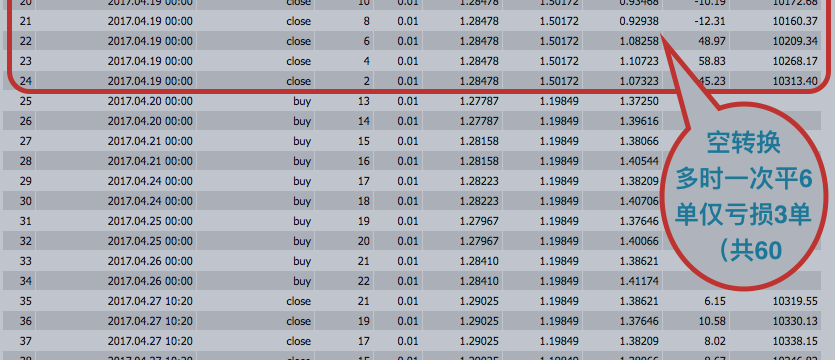
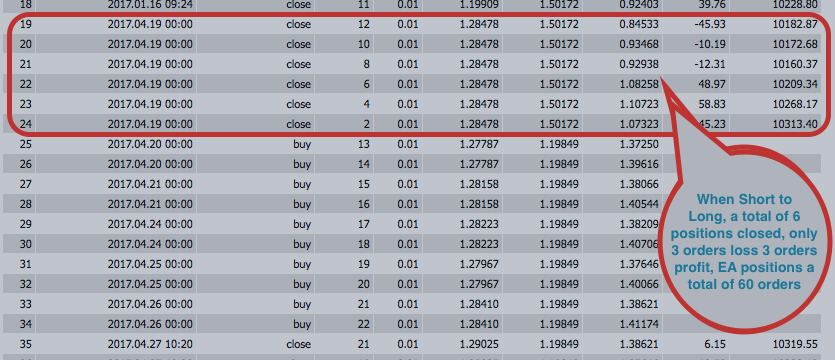
EA trendleri belirlemek için çalışır; düz veya çapraz kurdan oluşan ilk sekiz para biriminin ana ticaretini yapar, günde on veya daha fazla işlem gerçekleştirir, %20'lik en büyük geri çekilmeye sahiptir, Martingale algoritmasını kullanır, aylık %10 - %20 gelir sağlar. Herhangi bir broker işletmesi takip edebilir, kayma noktasını azaltmak için ENC hesabı kullanılması tavsiye edilir. Lütfen emin olun ki tekli işlemle birlikte alım satım sistemine aşık olacağımıza inanıyorum. Teşekkürler!
DYJ ticaret ürünleri; kendi ihtiyaçları için ticaret alanında yenilikçi çoklu para birimi yazılımı geliştirmede ve ayrıca kurumsal müşterilerin hedeflerini gerçekleştirmede uzmanlaşmıştır. DYJ unvanlı ticaret ürünleri, çoklu para birimi tabanlı tam zaman dilimi işlemleri tasarlamak içindir; M1'den MN'ye kadar tüm izlemelerle hiçbir giriş fırsatı kaçırılmaz. Tüccarların para kazanma fırsatını kaçırmaması için strateji, bu pozisyon çıkış sinyallerinin görünümünü otomatik olarak algılar, strateji her an kârınızı korur veya zararınızı minimuma indirir.
Daha fazla bilgiyi burada bulabilirsiniz: https://www.mql5.com/en/users/cdymql4/seller
Değerli kullanıcılarımız, tüm ücretli ürünlerimiz satın alma ve kiralama için mevcuttur.
DYJ Hedging ODE Beta EA: https://www.mql5.com/zh/market/product/192446?source=Site+Market+My+Products+Page
DYJ Ode Spectra EA: https://www.mql5.com/zh/market/product/185841?source=Site+Market+My+Products+Page
DYJ BetaLogicDynamicsEA: https://www.mql5.com/zh/market/product/184829?source=Site+Market+My+Products+Page
StrongCurrency MT4: https://www.mql5.com/en/market/product/23311 veya https://www.mql5.com/zh/market/product/23311
StrongCurrency MT5: https://www.mql5.com/en/market/product/24025 veya https://www.mql5.com/zh/market/product/24025
PowerSignal MT4: https://www.mql5.com/en/market/product/24448#description veya https://www.mql5.com/zh/market/product/24448#description
PowerSignal MT5: https://www.mql5.com/en/market/product/24915 veya https://www.mql5.com/zh/market/product/24915
SoarSignal MT4: https://www.mql5.com/en/market/product/22459#description veya https://www.mql5.com/en/market/product/22459#description
SoarSignal MT5: https://www.mql5.com/en/market/product/24638 veya https://www.mql5.com/zh/market/product/24638
DYJ TwoMACrossAlarm MT4: https://www.mql5.com/en/market/product/25213 veya DYJ TwoMACrossAlarm
QuickClose MT4: https://www.mql5.com/en/market/product/22425#description veya https://www.mql5.com/en/market/product/22425#description
DYJ RiseTrading MT4: https://www.mql5.com/en/market/product/25237
Uzun yıllardır yazılım geliştirme deneyimine sahip, kendi benzersiz alım satım sistemine ve zengin EA işlem deneyimine sahip bir yazılım mühendisiyim. Ana para birimlerimiz EUR/USD, GBP/USD, USD/JPY, AUD/USD, USD/CAD, altın ve EUR/NZD çapraz kurudur.
Amacımız, erişilebilir ve kaliteli hizmet sunmak, piyasa katılımcılarına, tüccarlara ve analistlere bilinçli ve zamanında ticaret kararları alabilmeleri için ihtiyaç duydukları araçları sağlamaktır.
Artık geçmiş fiyat grafikleri yerine her bir para biriminin geleceği üzerinde Oyun Teorisi stratejisi uyguluyoruz. Bu bir üst seviyedir. Dinamik Piyasa Oyun Teorisi, başka hiçbir Para Birimi Göstergesinde bulamayacağınız Gelişmiş Para Birimi Sağlık Çubukları göstergesinin özel bir özelliğidir! Bu çok benzersiz bir fonksiyondur. Dinamik Piyasa Oyun Teorisi stratejisi Sağlık Çubukları, tüm piyasa aktivitesine (35 çiftin tümü) dayanmaktadır.
Bu EA, matematiksel algoritmam sayesinde gelecekteki kayıp oranını düzeltebilir.
EA trendleri belirlemek için çalışır; düz veya çapraz kurdan oluşan ilk sekiz para biriminin ana ticaretini yapar, günde on veya daha fazla işlem gerçekleştirir, %20'lik en büyük geri çekilmeye sahiptir, Martingale algoritmasını kullanır, aylık %10 - %20 gelir sağlar. Herhangi bir broker işletmesi takip edebilir, kayma noktasını azaltmak için ENC hesabı kullanılması tavsiye edilir. Lütfen emin olun ki tekli işlemle birlikte alım satım sistemine aşık olacağımıza inanıyorum. Teşekkürler!
DYJ ticaret ürünleri; kendi ihtiyaçları için ticaret alanında yenilikçi çoklu para birimi yazılımı geliştirmede ve ayrıca kurumsal müşterilerin hedeflerini gerçekleştirmede uzmanlaşmıştır. DYJ unvanlı ticaret ürünleri, çoklu para birimi tabanlı tam zaman dilimi işlemleri tasarlamak içindir; M1'den MN'ye kadar tüm izlemelerle hiçbir giriş fırsatı kaçırılmaz. Tüccarların para kazanma fırsatını kaçırmaması için strateji, bu pozisyon çıkış sinyallerinin görünümünü otomatik olarak algılar, strateji her an kârınızı korur veya zararınızı minimuma indirir.
Daha fazla bilgiyi burada bulabilirsiniz: https://www.mql5.com/en/users/cdymql4/seller
Değerli kullanıcılarımız, tüm ücretli ürünlerimiz satın alma ve kiralama için mevcuttur.
DYJ Hedging ODE Beta EA: https://www.mql5.com/zh/market/product/192446?source=Site+Market+My+Products+Page
DYJ Ode Spectra EA: https://www.mql5.com/zh/market/product/185841?source=Site+Market+My+Products+Page
DYJ BetaLogicDynamicsEA: https://www.mql5.com/zh/market/product/184829?source=Site+Market+My+Products+Page
StrongCurrency MT4: https://www.mql5.com/en/market/product/23311 veya https://www.mql5.com/zh/market/product/23311
StrongCurrency MT5: https://www.mql5.com/en/market/product/24025 veya https://www.mql5.com/zh/market/product/24025
PowerSignal MT4: https://www.mql5.com/en/market/product/24448#description veya https://www.mql5.com/zh/market/product/24448#description
PowerSignal MT5: https://www.mql5.com/en/market/product/24915 veya https://www.mql5.com/zh/market/product/24915
SoarSignal MT4: https://www.mql5.com/en/market/product/22459#description veya https://www.mql5.com/en/market/product/22459#description
SoarSignal MT5: https://www.mql5.com/en/market/product/24638 veya https://www.mql5.com/zh/market/product/24638
DYJ TwoMACrossAlarm MT4: https://www.mql5.com/en/market/product/25213 veya DYJ TwoMACrossAlarm
QuickClose MT4: https://www.mql5.com/en/market/product/22425#description veya https://www.mql5.com/en/market/product/22425#description
DYJ RiseTrading MT4: https://www.mql5.com/en/market/product/25237