• Genel bakış
  • İncelemeler
  • Yorumlar

Joe DiNapoli

Buy and sell signals based on Joe DiNapoli's shifted 3 period exponential moving average strategy for trend reversals.

Who is he?
Joe DiNapoli is a professional trader and author that has been involved in the markets for more than 38 years. He is also a registered Commodity Trading Advisor (C.T.A.) for over 15 years and has taught his techniques in the major financial capitals of Europe, Asia, South Africa, the Middle East, Russia and in the United States.

How does the indicator work?
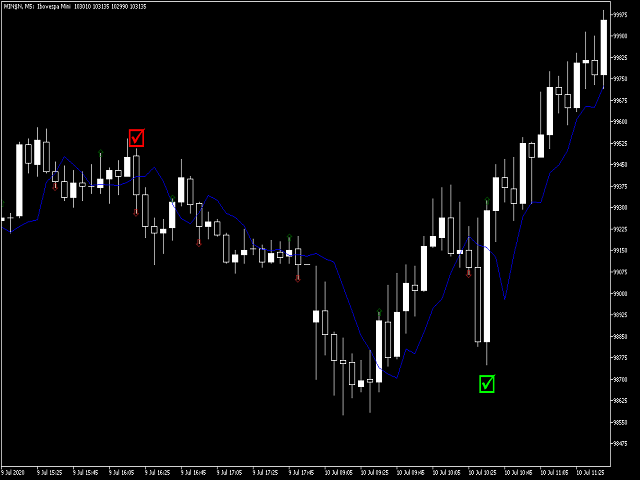
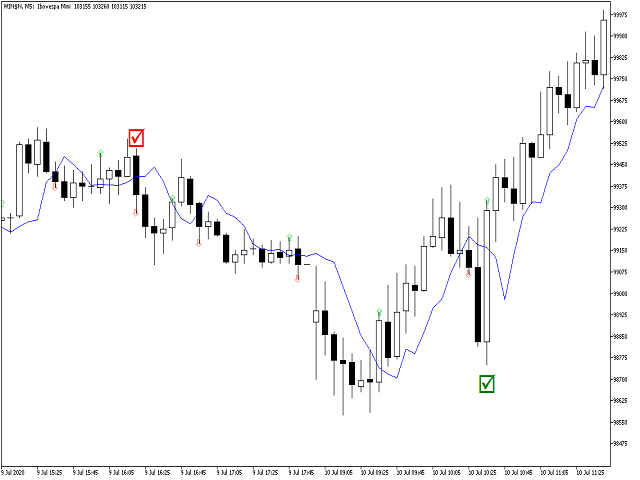
The indicator activates the buy and sell signal when their respective conditions are met, anticipating the breakout of a pivot. 
For a buy signal, first we need the price to be trending down and closing below the 3-period exponential moving average shifted by 3 periods. When the price closes above the EMA3(3) we have the first bottom. Then, we need the price to close below the EMA3(3) and then again above the EMA3(3), to form the second bottom. For the setup to be valid, the second bottom can have a lower low than the first bottom's low, but can not close below the first bottom's low.
For a sell signal, first we need the price to be trending up and closing above the 3-period exponential moving average shifted by 3 periods. When the price closes below the EMA3(3) we have the first top. Then, we need the price to close above the EMA3(3) and then again below the EMA3(3), to form the second top. For the setup to be valid, the second top can have a higher high than the first top's high, but can not close above the first top's high.

How to use it?
Enter the trade with a buy stop order one tick above the high of the candle with the buy signal, placing the stop loss order one tick below the candle's low. 
When there's a sell signal instead, place a sell stop order one tick below the low of the candle with the sell signal, and a stop loss one tick above the candle's high.
If the entry stop order is not filled on the next candle, you can cancel it and wait for another signal.
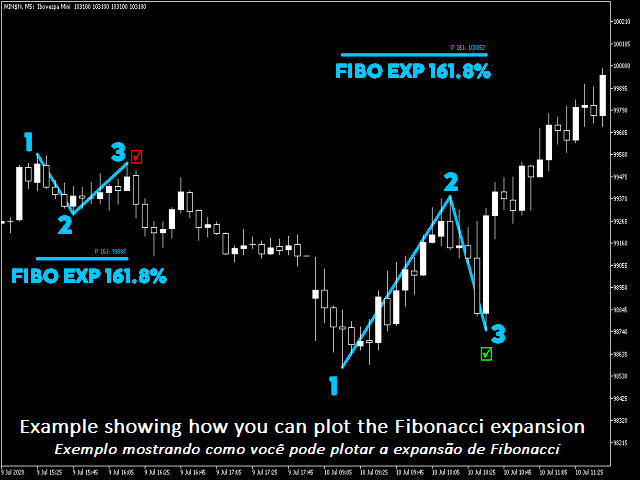
For the profit target, use the Fibonacci expansion on the first swing with the third point being the second bottom/top, aiming for the 161.8% level.

Tips:
- It is more effective in the weekly chart, but it can be used on any timeframe.
- To give more room for the trade, you can place the stop loss order on the first or second bottom for the buy signal and on the first or second top for the sell signal.
- Ideally, the second top/bottom should be slightly below/above the first one.

Features you can edit to your preference:
- Five options of distance between the arrow signals and the candle's high/low, that auto adjust itself for different symbols and timeframes.
- Trend filter: how many bars in trend with the shifted exponential moving average before the first reversal.
- Color and size of the Buy and Sell signal arrows.
- Color, thickness and style of the exponential moving average.
Önerilen ürünler
The new update makes this indicator a complete tool for studying, analyzing and operating probabilistic patterns. It includes: On-chart Multi-asset percentage monitor. Configurable martingales. Twenty-one pre-configured patterns, including Mhi patterns and C3. An advanced pattern editor to store up to 5 custom patterns. Backtest mode to test results with loss reports. Trend filter. Hit operational filter. Martingale Cycles option. Various types of strategies and alerts. Confluence between patter
TrendDetect
Pavel Gotkevitch
The Trend Detect indicator combines the features of both trend indicators and oscillators. This indicator is a convenient tool for detecting short-term market cycles and identifying overbought and oversold levels. A long position can be opened when the indicator starts leaving the oversold area and breaks the zero level from below. A short position can be opened when the indicator starts leaving the overbought area and breaks the zero level from above. An opposite signal of the indicator can
This indicator builds upon the previously posted Nadaraya-Watson smoothers. Here we have created an envelope indicator based on Kernel Smoothing with integrated alerts from crosses between the price and envelope extremities. Unlike the Nadaraya-Watson estimator, this indicator follows a contrarian methodology. Please note that by default this indicator can be subject to repainting. Users can use a non-repainting smoothing method available from the settings. The triangle labels are designed
Indicator and Expert Adviser  EA Available in the comments section of this product. Download with Indicator must have indicator installed for EA to work. Mt5 indicator alerts for bollinger band and envelope extremes occurring at the same time. Buy signal alerts occur when A bullish candle has formed below both the lower bollinger band and the lower envelope  Bar must open and close below both these indicators. Sell signal occur when A bear bar is formed above the upper bollinger band and upp
Follow The Line MT5
Oliver Gideon Amofa Appiah
4.4 (30)
This indicator obeys the popular maxim that: "THE TREND IS YOUR FRIEND" It paints a GREEN line for BUY and also paints a RED line for SELL. (you can change the colors). It gives alarms and alerts of all kinds. IT DOES NOT REPAINT and can be used for all currency pairs and timeframes. Yes, as easy and simple as that. Even a newbie can use it to make great and reliable trades. NB: For best results, get my other premium indicators for more powerful and reliable signals. Get them here: https://www.m
FREE
The Antique Trend Indicator is a revolutionary trend trading and filtering solution with all the important features of a trend tool built into one tool! The Antique Trend indicator is good for any trader, suitable for any trader both for Forex and binary options. There is no need to configure anything, everything has been perfected by time and experience, it works great during flats and trends. The Antique Trend indicator is a tool for technical analysis of financial markets, reflecting curre
GapFinder Pro - Unleashing Market Opportunities Discover and capitalize on market gaps with precision using GapFinder Pro, the ultimate MetaTrader 5 indicator designed for novice and astute traders. Unveil hidden opportunities in the market and elevate your trading strategy with this powerful tool. Key Features: Any Currency! Any Time-Frame! Gap Detection and Visualization: Identify market gaps effortlessly with a visual representation on your MetaTrader 5 chart. Instantly recognize gaps, painte
Stormer RSI 2
Ricardo Rodrigues Lucca
This strategy was learned from Stormer to be used on B3. Basically, 15 minutes before closing the market, it will check RSI and decided if it will open an position. This strategy do not define a stop loss. If the take profit reach the entry price it will close at market the position. The same happens if the maximal number of days is reached. It is created to brazilian people, so all configuration are in portuguese. Sorry Activations allowed have been set to 50.
HMA Trend Professional MT5
Pavel Zamoshnikov
4.4 (5)
Improved version of the free HMA Trend indicator (for MetaTrader 4) with statistical analysis. HMA Trend is a trend indicator based on the Hull Moving Average (HMA) with two periods. HMA with a slow period identifies the trend, while HMA with a fast period determines the short-term movements and signals in the trend direction. The main differences from the free version: Ability to predict the probability of a trend reversal using analysis of history data. Plotting statistical charts for analyz
Exclusive Bollinger MT5
Evgeny Belyaev
3.25 (4)
Exclusive Bollinger is a professional indicator based on the popular Bollinger Bands indicator and provided with an advanced algorithm. Unlike the standard Bollinger , my Exclusive Bollinger provides better signals and is equipped with flexible settings allowing traders to adjust this indicator to their trading style. In the indicator, you can set up alerts (alert, email, push), so that you won't miss a single trading signal. Exclusive Bollinger for the MetaTrader 4 terminal :  https://www.mql5.
PULLBACK HUNTER What is every trader's cherished dream? To see without delay the places where the reversal will happen. This, of course, is from the category of magic, though... nothing is impossible. But for now I've prepared for you an indicator that marks in real time the end of corrections to the current movement or in short - catches pullbacks.What is the main point? Many people practice rebounds when the price moves in the direction of the open position. And they do them on the formation o
Infinity'nin para birimlerinin gücünü ölçen bu yenilikçi gösterge, scalper'lar ve uzun vadeli ticaret yapan tüccarlar için vazgeçilmez bir yardımcıdır. Para birimlerinin Güç / zayıflık analiz sistemi uzun zamandır bilinmektedir ve dünyanın önde gelen tüccarları tarafından piyasada kullanılmaktadır. Herhangi bir arbitraj ticareti bu analiz olmadan tamamlanamaz. Göstergemiz, temel para birimlerinin birbirine göre gücünü kolayca belirler. Tüm para birimlerinde veya mevcut para birimlerinde çizgi g
KT Renko Patterns MT5
KEENBASE SOFTWARE SOLUTIONS
KT Renko Patterns scans the Renko chart brick by brick to find some famous chart patterns that are frequently used by traders across the various financial markets. Compared to the time-based charts, patterns based trading is easier and more evident on Renko charts due to their uncluttered appearance. KT Renko Patterns features multiple Renko patterns, and many of these patterns are extensively explained in the book titled Profitable Trading with Renko Charts by Prashant Shah. A 100% automate
The indicator detects divergence signals - the divergences between the price peaks and the MACD oscillator values. The signals are displayed as arrows in the additional window and are maintained by the messages in a pop-up window, e-mails and push-notifications. The conditions which formed the signal are displayed by lines on the chart and in the indicator window. The indicator parameters MacdFast - fast MACD line period MacdSlow - slow MACD line period MacdSignal - MACD signal line period Mac
Owl Smart Levels MT5
Sergey Ermolov
4.47 (36)
MT4 versiyonu  |  FAQ Owl Smart Levels Indicator , Bill Williams'ın gelişmiş fraktalları , piyasanın doğru dalga yapısını oluşturan Valable ZigZag ve kesin giriş seviyelerini gösteren Fibonacci seviyeleri gibi popüler piyasa analiz araçlarını içeren tek gösterge içinde eksiksiz bir ticaret sistemidir. pazara ve kar elde edilecek yerlere. Stratejinin ayrıntılı açıklaması Gösterge ile çalışma talimatı Baykuş Yardımcısı ticaretinde Danışman Yardımcısı Kullanıcıların özel sohbeti -> Satın aldıktan
To download MT4 version please click here . This is the exact conversion from TradingView: "WaveTrend [LazyBear]" By "zeusuk3". One of the coolest indicators out there to detect overbought and oversold zones. It can be used as a part of more complicated strategy and for confirming a potential trade setup. There are buffers to use in EAs also. The indicator is loaded light and non-repaint. - You can message in private chat for further changes you need. Thanks for downloading 
Currency RSI Scalper MT5, popüler Relative Strength Index (RSI) göstergesine dayalı profesyonel bir göstergedir. RSI göstergesi piyasanın belirli bir aralığı için iyi çalışmasına rağmen, piyasa koşulları değiştiğinde karlı sinyaller üretememekte ve dolayısıyla yanlış sinyaller üreterek büyük kayıplara neden olmaktadır. Piyasa koşullarına göre kendini uyarlayan uyarlanabilir bir RSI göstergesi hakkında hiç düşündünüz mü? Sunulan gösterge, en iyi aşırı alım ve aşırı satım seviyelerini bulan
Note : i only sell this EA on MQL5, any other sellers is fake. Orbit Rage Final, a cutting-edge trading strategy meticulously designed around the bull/bear candle approach and divergence analysis. This powerful tool is engineered to empower you to shape the life you desire. To embark on this transformative journey, simply download and seamlessly integrate it into your MetaTrader 4 platform by placing it in the experts advisors folder. Orbit Rage Final revolutionizes trading by offering a risk-f
Binary Options Assistant (BOA) CHILL Signals Indicator provides signals based on Katie Tutorials Binary Options Strategy. Indicators: 3 Moving Averages & RSI Stop missing trades, stop jumping from chart to chart looking for trade set-ups and get all the signals on 1 chart! U se any of the BOA Signals Indicator with the  Binary Options Assistant (BOA) Multi Currency Dashboard .  All BOA Signal Indicator settings are adjustable to give you more strategy combinations. The signals can be seen vi
The best time to trade Using this Indicator is when the time reach exactly hour,half,45 minutes,15 minutes and sometimes 5 minutes.. This indicators is helpful to those who trade boom and crash indecies.How to read this indicator first you'll see Blue allow and Red allow all these allows used to indicate or to detect the spike which will happen so the allow happens soon before the spike happen.This indicator works properly only in boom and crash trading thing which you have to consider when
The Riko Trend indicator is a revolutionary trend trading and filtering solution with all the important features of a trend tool built into one tool! The Riko Trend indicator is good for any trader, suitable for any trader for both forex and binary options. You don’t need to configure anything, everything is perfected by time and experience, it works great during a flat and in a trend. The Riko Trend indicator is a technical analysis tool for financial markets that reflects the current price
Düz ve trend belirleme göstergesi. Fiyat, iki histogramdan ve iki çizgiden (kırmızı ve mavi) herhangi birinin altındaysa, bu bir satış bölgesidir. Göstergenin bu sürümünü satın alırken, bir gerçek ve bir demo hesabı için MT4 sürümü - hediye olarak (almak için bana özel mesaj yazın)! Fiyat, iki histogramdan ve iki çizgiden (kırmızı ve mavi) herhangi birinin üzerindeyse, bu bir satın alma bölgesidir. MT4 versiyonu: https://www.mql5.com/en/market/product/3793 Fiyat iki satır arasında veya
Double HMA MTF for MT5
Pavel Zamoshnikov
5 (2)
This is an advanced multi-timeframe version of the popular Hull Moving Average (HMA) Features Two lines of the Hull indicator of different timeframes on the same chart. The HMA line of the higher timeframe defines the trend, and the HMA line of the current timeframe defines the short-term price movements. A graphical panel with HMA indicator data from all timeframes at the same time . If the HMA switched its direction on any timeframe, the panel displays a question or exclamation mark with a tex
About AIntel Is there are reason you select RSI 14 or 21? Is there a reason you select EMA 25? Is there a reason you pick these periods for these and any other indicators? Those numbers might have worked 10 or 20 years ago. They might be working for traiding certain currency pair in a certain timeframe.. But they DO NOT give you the best profit and outcome at all times all pairs all trades! AInter is "automated inteligence" series indicators that optimize automatically for best profit so you do
For a trader, trend is our friend. This is a trend indicator for MT5, can be used on any symbol. just load it to the terminal and you will see the current trend. green color means bullish trend and red means bearlish trend. you can also change the color by yourself when the indicator is loaded to the MT5 terminal the symbol and period is get from the terminal automaticly. How to use: I use this trend indicator on 2 terminals with different period  for the same symbol at same time. for example M5
Provided Trend is a complex signal formation indicator. As a result of the work of internal algorithms, you can see only three types of signals on your chart. The first is a buy signal, the second is a sell signal, and the third is a market exit signal. Options: CalcFlatSlow - The first parameter that controls the main function of splitting the price chart into waves. CalcFlatFast - The second parameter that controls the main function of splitting the price chart into waves. CalcFlatAvg - Par
Automatic Expert Advisor. Night scalp system, with trend detection and pullback entry. Dynamic exit signal, for SL or TP. Every trade has fix SL. No usage of risky strategies like martingale, hedge, grid etc. About EA Scalper strategy Technical strategy Can use with small deposits Pairs with best rezults: AUDNZD, AUDCAD, AUDCHF, EURAUD, GBPAUD, USDCHF, CADCHF, EURNZD, EURGBP, GBPCAD, GBPCHF, EURCHF Time Frame: M15 Recommendations Broker account with ECN and low spread Test it first to find out
This is Gekko's Cutomized Relative Strength Index (RSI), a customized version of the famous RSI indicator. Use the regular RSI and take advantage two entry signals calculations and different ways of being alerted whenever there is potential entry or exit point. Inputs Period: Period for the RSI calculation; How will the indicator calculate entry (swing) signals: 1- Produces Exit Signals for Swings based on RSI entering and leaving Upper and Lower Levels Zones; 2- Produces Entry/Exit Signals fo
This indicator uses the metaquotes ZigZag indicator as base to plot fibonacci extension and fibonacci retracement based in the Elliot waves. A fibonacci retracement will be plotted on every wave draw by the ZigZag. A fibonacci extension will be plotted only after the 2nd wave. Both fibonacci will be updated over the same wave tendency. Supporting until 9 consecutive elliot waves. Parameters: Depth: How much the algorithm will iterate to find the lowest and highest candles Deviation: Amoun
Alpha Trend MT5
Evgeny Belyaev
5 (1)
Alpha Trend MT5 is a trend indicator for the MetaTrader 5 platform; it has been developed by a group of professional traders. The Alpha Trend MT5 indicator finds the most probable tendency reversal points, which allows making trades at the very beginning of a trend. This indicator features notifications, which are generated whenever a new signal appears (alert, email, push-notification). This allows you to open a position in a timely manner. Alpha Trend does not redraw, which makes it possible t
Bu ürünün alıcıları ayrıca şunları da satın alıyor
Öncelikle, bu Ticaret Sistemi'nin Non-Repainting, Non-Redrawing ve Non-Lagging Göstergesi olduğunu vurgulamak önemlidir, bu da hem manuel hem de robot ticareti için ideal hale getirir. "Smart Trend Trading System MT5", yeni ve deneyimli tüccarlar için özelleştirilmiş kapsamlı bir ticaret çözümüdür. 10'dan fazla premium göstergeyi birleştiriyor ve 7'den fazla sağlam ticaret stratejisi sunuyor, bu da çeşitli piyasa koşulları için esnek bir seçim yapar. Trend Takip Stratejisi: Trendleri etkili bir
Atomic Analyst MT5
Issam Kassas
4.82 (11)
Öncelikle belirtmek gerekir ki bu Ticaret Göstergesi Yeniden Çizim Yapmaz, Gecikmez ve Gecikme Göstermez, bu da hem manuel hem de robot ticareti için ideal hale getirir. Atom Analisti, Piyasada Daha İyi Bir Avantaj Bulmak İçin Fiyatın Gücünü ve Momentumunu Kullanan PA Fiyat Hareketi Göstergesidir. Gürültüleri ve Yanlış Sinyalleri Kaldırmaya ve Ticaret Potansiyelini Artırmaya Yardımcı Olan Gelişmiş Filtrelerle Donatılmıştır. Birden fazla katmanlı karmaşık göstergeler kullanarak, Atom Analisti
FX Volume MT5
Daniel Stein
4.94 (17)
Sabah Brifingimiz aracılığıyla ayrıntılar ve ekran görüntüleri ile günlük piyasa güncellemenizi alın burada mql5 ve on Telegram ! FX Volume, bir brokerin bakış açısından piyasa duyarlılığı hakkında GERÇEK bir fikir veren İLK ve TEK hacim göstergesidir. COT raporlarından çok daha hızlı bir şekilde, brokerlar gibi kurumsal piyasa katılımcılarının Forex piyasasında nasıl konumlandıklarına dair harika bilgiler sağlar. Bu bilgileri doğrudan grafiğinizde görmek, ticaretiniz için gerçek oyun değiştir
Quantum Trend Sniper
Bogdan Ion Puscasu
5 (37)
Tanıtım       Kuantum Trend Keskin Nişancı Göstergesi   , trend tersine dönmeleri belirleme ve ticaret yapma şeklinizi değiştiren çığır açan MQL5 Göstergesi! 13 yılı aşkın ticaret tecrübesine sahip deneyimli tüccarlardan oluşan bir ekip tarafından geliştirilmiştir.       Kuantum Trend Keskin Nişancı Göstergesi       trend dönüşlerini son derece yüksek doğrulukla belirlemenin yenilikçi yolu ile ticaret yolculuğunuzu yeni zirvelere taşımak için tasarlanmıştır. ***Kuantum Trend Keskin Nişancı Gö
Trend Screener Pro MT5
STE S.S.COMPANY
4.89 (61)
Trend Göstergesi, Trend Alım Satım ve Filtreleme için Çığır Açan Benzersiz Çözüm, Tüm Önemli Trend Özellikleriyle Tek Bir Araç İçinde Yerleştirildi! Forex, emtialar, kripto para birimleri, endeksler ve hisse senetleri gibi tüm sembollerde/araçlarda kullanılabilen %100 yeniden boyamayan çoklu zaman çerçevesi ve Çoklu para birimi göstergesidir. Trend Screener, grafikte noktalarla ok trend sinyalleri sağlayan etkili bir trend trend göstergesidir. Trend analizörü göstergesinde bulunan özellikler: 1.
Gold Stuff mt5
Vasiliy Strukov
4.89 (166)
Gold Stuff mt5, özellikle altın için tasarlanmış bir trend göstergesidir ve herhangi bir finansal enstrümanda da kullanılabilir. Gösterge yeniden çizilmez ve gecikmez. Önerilen zaman dilimi H1. Ayarları ve kişisel bir bonusu almak için satın alma işleminden hemen sonra benimle iletişime geçin!   AYARLAR Ok Çiz - açık kapalı. grafik üzerinde oklar çizmek. Uyarılar - sesli uyarılar kapalı. E-posta bildirimi - açık kapalı. E-posta Bildirimleri. Puch bildirimi - açık kapalı. Push bildirimleri
Öncelikle, bu Ticaret Aracının Non-Repainting, Non-Redrawing ve Non-Lagging Gösterge olduğunu vurgulamakta fayda var, bu da onu profesyonel ticaret için ideal hale getiriyor. Akıllı Fiyat Hareketi Kavramları Göstergesi, hem yeni hem de deneyimli tüccarlar için çok güçlü bir araçtır. İleri ticaret fikirlerini, Inner Circle Trader Analizi ve Smart Money Concepts Ticaret Stratejileri gibi 20'den fazla kullanışlı göstergeyi bir araya getirerek bir araya getirir. Bu gösterge, büyük kurumların tica
Top indicator for MT5   providing accurate signals to enter a trade without repainting! It can be applied to any financial assets:   forex, cryptocurrencies, metals, stocks, indices .  Watch  the video  (6:22) with an example of processing only one signal that paid off the indicator! MT4 version is here It will provide pretty accurate trading signals and tell you when it's best to open a trade and close it. Most traders improve their trading results during the first trading week with the help of
FX Power MT5 NG
Daniel Stein
5 (4)
Sabah Brifingimiz burada mql5 ve on Telegram! FX Power MT5 NG , uzun zamandır çok popüler olan döviz gücü ölçerimiz FX Power'ın yeni neslidir. Peki bu yeni nesil güç ölçer ne sunuyor? Orijinal FX Power hakkında sevdiğiniz her şey PLUS GOLD/XAU güç analizi Daha da hassas hesaplama sonuçları Ayrı ayrı yapılandırılabilir analiz dönemleri Daha da iyi performans için özelleştirilebilir hesaplama limiti Özel çokluDaha fazlasını görmek isteyenler için örnek ayarlar Her grafikte en sevdiğiniz renkler i
RelicusRoad Pro MT5
Relicus LLC
4.82 (22)
Şimdi 147 $ (birkaç güncellemeden sonra 499 $ 'a yükseliyor) - Sınırsız Hesaplar (PC'ler veya Mac'ler) RelicusRoad Kullanım Kılavuzu + Eğitim Videoları + Özel Discord Grubuna Erişim + VIP Durumu PİYASAYA BAKMAK İÇİN YENİ BİR YOL RelicusRoad, forex, vadeli işlemler, kripto para birimleri, hisse senetleri ve endeksler için dünyanın en güçlü ticaret göstergesidir ve yatırımcılara kârlı kalmaları için ihtiyaç duydukları tüm bilgileri ve araçları sağlar. Başlangıç ​​seviyesinden ileri seviyey
Auto Order Block with break of structure based on ICT and Smart Money Concepts Futures Break of Structure ( BoS )             Order block ( OB )            Higher time frame Order block / Point of Interest ( POI )    shown on current chart           Fair value Gap ( FVG ) / Imbalance   ,  MTF      ( Multi Time Frame )    Volume Imbalance     ,  MTF          vIMB Gap’s Equal High / Low’s     ,  MTF             EQH / EQL Liquidity               Current Day High / Low           HOD /
XQ Indicator MetaTrader 5
Marzena Maria Szmit
5 (1)
Step into the realm of Forex trading with confidence and precision using XQ, a cutting-edge Forex indicator designed to elevate your trading game to unprecedented heights. Whether you're a seasoned trader or just stepping into the world of currency exchange, XQ Forex Indicator empowers you with the insights and signals needed to make informed trading decisions. The signal conditions are a combination of three indicators, and XQ Forex Indicator only display  medium and long-term trends . The ind
Blahtech Supply Demand MT5
Blahtech Limited
4.57 (14)
Was: $299  Now: $99   Supply Demand uses previous price action to identify potential imbalances between buyers and sellers. The key is to identify the better odds zones, not just the untouched ones. Blahtech Supply Demand indicator delivers functionality previously unavailable on any trading platform. This 4-in-1 indicator not only highlights the higher probability zones using a multi-criteria strength engine, but also combines it with multi-timeframe trend analysis, previously confirmed swings
Advanced Supply Demand MT5
Bernhard Schweigert
4.53 (15)
Herhangi bir Acemi veya Uzman Tüccar için En İyi Çözüm! Bu gösterge benzersiz, yüksek kaliteli ve uygun fiyatlı bir ticaret aracıdır çünkü bir dizi tescilli özelliği ve yeni bir formülü bir araya getirdik. Bu güncelleme ile çift zaman dilimi dilimlerini gösterebileceksiniz. Yalnızca daha yüksek bir TF gösteremeyeceksiniz, aynı zamanda TF grafiğini ve ARTIK daha yüksek TF'yi de gösterebileceksiniz: YUVARLAK BÖLGELERİ GÖSTERMEK. Tüm Arz Talebi tüccarları buna bayılacak. :) Önemli Bilgiler Açıkland
ICT, SMC, SMART MONEY CONCEPTS, SMART MONEY, Smart Money Concept, Support and Resistance, Trend Analysis, Price Action, Market Structure, Order Blocks, BOS/CHoCH,   Breaker Blocks ,  Momentum Shift,   Supply&Demand Zone/Order Blocks , Strong Imbalance,   HH/LL/HL/LH,    Fair Value Gap, FVG,  Premium  &   Discount   Zones, Fibonacci Retracement, OTE, Buy Side Liquidity, Sell Side Liquidity, BSL/SSL Taken, Equal Highs & Lows, MTF Dashboard, Multiple Time Frame, BigBar, HTF OB, HTF Market Structure
Gann Kare Göstergesi, W.D. Gann tarafından yazılan "Piyasa Tahminleri için Matematiksel Formül" makalesine dayalı güçlü bir piyasa analizi aracıdır. Bu araç, piyasa analizi için matematiksel ve Gann teorilerini kullanarak hassas analizler gerçekleştirir. 144, 90, 52 karelerini ve ayrıca 9 karesini kullanır. Ayrıca, ın 9 karesi ve bu kareyle ilişkili kanallar ve yıldız modelleri için yöntemini içerir. Kullanıcı Kılavuzu ve Uygulama: Bu göstergeleri kullanmadan önce, kullanıcı kılavuzunu okumanız
AW Trend Predictor MT5
AW Trading Software Limited
4.76 (54)
Tek bir sistemde trend ve kırılma seviyelerinin kombinasyonu. Gelişmiş bir gösterge algoritması piyasa gürültüsünü filtreler, trendi, giriş noktalarını ve olası çıkış seviyelerini belirler. Gösterge sinyalleri, sinyal geçmişinin etkinliğini gösteren en uygun enstrümanların seçilmesine izin veren bir istatistiksel modüle kaydedilir. Gösterge Kâr Al ve Zararı Durdur işaretlerini hesaplar. Kılavuz ve talimatlar ->   BURAYA   / MT4 versiyonu ->   BURAYA Gösterge ile nasıl ticaret yapılır: Trend Pre
Fiyat tersine döndükçe ve geri çekildikçe piyasa yapısından elde edilen kâr değişir. Piyasa yapısını tersine çevirme uyarısı göstergesi, bir trendin veya fiyat hareketinin ne zaman tükenmeye yaklaştığını ve tersine dönmeye hazır olduğunu tanımlar. Genellikle bir geri dönüş veya büyük bir geri çekilme meydana gelmek üzereyken meydana gelen piyasa yapısındaki değişiklikler konusunda sizi uyarır. Gösterge, olası bir tükenme noktasının yakınında her yeni yüksek veya düşük oluştuğunda, başlangıçta
The Volume by Price Indicator for MetaTrader 5 features Volume Profile and Market Profile TPO (Time Price Opportunity). Get valuable insights out of currencies, equities and commodities data. Gain an edge trading financial markets. Volume and TPO histogram bar and line charts. Volume Footprint charts. TPO letter and block marker charts including split structures. Versatile segmentation and compositing methods. Static, dynamic and flexible ranges with relative and/or absolute visualizations. Lay
Tanıtım       Quantum Breakout PRO   , Breakout Bölgeleri ile ticaret yapma şeklinizi değiştiren çığır açan MQL5 Göstergesi! 13 yılı aşkın ticaret tecrübesine sahip deneyimli tüccarlardan oluşan bir ekip tarafından geliştirilmiştir.       Kuantum Breakout PRO       yenilikçi ve dinamik koparma bölgesi stratejisiyle ticaret yolculuğunuzu yeni zirvelere taşımak için tasarlanmıştır. Kuantum Breakout Göstergesi, size 5 kar hedefi bölgesi ile kırılma bölgelerinde sinyal okları ve kırılma kutusuna
TrendLine PRO MT5
Evgenii Aksenov
4.78 (49)
The Trend Line PRO indicator is an independent trading strategy. It shows the trend change, the entry point to the transaction, as well as automatically calculates three levels of Take Profit and Stop Loss protection Trend Line PRO is perfect for all Meta Trader symbols: currencies, metals, cryptocurrencies, stocks and indices Advantages of Trend Line PRO Never redraws its signals The possibility of using it as an independent strategy It has three automatic levels Take Profit and Stop Loss lev
Gartley Hunter Multi
Siarhei Vashchylka
5 (5)
Gartley Hunter Multi - An indicator for searching for harmonic patterns simultaneously on dozens of trading instruments and on all classic timeframes: (m1, m5, m15, m30, H1, H4, D1, Wk, Mn). Manual (Be sure to read before purchasing) | Version for MT4 Advantages 1. Patterns: Gartley, Butterfly, Shark, Crab. Bat, Alternate Bat, Deep Crab, Cypher 2. Simultaneous search for patterns on dozens of trading instruments and on all classic timeframes 3. Search for patterns of all possible sizes. Fr
Trend Line Map Pro MT5
STE S.S.COMPANY
4.67 (9)
Trend Line Map indicator is an addons for   Trend Screener Indicator . It's working as a scanner for all signals generated by Trend screener ( Trend Line Signals ) . It's a Trend Line Scanner based on Trend Screener Indicator.  If you don't have Trend Screener Pro Indicator,   the Trend Line Map Pro will not work.     LIMITED TIME OFFER : Trend Line Map Indicator is available for only 50 $ and lifetime. ( Original price 125$ ) By accessing to our MQL5 Blog,  you can find all our premium indica
TrendDecoder Premium MT5
Christophe, Pa Trouillas
5 (1)
Aralıkları ve bir sonraki olası hamleleri belirleyin     |    Trendlerin en erken sinyallerini ve gücünü alın     |    Geri dönüşten önce net çıkışlar alın     |    Fiyatın test edeceği Fibo seviyelerini tespit edin   |  Gecikmesiz, takip edilmeyen gösterge - manuel ve otomatik ticaret için ideal - tüm varlıklar ve tüm zaman birimleri için uygun 50 İNDİRİM   - lansman için sonra tekrar   >>   149 $ Satın aldıktan sonra, kişiselleştirilmiş ayarlar için   bu kanaldan benimle iletişime geçin . MT4
MetaBands M5
Vahidreza Heidar Gholami
4.67 (3)
MetaBands uses powerful and unique algorithms to draw channels and detect trends so that it can provide traders with potential points for entering and exiting trades. It’s a channel indicator plus a powerful trend indicator. It includes different types of channels which can be merged to create new channels simply by using the input parameters. MetaBands uses all types of alerts to notify users about market events. Features Supports most of the channel algorithms Powerful trend detection algorith
TPSpro TRENDPRO  - is a trend indicator that automatically analyzes the market and provides information about the trend and each of its changes, as well as giving signals for entering trades without redrawing! The indicator uses each candle, analyzing them separately. referring to different impulses - up or down impulse. Exact entry points into transactions for currencies, crypto, metals, stocks, indices!  -  Version MT4                  DETAILED DESCRIPTION        /       TRADING SETUPS       
Was: $249  Now: $99   Market Profile defines a number of day types that can help the trader to determine market behaviour. A key feature is the Value Area, representing the range of price action where 70% of trading took place. Understanding the Value Area can give traders valuable insight into market direction and establish the higher odds trade. It is an excellent addition to any system you may be using. Inspired by Jim Dalton’s book “Mind Over Markets”, this indicator is designed to suit the
Grafiğinizde otomatik olarak destek ve direnç seviyeleri PLUS itici mum boşlukları çizin, böylece fiyatın nereye gidebileceğini ve / veya potansiyel olarak tersine dönebileceğini görebilirsiniz. Bu gösterge, web sitemde (The Market Structure Trader) öğretilen pozisyon ticareti metodolojisinin bir parçası olarak kullanılmak üzere tasarlanmıştır ve hedefleme ve potansiyel girişler için temel bilgileri görüntüler. MT4 Version:  https://www.mql5.com/en/market/product/97246/ Göstergede 2 TEMEL öze
Golden Spikes Detector
Batsirayi L Marango
5 (1)
Golden Spikes Detector This indicator is based on an advanced strategy primarily for trading spikes on Boom and Crash Indices. Complex algorithms were implemented to detect high probability entries only. It alerts on potential Buy and Sell entries. To trade spikes on the Deriv or Binary broker, only take Buy Boom and Sell Cash alerts. It was optimised to be loaded on 5-minute timeframe although multiple timeframe analysis is done in the background. Features ·             Desktop pop up and sound
Black Dragon indicator mt5
Ramil Minniakhmetov
4.82 (56)
Trend algılama göstergesi, herhangi bir stratejiyi tamamlayacak ve bağımsız bir araç olarak da kullanılabilir. ÖNEMLİ! Talimatlar ve bonus almak için satın alma işleminden hemen sonra benimle iletişime geçin!   Faydalar Kullanımı kolay; grafiği gereksiz bilgilerle aşırı yüklemez. Herhangi bir strateji için filtre olarak kullanma yeteneği. Hem kar elde etmek hem de zararı durdurmayı ayarlamak için kullanılabilen, yerleşik dinamik cupport ve direnç seviyeleri içerir. Mum kapandıktan sonra g
Yazarın diğer ürünleri
Trap Zone
Luigi Nunes Labigalini
4.5 (2)
This indicator serves as an alert for climax regions. How does it work? When the 20-period arithmetic moving average meets the 200-period arithmetic moving average, a conflict region forms with two major opposing forces fighting. This causes the price to show random peaks until a winner side is defined, which can be dangerous. Therefore, the indicator paints the region between the moving averages to alert you. How to use it? It can be used for specific volatility or support and resistance s
FREE
Setup DT Trap
Luigi Nunes Labigalini
Buy and sell signals based on the Day Trade Trap Strategy for failed breakouts, popularized in Brazil by Alexandre Wolwacz (STORMER). How does the indicator work? The indicator activates the buy and sell signal when their respective conditions are met.  For a buy signal, we need a bar making a low lower than the previous day low. On this moment, the signal is plotted with the secondary color. For a sell signal, we need a bar making a high higher than the previous day high. On this moment, the
Setup 91 Larry Williams
Luigi Nunes Labigalini
4.5 (2)
Buy and sell signals based on Larry Williams's exponential moving average strategy 9.1 for trend reversals. How does it work? The indicator activates the buy and sell signal when a candle closes turning the 9 period EMA. How to use it? One way of using it, proposed by Larry Williams, is to enter a trade with a buy stop order one tick above the high of the candle with the buy signal, placing the stop loss order one tick below the candle's low. When there's a sell signal instead, place a sell
Buy and sell signals based on Larry Williams's exponential moving average strategy Setup 9.2 for trend continuation. How does it work? The indicator activates the buy signal when a candle closes below the previous low while maintaining the 9 period EMA's upwards.  For a sell signal, we need a candle closing above the previous high while maintaining the 9 period EMA's downwards. How to use it? One way of using it, proposed by Larry Williams, is to enter a trade with a buy stop order one ti
Buy and sell signals based on Larry Williams's exponential moving average strategy 9.3 for trend continuation. Who is he? Larry Williams is an American stock and commodity trader, author of 11 books and creator of indicators such as the "Williams%R" and the "Ultimate Oscillator", with over 60 years of trading experience. Won the 1987 World Cup Championship of Futures Trading, turning $10,000 to over $1,100,000 in 12 months with real money. Ten years later, his daughter Michelle Williams won t
Buy and sell signals based on Larry Williams's exponential moving average strategy 9.4 for failed reversals and trend continuation. How does it work? For an uptrend, we need a candle turning the 9 period EMA down and closing below it, followed by a candle turning the 9 period EMA up and closing above it, with a low higher than the previous candle's low.  For a downtrend, we need a candle turning the 9 period EMA up and closing above it, followed by a candle turning the 9 period EMA down and
Buy and sell signals based on Larry Williams's exponential moving average strategies 9.1, 9.2, 9.3 and 9.4 for trend reversals and continuations. To understand the logic and how to trade the signals, please check: Setup 9.1:  https://www.mql5.com/pt/market/product/50986 Setup 9.2:  https://www.mql5.com/pt/market/product/52268 Setup 9.3:  https://www.mql5.com/pt/market/product/52269 Setup 9.4:  https://www.mql5.com/pt/market/product/52273 Notices:  - This indicator displays a lot of signals.
Setup PC
Luigi Nunes Labigalini
Buy and sell signals based on the Continuous Point Setup for trend continuation, popularized in Brazil by Stormer and Palex. How does it work? The indicator activates the buy signal when we have prices above the ascending 21-period Simple Moving Average (SMA21) followed by a pullback and a touch on it.  For a sell signal we need the prices below the descending SMA21 followed by a pullback and a touch on it. How to use it? One way of using it, as suggested by Stormer, is to enter the
HiLo Points
Luigi Nunes Labigalini
This Indicator is based on the high's moving average and the low's moving average for trend following and/or trailing stops. How does the indicator work? The indicator plots the uptrend dots until there is a close below the moving average of the lows. When this happens, a downtrend begins and is plotted until there is a close above the moving average of the highs. When this happens, another uptrend begins. And so it goes. How to use it? - Trend following: You can use it as buy signals when
Setup da Onda
Luigi Nunes Labigalini
Buy and sell signals based on the Wave Setup strategy for entering a trade on the pullback after a reversal. How does the indicator work? The indicator activates the buy and sell signal when their respective conditions are met.  For an uptrend, we need a reversal up on the EMA9 followed by prices above the ascending SMA21 making a pullback and a touch on it.  For a downtrend, we need a reversal down on the EMA9 followed by prices below the descending SMA21 making a pullback and a touch on it.
Setup PFR
Luigi Nunes Labigalini
Buy and sell signals based on the Reversal Closing Price Setup for trend continuation, created by Stormer. How does it work? The indicator activates the buy signal when we have a low below the 2 previous lows and a close above the previous close. For a sell signal we need a high above the 2 previous highs and a close below the previous close. How to use it? One way of using it, as suggested by Stormer, is to enter the trade with a buy stop order one tick above the high of the candle w
Setup Double 7s
Luigi Nunes Labigalini
Entry and exit signals from the Double 7's Strategy by Larry Connors in his book "Short Term Trading Strategies That Work". Larry claims this strategy predicted the market's direction over 80% of the time since 1995. Picking up the gains and being exposed in the market less than 25% of the time. Good for swing trading on Daily charts of SPY, Nasdaq, China's FXI, Brazil's EWZ and the majority of the equity ETFs and World Indices. How does it work? The indicator activates the buy signal when
Your Trend Friend
Luigi Nunes Labigalini
The trend is your friend! Look at the color of the indicator and trade on that direction. It does not  repaint. After each candle is closed, that's the color of the trend. You can focus on shorter faster trends or major trends, just test what's most suitable for the symbol and timeframe you trade. Simply change the "Length" parameter and the indicator will automatically adapt. You can also change the color, thickness and style of the lines. Download and give it a try! There are big movements
Setup IFR2
Luigi Nunes Labigalini
Entry and exit signals from the IFR2 Strategy by Larry Connors in his book "Short Term Trading Strategies That Work". Larry claims this strategy correctly predicted the shortterm direction of the S&P 500 83.6% of the time from 1995 to 2007. How does it work? The indicator activates the buy signal when the price closes above the 200-day moving average and the 2-period IFR closes below 5. The sell signal is the opposite. How to use it? Enter the trade with a market order as soon as the cand
Filtrele:
İnceleme yok
İncelemeye yanıt