MonsterDash Harmonic Indicator MT5

3

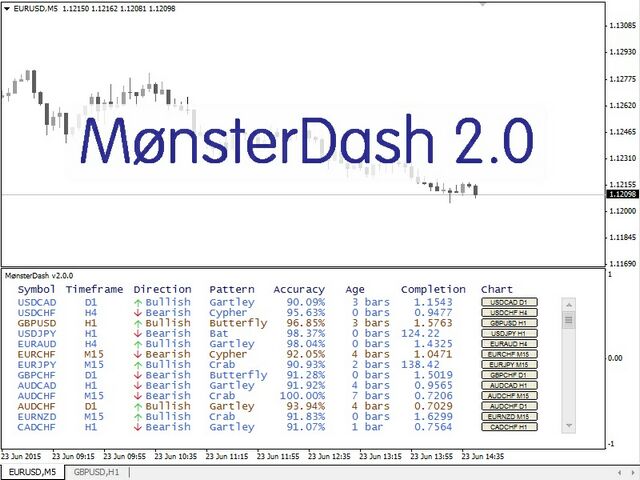
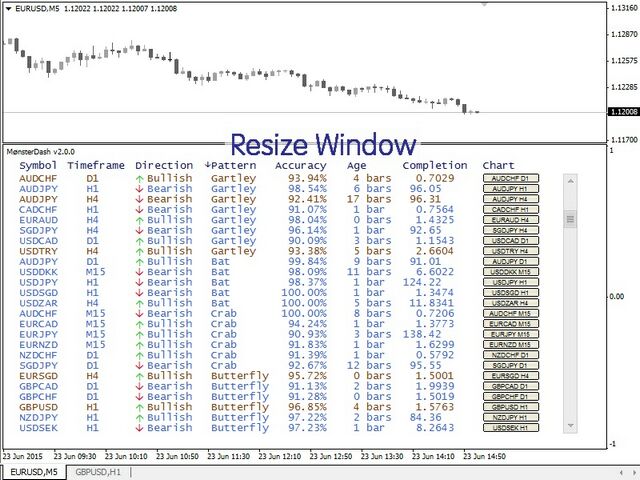
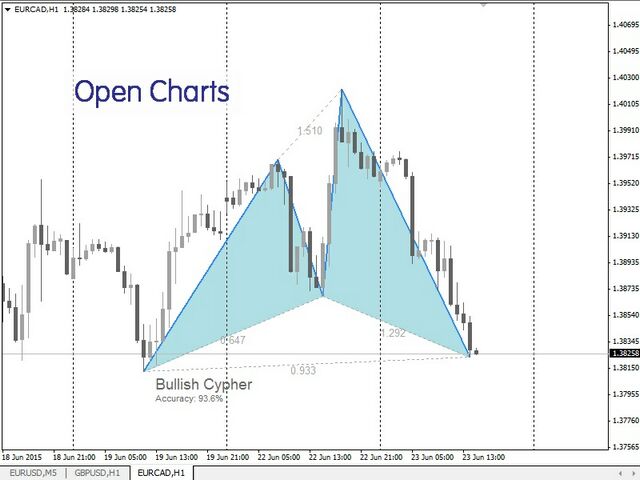
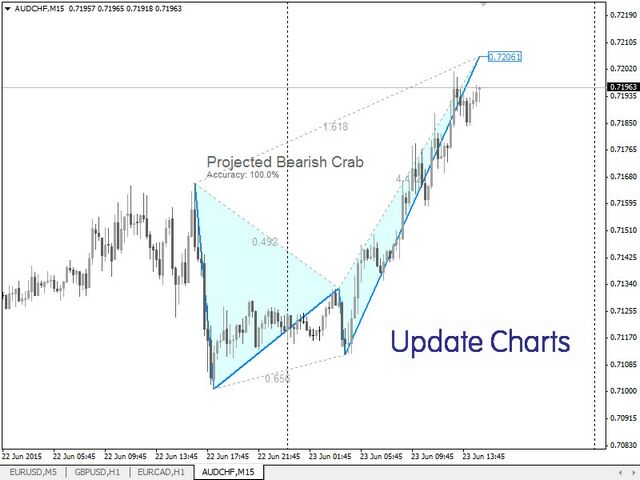
MonsterDash Harmonics Indicator is a harmonic pattern dashboard. It recognizes all major patterns. MonsterDash is a dashboard that displays all detected patterns for all symbols and (almost) all timeframes in sortable and scrollable format. Users can add their own user defined patterns. MonsterDash can open and update charts with the pattern found.


Settings

MonsterDash's default settings are good enough most of the time. Feel free to fine tune them to your needs. The color settings are for those who 'gone to the dark side' (black backgrounds), they are less suitable for white backgrounds.

  • Check pattern every - Set to the frequency to detect and refresh the patterns. This is independent of the chart timeframe.
  • Symbols to exclude - This is a comma delimited list of symbols to exclude from pattern recognition. MonsterDash looks at all symbols in the Market Watch window.
  • Minimum AccuracyPercent - Minimum accuracy percentage for pattern recognition.
  • Price Must Touch All Minimum Ratios - Set to true to force MonsterDash to touch all minimum ratios, set this if you want the price to touch all minimum ratios and provide even better patterns.
  • Show Pattern Projections - Show/hide projected patterns.
  • Check M1, M5, M15, M30, H1, H4, D1, W1, MN1 - Set to true to include the timeframe in the harmonic pattern recognition.
  • Offline timeframes, comma separated - Set to a comma separated list of all offline timeframes (e.g. 2,3). Useful for Renko of Median charts
  • Show Command Column - Set to true to show an column with a button to open a chart.
  • Chart Template - Set to the name of the template (include '.tpl') to apply to the chart to open.
  • Show Alerts - Set to false to disable all alerts.
  • Show Screen Alerts - Set to true to show screen alerts.
  • Email Alerts - Set to true to email alerts.
  • Push Alert Notifications - Set to true to push alerts.
  • Show 'PatternName' Patterns - Show/hide specific pattern.
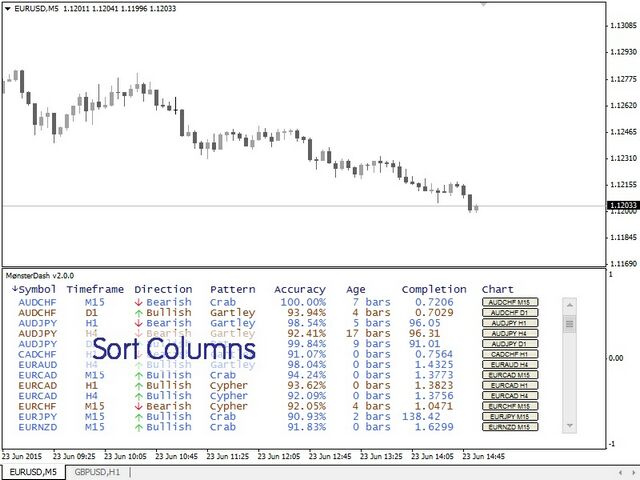
  • Sort Patterns By - Column to sort the information grid to (one of: NoSort, Pattern, Symbol, Timeframe, Direction, Accuracy, Age, Completion, IsProjected).
  • Sort Direction - Ascending of Descending.
  • monospacedFont - Pick your favorite font, monospaced is best.
  • fontSize - Font size.
  • Show Pattern Label - Set to true to show the pattern name on opened charts.
  • Show Pattern Accuracy - Set to true to show the pattern accuracy label on opened charts.
  • Show Initialization User Patterns? - set to true to show the results of the intialization of the user patterns in the Experts tab.
  • Color Palette - Pick Color Palette for 'Dark' or 'Light' Backgrounds.
  • Colo(u)rs - You know what to do.
  • Zigzag parameters - set ZigZag parameters.


User Patterns

Users can add their own patterns to MonsterDash. Just modify the Monster_UserPatterns.csv to include your patterns. The .csv file can be found in the files folder of the User Data Directory. A sample pattern is already included in the file.


Offline Charts

MonsterDash will read and detect offline charts. Renko or Median charts among others can be used this way. However, offline charts cannot be automatically opened through MonsterDash to show the pattern found, this is a limitation of MetaTrader 4.


Sorting, Scrolling, Opening Charts

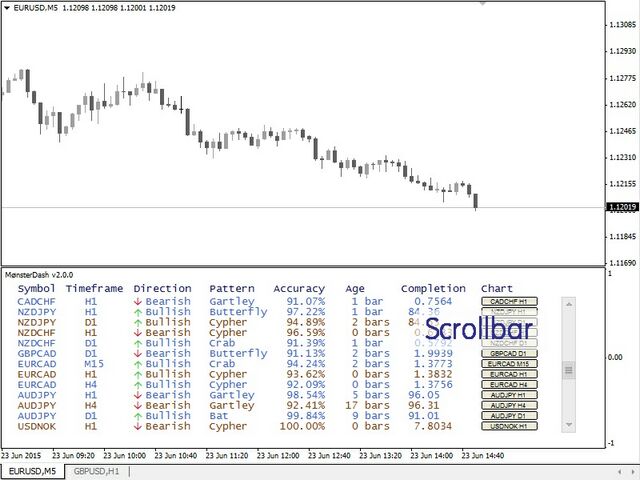
The patterns can be sorted on all columns. Click the column headers to sort the grid to the information in the column, click again to reverse the sort. The grid containing all patterns can be scrolled using a standard scrollbar. Clicking the button in the last column of the grid will open or update a chart containing the pattern found.


Full Description

Read this blog post for more information on MonsterDash.

İncelemeler 4
Corentin Yoan Brunel
141
Corentin Yoan Brunel 2020.04.24 13:56 
 

Très bon indicateur, fonctionne très bien en mettant peut de marché à scanner avec un ordinateur peut performant il ne faut pas dépasser les 15 marché à scanner.

KB70
230
KB70 2020.05.19 09:59 
 

The signals are good. The possibility to scan all symbols of the market watch is also great. I wish that the patterns could be displayed directly above the dashboard scanner and not in new chart windows and that target zones (tp1 tp2) are calculated and displayed. Can you do that?

Önerilen ürünler
Overview Harmonic Patterns MT5 is a technical analysis indicator designed for the MetaTrader 5 platform. It identifies and displays harmonic price patterns, such as Butterfly, Cypher, Crab, Bat, Shark, and Gartley, in both bullish and bearish directions. The indicator calculates key price levels, including entry, stop loss, and three take-profit levels, to assist traders in analyzing market movements. Visual elements and customizable alerts enhance usability on the chart. Features Detects six ha
Trade smarter, not harder: Empower your trading with Harmonacci Patterns This is arguably the most complete harmonic price formation auto-recognition indicator you can find for the MetaTrader Platform. It detects 19 different patterns, takes fibonacci projections as seriously as you do, displays the Potential Reversal Zone (PRZ) and finds suitable stop-loss and take-profit levels. [ Installation Guide | Update Guide | Troubleshooting | FAQ | All Products ] It detects 19 different harmonic pri
Monster Harmonics Indicator is a harmonic pattern indicator. It recognizes Gartley, Bat, Crab, Butterfly, Cypher, White Swan, Black Swan, Shark and AB=CD patterns. Projected patterns that are not yet completed are recognized, too. Monster even shows the PRZ (Potential Reversal Zone). Users can add their own user defined patterns to Monster. Besides the current pattern, Monster also shows all patterns in the symbols history. Monster will provide alerts for developing patterns. Introduced by H.M.
The indicator detects and displays М. Gartley's Butterfly pattern. The pattern is plotted by the extreme values of the ZigZag indicator (included in the resources, no need to install). After detecting the pattern, the indicator notifies of that by the pop-up window, a mobile notification and an email. The pattern and wave parameters are displayed on the screenshots. The default parameters are used for demonstration purposes only in order to increase the amount of detected patterns. Parameters z
Gartley Projections D
Oleksandr Medviediev
3 (2)
The indicator identifies the harmonic patterns (XABCD) according to developments of H.M.Gartley ( "Profits in the Stock Market" , 1935г). It projects D-point as a point in the perspective projection (specify ProjectionD_Mode = true in the settings). Does not redraw. When a bar of the working timeframe closes, if the identified pattern point has not moved during Patterns_Fractal_Bars bars, an arrow appears on the chart (in the direction of the expected price movement). From this moment on, the ar
Introduction to X3 Chart Pattern Scanner X3 Cherart Pattern Scanner is the non-repainting and non-lagging indicator detecting X3 chart patterns including Harmonic pattern, Elliott Wave pattern, X3 patterns, and Japanese Candlestick patterns. Historical patterns match with signal patterns. Hence, you can readily develop the solid trading strategy in your chart. More importantly, this superb pattern scanner can detect the optimal pattern of its kind. In addition, you can switch on and off individu
Harmonic Pattern Structure Harmonic Pattern Structure is a professional MetaTrader 5 indicator that automatically detects classic harmonic patterns using strict Fibonacci ratio validation and XABCD price structure. Designed for traders who value precision, clean visuals, and structured analysis, the indicator highlights potential reversal zones based on price geometry, supporting consistent and objective decision-making. SUPPORTED HARMONIC PATTERNS Gartley (222) Butterfly Bat Crab Shark Cy
The   Fibonacci Confluence Toolkit   is a technical analysis tool designed to help traders identify potential price reversal zones by combining key market signals and patterns. It highlights areas of interest where significant price action or reactions are anticipated, automatically applies Fibonacci retracement levels to outline potential pullback zones, and detects engulfing candle patterns. Its unique strength lies in its reliance solely on price patterns, eliminating the need for user-define
Unlock powerful breakout opportunities The 123 Pattern is one of the most popular, powerful and flexible chart patterns. The pattern is made up of three price points: a bottom, a peak or valley, and a Fibonacci retracement between 38.2% and 71.8%. A pattern is considered valid when the price breaks beyond the last peak or valley, moment at which the indicator plots an arrow, rises an alert, and the trade can be placed. [ Installation Guide | Update Guide | Troubleshooting | FAQ | All Products ]
The RSI Divergence + FVG Signal indicator combines Relative Strength Index (RSI) Divergence with Fair Value Gap (FVG) detection to generate high-probability buy and sell signals based on both momentum shifts and institutional imbalance zones. Core Features: RSI Divergence Detection : Identifies both regular and hidden bullish/bearish divergences between price and RSI. Divergences indicate potential trend reversals or continuation. FVG Zone Recognition : Detects Fair Value Gaps (imbalances caused
Candle hunter
Ruslan Khasanov
5 (1)
Grafik analiz için gösterge. Ana Japon şamdan kalıplarını grafikte işaretler. Şu anda, tüccar için aşağıdaki kalıp seti mevcuttur:  - Bearish/Bullish Abandoned Baby;  - Bearish Advance Block;  - Bearish Deliberation;  - Bearish/Bullish Belt Hold;  - Bearish/Bullish Engulfing;  - Bearish Shooting Star;  - Bearish Evening Star;  - Bearish Evening Doji Star;  - Bearish/Bullish Doji Star;    - Bearish/Bullish Tri-Star;  - Bearish Hanging Man;  - Bearish/Bullish Harami;  - Bearish/Bullish Harami Cro
ATrend
Zaha Feiz
4.82 (17)
ATREND: Nasıl Çalışır ve Nasıl Kullanılır ### Nasıl Çalışır "**ATREND**" göstergesi, MT5 platformu için tasarlanmış olup, traderlara sağlam alım ve satım sinyalleri sağlamak amacıyla teknik analiz metodolojilerinin bir kombinasyonunu kullanır. Bu gösterge, öncelikle volatilite ölçümü için Ortalama Gerçek Aralık (ATR) kullanır ve potansiyel piyasa hareketlerini belirlemek için trend tespit algoritmalarıyla birleştirir. Satın aldıktan sonra bir mesaj bırakın ve özel bir bonus hediyesi kazanın. ##
Overview The Market Perspective Structure Indicator is a comprehensive MetaTrader indicator designed to provide traders with a detailed analysis of market structure across multiple timeframes. It identifies and visualizes key price action elements, including swing highs and lows, Break of Structure (BOS), Change of Character (CHOCH), internal structures, equal highs/lows, premium/discount levels, previous levels from higher timeframes, and trading session zones. With extensive customization opt
Premium seviye, %80'den fazla doğru tahmin doğruluğuna sahip benzersiz bir göstergedir! Bu gösterge en iyi Ticaret Uzmanları tarafından iki aydan uzun süredir test edilmiştir! Yazarın göstergesini başka hiçbir yerde bulamazsınız! Ekran görüntülerinden bu aracın doğruluğunu kendiniz görebilirsiniz! 1, sona erme süresi 1 mum olan ikili opsiyon ticareti için harikadır. 2 tüm döviz çiftleri, hisse senetleri, emtialar, kripto para birimleri üzerinde çalışır Talimatlar: Kırmızı ok göründüğü an
This system is very useful for trading because it solves several classic problems: 1. Objectivity & Precision Benefit: It eliminates the trader's personal bias. Every trader might draw a trendline slightly differently, but this indicator uses a precise mathematical logic (Fractals) to find the pivot points. The resulting lines are objective and consistent every time. 2. ️ Dynamic Updates Benefit: Your chart is always current. As soon as a new pivot is confirmed, the new trendline is drawn au
Time And Sales Delta
Evgeny Shevtsov
5 (2)
The indicator displays the delta and the cumulative delta based on the "Time & Sales" deals list data. In addition to the standard timeframes, the indicator displays data regarding the seconds timeframes (S5, S10, S15, S20, S30) to choose from. Using the rectangle, user can select an arbitrary area in the indicator subwindow to view the ratio of the volumes of deals of buyers and sellers within this area. Indicator features: The indicator works correctly only on those trading symbols for which
Haven Fibonacci Volume Profiles — Otomatik Piyasa Aralığı Analistiniz Piyasa analizini bir üst seviyeye taşıyan güçlü bir araç olan Haven Fibonacci Volume Profiles ile tanışın. Bu gösterge, önemli pivot noktaları üzerine kurulu kilit fiyat aralıklarını otomatik olarak belirler ve her birinin üzerine ayrıntılı bir Hacim Profili ile Fibonacci seviyelerini yerleştirir. Bu, yatırımcıların likiditenin nerede yoğunlaştığını ve gerçek destek ve direnç seviyelerinin nerede olduğunu anında görmelerini sa
##   ONLY GOLD ##   Тiльки Золото ## **Mercaria Professional Trading Zones - Complete Guide** ## **Mercaria Professional Trading Zones - Повний посібник** ### **How Mercaria Zones Work / Як працюють зони Mercaria** **English:** Mercaria Zones is an advanced trading indicator that identifies high-probability support and resistance areas using ZigZag extremes combined with mathematical zone calculations. The indicator works on multiple timeframes simultaneously, providing a comprehensive view
Terra Infinity is a flat indicator. This improved version of the CalcFlat indicator has three additional lines that significantly increase its effectiveness. Unlike its predecessor with two static levels, Terra Infinity adds three dynamic lines above the main histogram, which are interpreted as follows: base signal line, minimum signal line, maximum signal line. These lines are formed using the additional parameter Avg, which is the average value of the histogram. Averaging produces a line cl
Volume Flow Indicator for MT5
Mohammad Taher Halimi Tabrizi
Volume Flow Indicator for MetaTrader 5 Check all of our products from the link below Our most popular indicator What are the specifications of this indicator? Platform: MetaTrader 5 (MT5) Type of Application: Custom Trading Indicator Level: Intermediate Timeframe: All Timeframes (Multi-Timeframe Support) Trading Styles: Scalping, Day Trading, Swing Trading, Position Trading Trading Markets: Forex, Stocks, Commodities, Indices, and Crypto What does this indicator do? The Volume Flow Indicator
PR EA - Engulfing Pattern Trading System Automated Engulfing Pattern Detection with MA Confirmation The PR EA is a Meta Trader 5 expert advisor that identifies and trades bullish/bearish engulfing candlestick patterns when confirmed by a moving average filter. Designed for swing trading on 30-minute charts with compatibility for M15 and H1 time frames. Key Features: Pattern Recognition - Detects valid bullish/bearish engulfing candle formations Trend Confirmation - 238-period SMA filter
Smart Stochastic Divergence Detector Description: The Smart Stochastic Divergence Detector is a professional tool that automatically identifies Bullish & Bearish Divergences on your chart using the Stochastic Oscillator . It helps traders detect early reversals , hidden momentum changes , and trend continuation signals without the need for manual analysis. Whether you trade Forex, Indices, Stocks, or Crypto , this tool provides clear divergence signals with arrows and trendlines – allowin
An Ultimate Tool  for quick and efficient market analysis. Unique combination of solid indicators defining market direction for trend tracking and filtration designed for you to stay on the   right   side of the market. Market Rider Oscillators  gives you access to one of the most used from professional trades indicators on worldwide, which were not build in for MT4 and MT5 terminals . These are unique non-repainting oscillators designed to be used on all time frames for all instruments classe
Matreshka
Dimitr Trifonov
5 (2)
Matreshka self-testing and self-optimizing indicator: 1. Is an interpretation of the Elliott Wave Analysis Theory. 2. Based on the principle of the indicator type ZigZag, and the waves are based on the principle of interpretation of the theory of DeMark. 3. Filters waves in length and height. 4. Draws up to six levels of ZigZag at the same time, tracking waves of different orders. 5. Marks Pulsed and Recoil Waves. 6. Draws arrows to open positions 7. Draws three channels. 8. Notes support and re
Gösterge, olası minimum gecikme ile   yeniden boyama yapmadan   grafikte harmonik desenleri gösterir. Gösterge üstleri arayışı, fiyat analizinin dalga ilkesine dayanmaktadır. Gelişmiş ayarlar, ticaret tarzınız için parametreler seçmenize olanak tanır. Bir mumun (çubuk) açılışında, yeni bir model oluşturulduğunda, fiyat hareketinin olası yönünün değişmeyen bir oku sabitlenir. Gösterge aşağıdaki kalıpları ve çeşitlerini tanır: ABCD, Gartley (Butterfly, Crab, Bat), 3Drives, 5-0, Batman, SHS, One2On
Noize Absorption Index - is the manual trading system that measures the difference of pressure between bears forces and bulls forces. Green line - is a noize free index that showing curent situation. Zero value of index shows totally choppy/flat market.Values above zero level shows how powerfull bullish wave is and values below zero measures bearish forces.Up arrow appears on bearish market when it's ready to reverse, dn arrow appears on weak bullish market, as a result of reverse expectation.
Elliott Wave Trend was designed for the scientific wave counting. This tool focuses to get rid of the vagueness of the classic Elliott Wave Counting using the guideline from the template and pattern approach. In doing so, firstly Elliott Wave Trend offers the template for your wave counting. Secondly, it offers Wave Structural Score to assist to identify accurate wave formation. It offers both impulse wave Structural Score and corrective wave Structure Score. Structural Score is the rating to sh
This indicator is based on the classical indicators: RSI (Relative Strangth Index) and CCI (Commodity Channel Index) and will be helpful for those who love and know how to use not a visual but digital representation of the indicators. The indicator shows values from each timeframe. You will be able to change the main input parameters for each RSI and CCI for every TF. Parameters OverboughtLevel_R = 70; OversoldLevel_R = 30; OverboughtLevel_C = 100; OversoldLevel_C = -100; Example for M1: sTF1 =
"Impulses and Corrections 5" is created to help traders navigate the market situation. The indicator shows multi-time frame upward and downward "Impulses" of price movements. These impulses are the basis for determining the "Base" , which is composed of zones of corrections of price movements, as well as "Potential" zones for possible scenarios of price movement. Up and down impulses are determined based on a modified formula of Bill Williams' "Fractals" indicator. The last impulse is always "U
This is Gekko's Cutomized Relative Strength Index (RSI), a customized version of the famous RSI indicator. Use the regular RSI and take advantage two entry signals calculations and different ways of being alerted whenever there is potential entry or exit point. Inputs Period: Period for the RSI calculation; How will the indicator calculate entry (swing) signals: 1- Produces Exit Signals for Swings based on RSI entering and leaving Upper and Lower Levels Zones; 2- Produces Entry/Exit Signals for
Bu ürünün alıcıları ayrıca şunları da satın alıyor
Market Flow Pro
Gabriele Sabatino
4 (1)
Market Flow Pro Market Flow Pro is an intelligent trading advisor for the MetaTrader 5 platform, designed for automatic trading on financial markets using algorithmic analysis and strict risk management. -Key features: - Fully automatic trading 24/5 - Adaptive trend and momentum entry algorithm -  Built-in risk management - Flexible lot settings (fixed/auto-calculation) - Support for major currency pairs and indices - Optimised for operation on various timeframes  How it works Market
ARICoins
Temirlan Kdyrkhan
ARICoin is a powerful trading companion designed to generate high-probability entry signals with dynamic TP/SL/DP levels based on volatility. Built-in performance tracking shows win/loss stats, PP1/PP2 hits, and success rates all updated live. Key Features: Buy/Sell signals with adaptive volatility bands Real-time TP/SL/DP levels based on ATR Built-in MA Filter with optional ATR/StdDev volatility Performance stats panel (Success, Profit/Loss, PP1/PP2) Alerts via popup, sound, push, or email Cust
AriX
Temirlan Kdyrkhan
1 (4)
AriX Indicator for MT5 A powerful trend-following and signal-evaluation tool AriX is a custom MT5 indicator that combines Moving Averages and ATR-based risk/reward logic to generate clear buy/sell signals. It visualizes dynamic SL/TP levels, evaluates past trade outcomes, and displays win/loss statistics in a clean on-chart panel. Key features include: Buy/Sell signals based on MA crossovers ATR-based SL/TP1/TP2/TP3 levels with visual lines and labels Signal outcome tracking with real-time stat
ARIPoint
Temirlan Kdyrkhan
ARIPoint is a powerful trading companion designed to generate high-probability entry signals with dynamic TP/SL/DP levels based on volatility. Built-in performance tracking shows win/loss stats, PP1/PP2 hits, and success rates all updated live. Key Features: Buy/Sell signals with adaptive volatility bands Real-time TP/SL/DP levels based on ATR Built-in MA Filter with optional ATR/StdDev volatility Performance stats panel (Success, Profit/Loss, PP1/PP2) Alerts via popup, sound, push, or email Cu
Azimuth Pro
Ottaviano De Cicco
5 (4)
LAUNCH PROMO Azimuth Pro price is initially set at 299$ for the first 100 buyers. Final price will be 499$ . THE DIFFERENCE BETWEEN RETAIL AND INSTITUTIONAL ENTRIES ISN'T THE INDICATOR — IT'S THE LOCATION. Most traders enter at arbitrary price levels, chasing momentum or reacting to lagging signals. Institutions wait for price to reach structured levels where supply and demand actually shift. Azimuth Pro maps these levels automatically: swing-anchored VWAP, multi-timeframe structure lines, an
RelicusRoad Pro: Kantitatif Piyasa İşletim Sistemi ÖMÜR BOYU ERİŞİMDE %70 İNDİRİM (SINIRLI SÜRE) - 2.000+ TRADER'A KATILIN Neden çoğu trader "mükemmel" indikatörlere rağmen başarısız olur? Çünkü tekil kavramları boşlukta trade ederler. Bağlamı olmayan bir sinyal kumardır. Sürekli kazanmak için KONFLÜANS (UYUM) gerekir. RelicusRoad Pro basit bir ok indikatörü değildir. Tam bir Kantitatif Piyasa Ekosistemi dir. Tescilli volatilite modellemesini kullanarak fiyatın ilerlediği "Adil Değer Yolu"nu har
Ultimate SMC Indicator
Hicham Mahmoud Almoustafa
1 (1)
Ultimate SMC PRO – Smart Money Concepts Indicator (Order Blocks, FVG, Liquidity, BOS) for MetaTrader 5 Ultimate SMC PRO is a professional trading indicator designed to visualize Smart Money Concepts directly on the chart. The indicator combines several institutional trading tools in one system to help traders identify potential high-probability trading zones. The indicator analyzes market structure, liquidity behavior and price imbalance to highlight areas where institutional activity may occu
CGE Trading Suite
Carl Gustav Johan Ekstrom
5 (1)
CGE Trading Suite delivers the analytical edge typically reserved for professional trading desks. The platform integrates a full suite of analytical tools into one seamless workflow: dynamic grid mapping, liquidity behavior analysis, ECM, trend lines, MIDAS, trade cycles, and directional channel projections. Together, these provide a unified view of market structure and momentum. Directional clarity is further enhanced by the capital flow index, which measures currency basket strength to identif
Cyclic Impulse MT5 — Bu teknik gösterge, grafiklere döngüsel fiyat hareketlerini yapılandırır ve belirler. Ters yönlü döngüsel fiyat hareketlerini ve giriş sinyallerini bulmanızı sağlar. Gösterge Nasıl Çalışır? Döngüsel bir aşağı yönlü hareket tespit edildiğinde, mum kapandıktan sonra mavi bir aşağı yönlü çubuk oluşturulur. Mevcut mumda yanıp sönebilir ve sinyal henüz onaylanmamıştır. Mavi oklar fiyat grafiğinde çoğaltılır. Yukarı yönlü bir döngüsel hareket tespit edildiğinde, mum kapandıktan s
Öncelikle, bu Ticaret Aracının Non-Repainting, Non-Redrawing ve Non-Lagging Gösterge olduğunu vurgulamakta fayda var, bu da onu profesyonel ticaret için ideal hale getiriyor. Çevrimiçi kurs, kullanıcı kılavuzu ve demo. Akıllı Fiyat Hareketi Kavramları Göstergesi, hem yeni hem de deneyimli tüccarlar için çok güçlü bir araçtır. İleri ticaret fikirlerini, Inner Circle Trader Analizi ve Smart Money Concepts Ticaret Stratejileri gibi 20'den fazla kullanışlı göstergeyi bir araya getirerek bir araya
Göstergemiz, piyasada ilgi gösterilen bölgeleri vurgular ve ardından emir birikim bölgelerini gösterir. Büyük ölçekli bir emir defteri (order book) gibi çalışır. Bu, büyük sermaye için geliştirilmiş bir göstergedir. Performansı olağanüstüdür. Piyasada ne tür bir ilgi olursa olsun, onu görürsünüz . (Bu, tamamen yeniden yazılmış ve otomatikleştirilmiş bir versiyondur – artık manuel analiz gerekmez.) İşlem Hızı (Transaction Speed) , piyasada büyük emirlerin nerede ve ne zaman biriktiğini gösteren v
" Dynamic Scalper System MT5 " göstergesi, trend dalgaları içinde işlem yapmak için scalping yöntemi için tasarlanmıştır. Başlıca döviz çiftleri ve altın üzerinde test edilmiştir, diğer işlem araçlarıyla uyumluluğu mümkündür. Ek fiyat hareketi desteğiyle trend boyunca pozisyonların kısa vadeli açılması için sinyaller sağlar. Göstergenin prensibi. Büyük oklar trend yönünü belirler. Küçük oklar şeklinde scalping için sinyaller üreten bir algoritma trend dalgaları içinde çalışır. Kırmızı oklar yü
Pointer Trend Switch — precision trend reversal indicator Pointer Trend Switch is a high-precision arrow indicator designed to detect key moments of trend reversal based on asymmetric price behavior within a selected range of bars. It identifies localized price impulses by analyzing how far price deviates from the opening level, helping traders find accurate entry points before a trend visibly shifts. This indicator is ideal for scalping, intraday strategies, and swing trading, and performs equa
Overview TriParity AfterShock PRO Scanner, MetaTrader 5 için isteğe bağlı karar destekli bir pano göstergesidir. Bu açıklamada triad, üç döviz çifti veya enstrüman arasındaki ilişki anlamına gelir. Scanner, bir panel içinde birden fazla triad ve zaman dilimini inceler ve yatırımcının izleme listesini daha yapısal bir şekilde düzenlemesine yardımcı olur. Amacı, grafik yoğunluğunu azaltmak, adayları yan yana karşılaştırmak ve daha yakından incelenmeyi hak edebilecek koşulları öne çıkarmaktır. Bu
ARIScalping
Temirlan Kdyrkhan
ARIScalp is a powerful trading companion designed to generate high-probability entry signals with dynamic TP/SL/DP levels based on volatility. Built-in performance tracking shows win/loss stats, PP1/PP2 hits, and success rates all updated live. Key Features: Buy/Sell signals with adaptive volatility bands Real-time TP/SL/DP levels based on ATR Built-in MA Filter with optional ATR/StdDev volatility Performance stats panel (Success, Profit/Loss, PP1/PP2) Alerts via popup, sound, push, or email Cus
Trend deviation scalper
Ekaterina Saltykova
1 (1)
Trend deviation scalper - is the manual system to scalp choppy market places. Indicator defines bull/bear trend and it's force. Inside exact trend system also defines "weak" places, when trend is ready to reverse. So as a rule, system plots a sell arrow when bull trend becomes weak and possibly reverses to bear trend. For buy arrow is opposite : arrow is plotted on bear weak trend. Such arrangement allows you to get a favorable price and stand up market noise. Loss arrows are closing by common p
Native Channels
BeeXXI Corporation
5 (1)
This indicator recognizes all support and resistance levels. A number of unique high-performance techniques have been applied, which made the existence of this indicator possible. All formed channels are naturally visible: horizontal linear linear parabolic cubic (Polynomial 3 degrees - Wave) This is due to a bundle of approximating channels. The formed channels form "standing waves" in a hierarchical sequence. Thus, all support and resistance levels are visible. All parameter management is i
The Institutional Secret Method  represents a paradigm shift in market analysis, moving away from lagging indicators and into the realm of Topological Finance . It is engineered to decode the hidden geometry of price movement by calculating the most efficient path—the Geodesic —between current price action and institutional liquidity targets. The system views the market as a physical landscape where price is naturally drawn toward massive pools of liquidity (Stops). It uses two primary calculati
UZFX {SSS} Scalping Smart Signals MT5, hızlı hareket eden piyasalarda doğru, gerçek zamanlı sinyaller talep eden Scalper'lar, Günlük Yatırımcılar ve Swing Yatırımcılar için tasarlanmış, Yeniden Boyama Yapmayan yüksek performanslı bir ticaret göstergesidir. (UZFX-LABS) tarafından geliştirilen bu gösterge, fiyat hareket analizi, trend onayı ve akıllı filtrelemeyi bir araya getirerek tüm döviz çiftleri ve zaman dilimlerinde yüksek olasılıklı alım ve satım sinyalleri üretir. Temel Özellikler Akıllı
TrendMaestro5
Stefano Frisetti
note: this indicator is for METATRADER4, if you want the version for METATRADER5 this is the link:  https://www.mql5.com/it/market/product/108106 TRENDMAESTRO ver 2.5 TRENDMAESTRO recognizes a new TREND from the start, he never makes mistakes. The certainty of identifying a new TREND is priceless. DESCRIPTION TRENDMAESTRO identifies a new TREND in the bud, this indicator examines the volatility, volumes and momentum to identify the moment in which there is an explosion of one or more of these da
Scalping Winning Signals Pro SWS
Muhammad Usman Siddique
5 (1)
UZFX SWS {Scalping Winning Signals} Pro v1.0, Usman Zabir (UZFX LABS) tarafından hızlı hareket eden piyasalarda kesin giriş sinyalleri arayan scalperlar, günlük tüccarlar ve swing tüccarlar için özel olarak geliştirilmiş, güçlü, yeniden boyama yapmayan bir göstergedir. Gecikme veya yanlış yeniden boyama olmadan güvenilir, gerçek zamanlı sinyaller isteyen tüccarlar için idealdir. ÖNERDİĞİM* EN İYİ ZAMAN ARALIKLARI: 30 DAKİKA VE ÜZERİ. {1 SAAT} BENİM FAVORİM. VE SONUÇLAR AKIL ALMAZ...! Temel Öze
Weis Wave with Alert MT5
Trade The Volume Waves Single Member P.C.
4.94 (17)
Rental/Lifetime Package Options and Privileges  Rent Monthly Six Months   Yearly/Lifetime Weis Wave with Speed with Alert+Speed Index x x x Manual  x x x Quick Set up Video x x x Blog x x x Lifetime Updates x x x Setup and Training Material x x Discord Access Channel "The SI traders"          x Rectangle Break Alert Tool      x How to trade with it:    http://www.tradethevolumewaves.com   ** If you purchase please contact me to setup your  : Training Room and  complete manual access.  Wei
1. Tool Description The   Dynamic Liquidity HeatMap Profile   is an advanced technical indicator originally designed by BigBeluga (Pine Script) and ported to MQL5. Unlike a standard Volume Profile which shows where volume   has   occurred, this tool attempts to visualize where liquidity (limit orders and stop losses) is   likely waiting   (resting liquidity). It works by identifying pivots (local highs and lows) weighted by volume and ATR.   Crucially, if price moves through a level, that liquid
MetaForecast M5
Vahidreza Heidar Gholami
5 (3)
MetaForecast, fiyat verilerindeki harmonileri kullanarak herhangi bir piyasanın geleceğini tahmin eder ve görselleştirir. Piyasa her zaman tahmin edilemezken, fiyatlarda bir desen varsa, MetaForecast geleceği mümkün olduğunca doğru bir şekilde tahmin edebilir. Benzer ürünlere göre, MetaForecast piyasa eğilimlerini analiz ederek daha kesin sonuçlar üretebilir. Giriş Parametreleri Past size (Geçmiş boyut) MetaForecast'ın gelecekteki tahminler oluşturmak için kullandığı çubuk sayısını belirtir. Mo
Rtc ML Ai Predictor
Muhammad Faisal Sagala
Rtc ML Ai | Predictor CORE MACHINE LEARNING ENGINE Adaptive ML Market Predictor – Multi-Bar Trend & Candle Forecast What This Indicator Does This indicator is a  real-time market prediction engine  designed to analyze price behavior and estimate  future market tendencies . Unlike conventional indicators, this system  does not rely on static parameters or historical curve-fitting , but adapts its internal state dynamically during live market operation. Instead of using static rules, the indic
Jita Indicator Pro MT5 | All Timeframes Professional Trend Agreement System – Premium Edition ($500) What Is Jita Indicator Pro? Jita Indicator Pro is a structured trend-confirmation system designed for serious traders who value precision, alignment, and controlled signal behavior. It combines: Advanced band-based trend direction logic ATR-driven structural trigger engine Dual-confirmation agreement system Locked history update design This indicator prints signals only when multiple conditions
ÜCRETSİZ AUX Göstergesini, EA desteğini ve tam kılavuzu alın, lütfen ziyaret edin – https://www.mql5.com/en/blogs/post/763955 Trend'i Belirle. Deseni Oku. Girişi Zamanla. 30 Saniyede 3 Adım! Kolayca işlem yapın — analiz gerektirmez, Akıllı yardımcınız iş akışınızı basitleştirmeye hazır Artık grafik yüklemesi yok. Akıllı yönelim tespiti ile güvenle işlem yapın. Tüm para birimleri, kripto, hisse senetleri, metaller, endeksler ve herhangi bir zaman dilimi ile uyumludur. Sadece tıklayın ve yürütün
Recommended TimeFrame >= H1. 100% Non Repainted at any moment.  Use it carefully, only with Trend Direction. Trading Usage: 2 Variants: as Range System or as BreakOut System (Both Only With Trend Direction)::: (Always use StopLoss for minimise Risk); [1] as Range System: (Recommended) in UP TREND:  - BUY in Blue Line , then if price goes down by 50 points (on H1) open Second BUY.   Close in any Profit you wish: TrailingStop(45 points) or Close when Price touches upper Gold Line. in DOWN TREND
Step into the world of Forex trading with confidence, clarity, and precision using Gold Indicator a next-generation tool engineered to take your trading performance to the next level. Whether you’re a seasoned professional or just beginning your journey in the currency markets, Gold Indicator equips you with powerful insights and help you trade smarter, not harder. Built on the proven synergy of three advanced indicators, Gold Indicator focuses exclusively on medium and long-term trends elimina
MT4 / MT5 için Astronomi Göstergesini Tanıtıyoruz: En İleri Göksel Ticaret Arkadaşınız Ticaret deneyiminizi göksel seviyelere yükseltmeye hazır mısınız? MT4 için devrim niteliğindeki Astronomi Göstergemizi arayın. Bu yenilikçi araç karmaşık algoritmaları kullanarak eşsiz astronomik içgörüler ve hassas hesaplamalar sunmak için geleneksel ticaret göstergelerini aşmaktadır. Bilgi Evreni Parmaklarınızın Ucunda:   Göksel verilerin hazinelerini açığa çıkaran kapsamlı bir paneli gözlemleyin. Gezegenl
Yazarın diğer ürünleri
TMA Currency Meter
Paul Geirnaerdt
4.14 (7)
TMA Currency Meter is the ultimate currency meter. Based on the Triangular Moving Average of all available symbols, this indicator shows which currencies are strong, strengthening, weak or weakening. Experienced as well as novice traders will see the strong and weak currencies in the blink of an eye, and know which trade possibilities to explore further. TMA Currency Meter is a true Multi Timeframe indicator. It is easy to show the currency strengths for a higher timeframe than the chart timefra
Monster Harmonics Indicator is a harmonic pattern indicator. It recognizes Gartley, Bat, Crab, Butterfly, Cypher, White Swan, Black Swan, Shark and AB=CD patterns. Projected patterns that are not yet completed are recognized, too. Monster even shows the PRZ (Potential Reversal Zone). Users can add their own user defined patterns to Monster. Besides the current pattern, Monster also shows all patterns in the symbols history. Monster will provide alerts for developing patterns. Introduced by H.M.
Monster Harmonic Indicator
Paul Geirnaerdt
4.59 (29)
Monster Harmonics Indicator is a harmonic pattern indicator. It recognizes Gartley, Bat, Crab, Butterfly, Cypher, White Swan, Black Swan, Shark and several other patterns. Projected patterns that are not yet completed are recognized, too. Monster even shows the PRZ (Potential Reversal Zone). Users can add their own user defined patterns to Monster. Besides the current pattern, Monster also shows all patterns in the symbols history. Monster will provide alerts for developing patterns. Introduced
MonsterDash Harmonic Indicator is a harmonic pattern dashboard. It recognizes all major patterns. MonsterDash is a dashboard that displays all detected patterns for all symbols and (almost) all timeframes in sortable and scrollable format. Users can add their own user defined patterns . MonsterDash can open and update charts with the pattern found. Settings MonsterDash's default settings are good enough most of the time. Feel free to fine tune them to your needs. The color settings are for thos
Riskscope
Paul Geirnaerdt
Riskscope shows all relevant information about your trades on screen. Information on Stop Loss and Take Profit can be shown as price, pips or exposure. Besides, Riskscope can display a high- and low-watermark of the total of your basket of trades. Settings Riskscope's default settings are good enough most of the time. Nearly all of them are fairly standard. Here are the ones that need some explanation. Monospaced font - set this to the (name of) the font you want to use. A monospaced font looks
Pivots
Paul Geirnaerdt
Pivots is an indicator to show pivots for relevant time frames. Besides the pivots the indicator can also show daly open line, the resistance and support levels, the ADR Fibonacci levels and the order of the pivots. Pivots includes an intelligent algorithm to eliminate Sunday candles, but only if your broker provides those. Pivots are significant price levels that may serve as support, resistance or breakout levels Settings textFont - font to use for the labels. textSize - font size. textColor -
Inside Bars
Paul Geirnaerdt
The Inside Bars indicator shows Inside Bars, the Breakout Zone and Breakouts thereof. Inside Bars are an important price action pattern. The price action of an Inside Bar is completely covered by the price action of the previous bar. Inside Bars are most often used on higher timeframes. Settings Inside Bars default settings are good enough most of the time. Feel free to fine tune them to your needs. ATR factor to skip large candles - very large candles should be filtered as they often cover othe
Candle Patterns
Paul Geirnaerdt
5 (2)
The Candle Patterns indicator shows popular candle patterns on the chart. The possible patterns are Inside Bar, Large Wick, Engulfing, Marubozu, Hammer, Shooting Star, Three White Soldiers and Three Black Crows. Candles are colored to easily identify the patterns. Also, a point and click function displays the pattern found. Settings Message box - when a candle is clicked, the pattern identified will be shown in a Message Box on the charts. All 'Message Box' settings pertain to the box. Show Ins
Better Support & Resistance shows the best support and resistance lines and zones. It is based on Fractals with the factor of your choice. All fractals are assembled, weighted, extended and merged into a clear set of support and resistance lines. The immediate nearby lines are shown as zones when price is in that zone. Better Support & Resistance gives you the best overview of the important price levels. Settings Better Support & Resistance's default settings are good enough most of the time. N
The Engulfing Bars indicator shows Engulfing Bars, the signal and the suggested stoploss and take profit. Engulfing Bars are an important price action pattern. The price action of an Engulfing Bar completely covers the price action of the previous bar. Engulfing Bars are most often used on higher timeframes. Settings Engulfing Bars default settings are good enough most of the time. Feel free to fine tune them to your needs. Show Engulfing Bars - Set to true to show Engulfing Bars. Body size per
Flying Volume
Paul Geirnaerdt
1 (1)
The Flying Volume indicator is a specialized volume indicator. It deciphers the volume data after heavy proprietary number crunching. When a main signal is found Flying Volume will look for possible continuation points. The main signal is shown by arrows, the continuation points by dots. Volume indicators are most often used on higher timeframes. Features Main Buy or Sell signals Continuation signals No repainting One signal per bar Settings Flying Volume default settings are good enough most
Fractalicious shows Fractals of any length, higher or lower highs and lower of higher lows, the fractal channel and the breakout of the channel. Fractals are an important trend and price action pattern. Fractalicious can be used on any timeframe and symbol. Settings Fractalicious default settings are good enough most of the time. Feel free to fine tune them to your needs. Show last fractal - Set to true to show fractals from the last completed bar. (This could move the fractal if the current ba
Breakout Hero
Paul Geirnaerdt
2.64 (11)
Breakout Hero is a Multi Symbol , Auto Timeframe , Breakout Expert Advisor . It recognizes breakout patterns and will set pending trades. When triggered Breakout Hero will monitor trades and adjust the stop loss. Breakout Hero is a multi symbol EA, it will trade EURUSD, GBPUSD, USDJPY and USDCAD. Also, Breakout Hero is auto timeframe. Just drop Breakout Hero on any chart and start trading. Only one chart is needed, Breakout Hero will trade the symbols you pick from the settings. You can monitor
Dark Rider
Paul Geirnaerdt
1 (2)
Dark Rider  is a Night Scalper Expert Advisor . It recognizes overbought and oversold conditions in the hours after close of the New York Exchange and trades accordingly. Dark Rider features an on screen monitor and settings panel on which you can monitor your status and progress.  A signal for Dark Rider can be found here . New in version 1.5 The option 'Stay in trending trades' is new for version 1.5. It will keep you in trending trades. Profitability has been increased while drawdown has bee
Divergence Dash
Paul Geirnaerdt
3 (2)
Diverence Dash is a MACD, RSI, OBV, Momentum, Stochastic or Standard Deviaviation Divergence Dashboard. It will scan all symbols and timeframes you want. Also, Divergence Dash can open charts with the divergence found using the template of your choice. Divergences are often used as a leading indicator and, by using Divergence Dash, are easy to spot. The risk/reward ratio in divergence trading is very low. What can Divergence Dash for you: Find MACD, RSI, OBV, Momentum, Stochastic or Standard Dev
Fusion Trader
Paul Geirnaerdt
5 (1)
NEWS Price increased to $249 from $149 on September 16th. Buy Fusion Trader v2 and get Donchian Trader for free. (limited to 3 account numbers) Fusion Trader v2  is a  Multi Symbol ,  Auto Timeframe ,  Expert Advisor . It features several strategies for different symbols and timeframes. Fusion Trader will monitor trades and adjust the stop loss. Fusion Trader v2  is a complete rewrite from v1, it trades different and more symbols. With default settings Fusion Trader has gained 5% monthly on ave
Donchian Trader is a   Multi Index ,   Auto Timeframe ,   Expert Advisor . It features a Donchian Channel strategy for different indices on the daily timeframe. Donchian Trader will monitor trades and adjust to market conditions. Donchian Trader is a multi index EA, For now, it will trade the Dow Jones (US30), S&P 500 (US500) and DAX (GER30). Also, Donchian Trader is auto timeframe. Just drop the EA on any chart and start trading. Only one chart is needed, Donchian Trader will trade the indices
NEWS Price v4 now $799 for a limited period. Fusion Trader v4  is a  Multi Symbol ,  Auto Timeframe ,  Expert Advisor . It features several strategies for different symbols and timeframes. Fusion Trader will monitor trades and adjust the stop loss. Fusion Trader v4  is a partial rewrite from v3, it trades differently and more symbols. The Scalping system now uses market orders instead of stop orders. It is 100% Metatrader 5 compatible. Fusion Trader v4 is a multi symbol EA, For now, it will tra
TMA Currency Meter is the ultimate currency meter. Based on the Triangular Moving Average of all available symbols, this indicator shows which currencies are strong, strengthening, weak or weakening. Experienced as well as novice traders will see the strong and weak currencies in the blink of an eye, and know which trade possibilities to explore further. TMA Currency Meter is a true Multi Timeframe indicator. It is easy to show the currency strengths for a higher timeframe than the chart timefra
Momentum Horizon is a fully automated trading system built for MetaTrader 5, designed to capture high-probability breakout moves in the Gold market. It focuses on two of the most time-tested price action patterns: the daily breakout of yesterday’s high/low, and the powerful 'London session' breakout, where volatility often surges as global markets overlap. By combining these setups, the system seeks to position itself right where momentum is most likely to accelerate. The EA can operate with pre
Filtrele:
KB70
230
KB70 2020.05.19 09:59 
 

The signals are good. The possibility to scan all symbols of the market watch is also great. I wish that the patterns could be displayed directly above the dashboard scanner and not in new chart windows and that target zones (tp1 tp2) are calculated and displayed. Can you do that?

Corentin Yoan Brunel
141
Corentin Yoan Brunel 2020.04.24 13:56 
 

Très bon indicateur, fonctionne très bien en mettant peut de marché à scanner avec un ordinateur peut performant il ne faut pas dépasser les 15 marché à scanner.

nirikis
256
nirikis 2018.08.15 22:59 
 

Need to be optimized. Very good indicator, but very slow. I don't understand how it refreshing. Buttons do not always work. Very sad that I can not use MT4 with my broker. It seems that MT4 version is much better.

I will give 5 stars after optimization.

Elliottino
26
Elliottino 2018.06.15 17:32 
 

Kullanıcı incelemeye herhangi bir yorum bırakmadı

İncelemeye yanıt