Alternative Chart Engine
- Göstergeler
- Sürüm: 6.35
- Güncellendi: 18 Kasım 2026
- Etkinleştirmeler: 5

OVERVIEW
Alernative Chart Engine is a chart-building indicator that converts broker price data into alternative chart formats. It supports Sierra-style Range Bars, several Renko variations, and Point & Figure charts. The generated data is displayed either in the current chart or in a separate chart, according to your selection.
The indicator is designed for chart analysis and visualization. It does not open, modify, or close trades and does not generate guaranteed trading results.
SUPPORTED CHART FORMATS
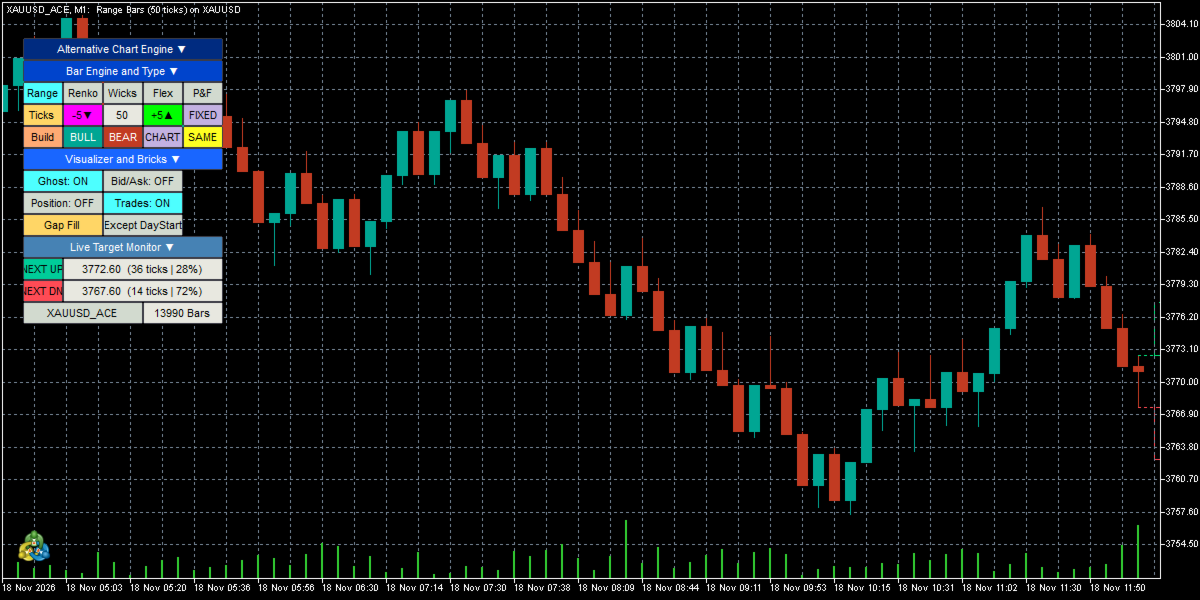
Sierra-style Range Bars
Build bars when price travels through the configured range, measured in ticks. Choose one of four gap-handling modes:
• Preserve gaps.
• Fill all bar gaps.
• Fill only the start-of-day gap.
• Fill gaps except at the start of the day.
Classic Renko
Build direction-based Renko bricks without wicks. Configure the brick size in pips or use an ATR-derived size.
Renko With Wicks
Build Renko bricks and display adverse price movement as wicks, providing additional visual context around each brick.
Flex Renko
Use separate trend and reversal dimensions. In fixed mode, enter the trend and reversal sizes independently. In ATR mode, ATR determines the trend size while the reversal dimension remains separately configurable. Enable or disable adverse wicks for this format.
Point & Figure
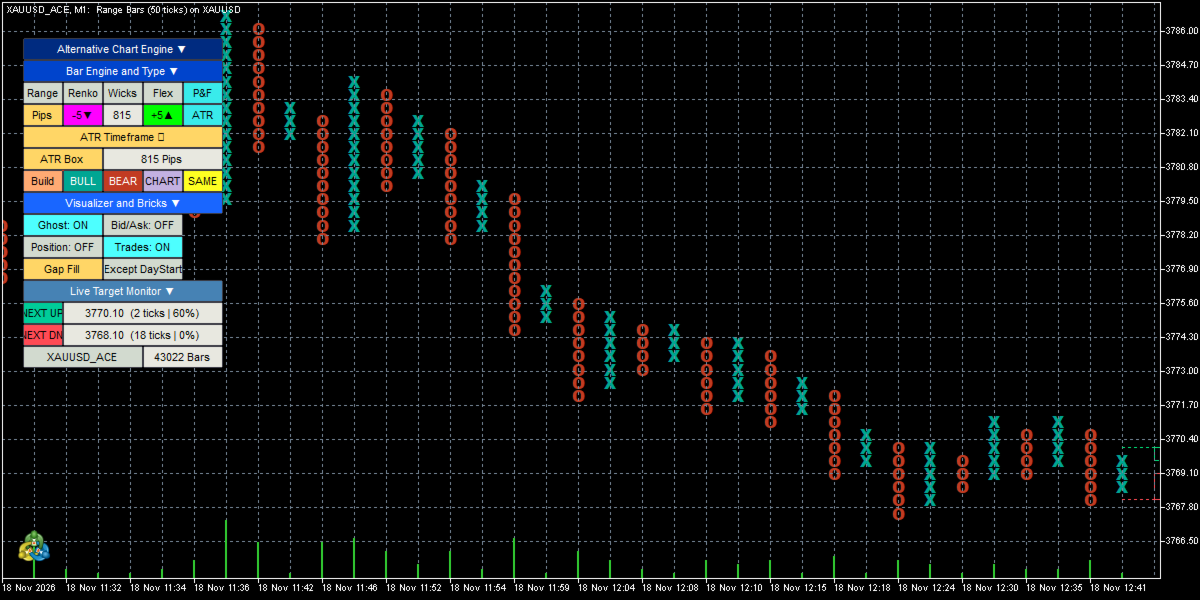
Build X and O columns with a three-box reversal. The standard candle display is hidden in this mode and each box is shown as a bold X or O, making the column structure easier to distinguish.
BOX SIZE AND ATR
Select Fixed or ATR sizing. Fixed Range Bars use ticks. Fixed Renko and Point & Figure boxes use pips. The pip size can be inferred from the symbol digits or overridden manually; tick size can also be overridden when needed.
For ATR sizing, configure the ATR period, calculation timeframe, and multiplier. ATR can optionally be smoothed with a moving average; select the moving-average method and period. Available ATR timeframes can be selected from the on-chart accordion menu. The box size is refreshed after a candle closes on the chosen ATR timeframe. When ATR data is not yet available, the current box size is retained until the required data loads.
ON-CHART CONTROL PANEL
The collapsible panel provides controls for chart format, box size, fixed or ATR sizing, ATR timeframe, rebuilding the generated series, chart output, and chart colors. The -5 and +5 controls adjust the current fixed size. The displayed unit changes with the selected chart format: ticks for Range Bars and pips for Renko and Point & Figure.
The panel also includes optional visualizer controls for the incomplete next-brick reference, bid and ask lines, open positions, closed trades, and the Range gap mode. Bid and ask lines and open-position drawings are off by default and can be enabled from the panel. Sections can be expanded or collapsed to keep the chart panel compact.
CHART OUTPUT AND CUSTOM SYMBOLS
Choose between using the current chart and opening or reusing a separate output chart. In current-chart mode, the chart is switched to the generated series. In separate-chart mode, the source chart remains available while the generated chart is shown separately.
The generated series is stored as a MetaTrader 5 custom symbol. The engine reuses a custom symbol for each source symbol as the chart type or size changes, instead of making a different symbol for every setting. The custom symbol name can be configured, and a Market Watch group can be selected. Old engine symbols are removed from Market Watch when they are no longer in use by an open chart.
COLORS AND CHART APPEARANCE
Use the chart's existing bullish and bearish colors or switch to custom colors. The initial custom colors are Persian Green and Persian Red; both colors can be changed in the indicator settings. Custom colors also apply to X and O marks in Point & Figure mode. Bid and ask lines have independent visibility and color settings.
LIVE POSITION AND CLOSED-TRADE VISUALIZATION
The optional open-position visualizer can display buy and sell entry levels, stop-loss and take-profit levels, and floating profit or loss in account currency and pips. Configure the line colors, styles, and width. The visualizer refresh rate can be set from one to four updates per second.
The closed-trade visualizer can draw recent completed trade history with separate colors for winning and losing trades. Limit the display by the number of trades, look-back period in days, and magic number. A magic number of zero includes trades from all magic numbers. These chart drawings are informational and do not alter account orders.
INCOMPLETE NEXT-BRICK REFERENCE
The optional ghost-brick display shows where the next configured Range or Renko threshold lies relative to current price. Depending on the selected display options, it can show a projected box, target lines, the target price, remaining ticks, and progress toward the threshold. This is a live measurement of distance to the configured level; it is not a forecast of future price movement. Display colors and line styles can be configured independently for upward and downward thresholds.
HISTORY, DATA SOURCES, AND LIMITATIONS
At startup, the indicator first requests the selected period of one-minute source history so the time series can synchronize, then builds the chart from broker tick data. If data is still downloading or is unavailable, it continues with the data the broker has supplied. If tick history is unavailable or does not cover the requested history period, the indicator can use one-minute OHLC bars to reconstruct older data. This fallback is approximate: one-minute OHLC data does not reveal the exact sequence of prices inside each minute, so reconstructed Range, Renko, or Point & Figure history may differ from a build based on complete tick history.
After initialization, new chart data is processed from incoming broker prices. Results depend on the availability, quality, and precision of the broker's symbol specifications and historical data. The custom chart represents transformed price data and may not match the appearance or bar sequence of a standard time-based chart.
GETTING STARTED
1. Attach the indicator to the source symbol.
2. Select a chart format from the on-chart panel or indicator inputs.
3. Choose Fixed or ATR sizing and set the required size and calculation options.
4. Select current-chart or separate-chart output.
5. Adjust chart colors and enable any optional visualizers you need.
This product is a chart transformation and visualization tool. It does not provide trade recommendations, automate trading, or promise financial outcomes.