CostXRay
- Göstergeler
-
Almuatasim Assad Abdel Rahman Aqel
 Trader and MQL5 developer based in Dubai. I trade gold, forex and crypto, and I’ve spent years building and testing trading systems on MetaTrader, which taught me how much the right numbers matter and how often they’re hidden.
- Sürüm: 1.9
- Etkinleştirmeler: 5
COST X-RAY - MQL5 Market listing
Product type: Indicator | Platform: MetaTrader 5 | Price: 30 USD, buy only (no rent option) | Version 1.09
SHORT DESCRIPTION
What every trade really costs: cost per trade in money, how much of your grid step or target the cost eats, the cheapest and dearest hours, and your daily and monthly bill. Reads only, never trades.
FULL DESCRIPTION
Most traders know their spread. Few know what it costs them per month.
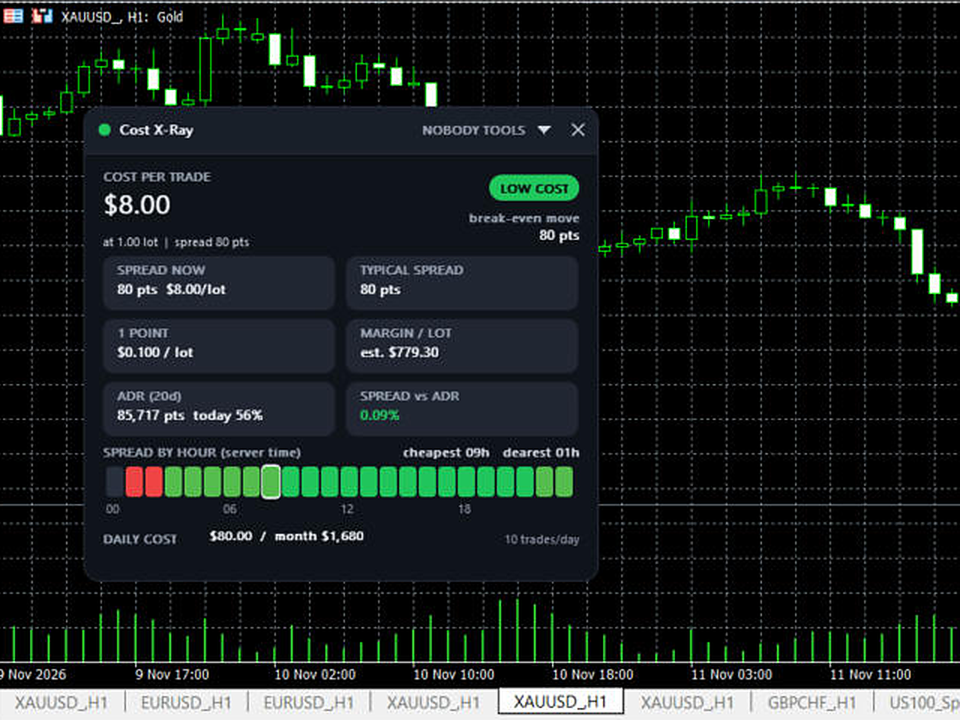
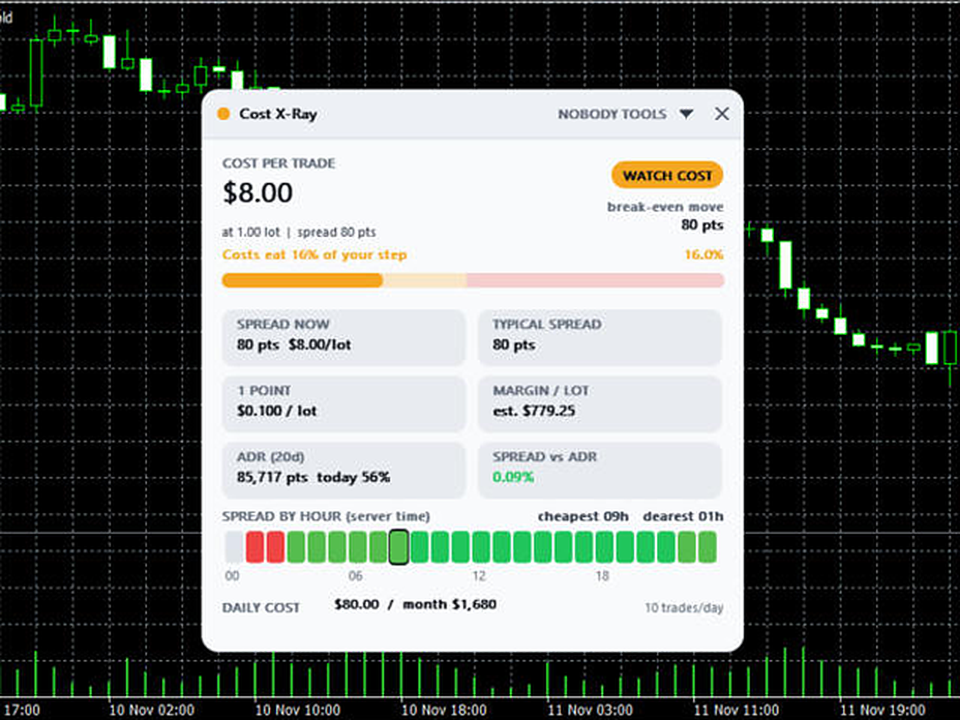
Cost X-Ray turns spread and commission into numbers you can act on: money per trade, the share of your step or target that costs take, and what your trading costs per day and per month.
It never opens, modifies or closes a trade. It only reads. It gives no buy or sell signals.
What the panel shows
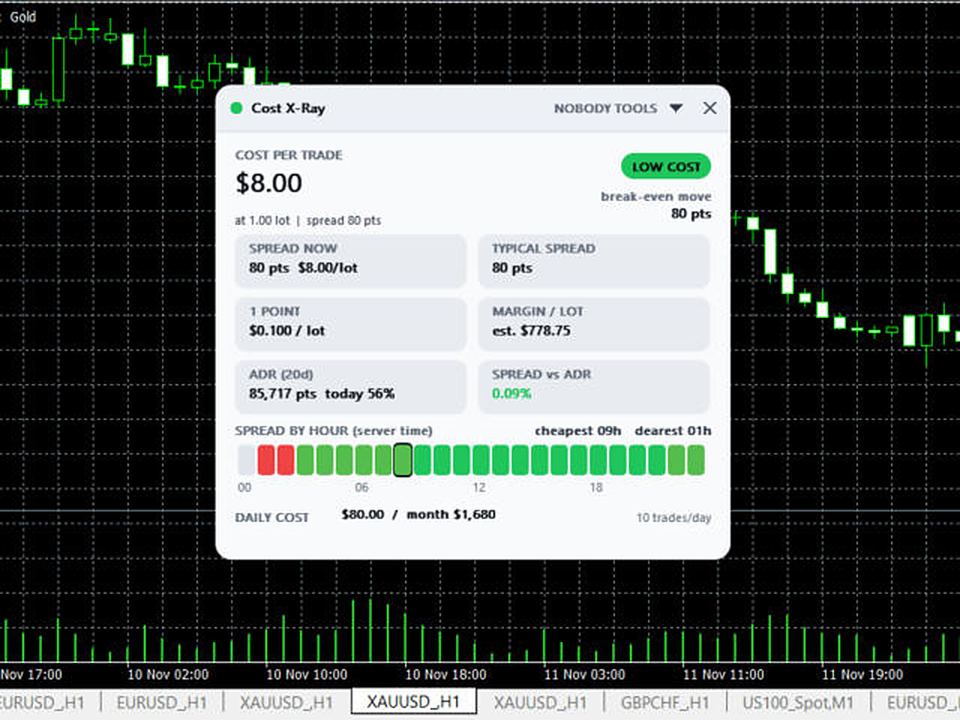
- Cost per trade in your account currency, at the lot size you trade, and the break-even move in points.
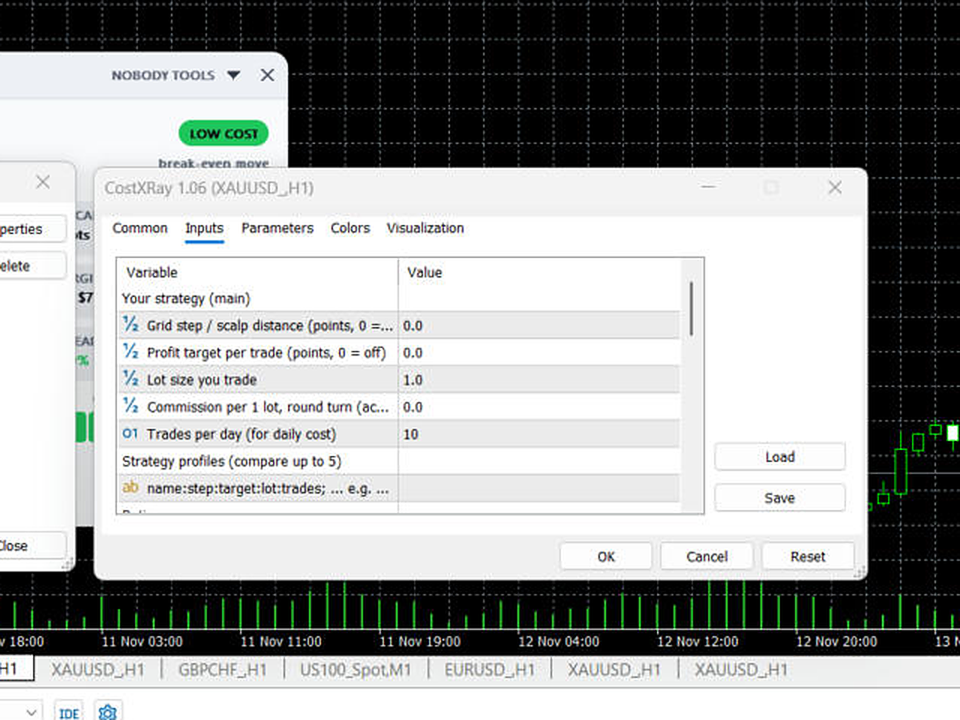
- "Costs eat X% of your step": enter your grid step, scalp distance or profit target and see how much of it goes to the broker. The rating turns from LOW COST to WATCH COST to HIGH COST.
- Spread now and the typical spread for this symbol.
- Value of 1 point per lot and estimated margin per lot.
- Average daily range (ADR) and the spread as a share of it.
- Spread by hour: a 24-hour strip showing the cheapest and dearest hours of the day in server time, so you can see when not to trade.
- Daily and monthly cost at your number of trades per day.
Compare strategies
Enter up to 5 strategy profiles (name, step, target, lot, trades per day) and see the cost of each side by side on the same symbol.
Alerts and log
Optional alert when the cost rating turns HIGH. Optional CSV log of spread and cost, one row every few minutes, in MQL5\Files\CostXRay.
Typical spread
Bar history only keeps the lowest spread of each minute, which reads too low. Cost X-Ray learns the typical spread from the live feed and remembers it per symbol. During the first minutes on a new symbol the tile is labelled "learning" or "M1 lows" so you know where the number comes from.
Panel
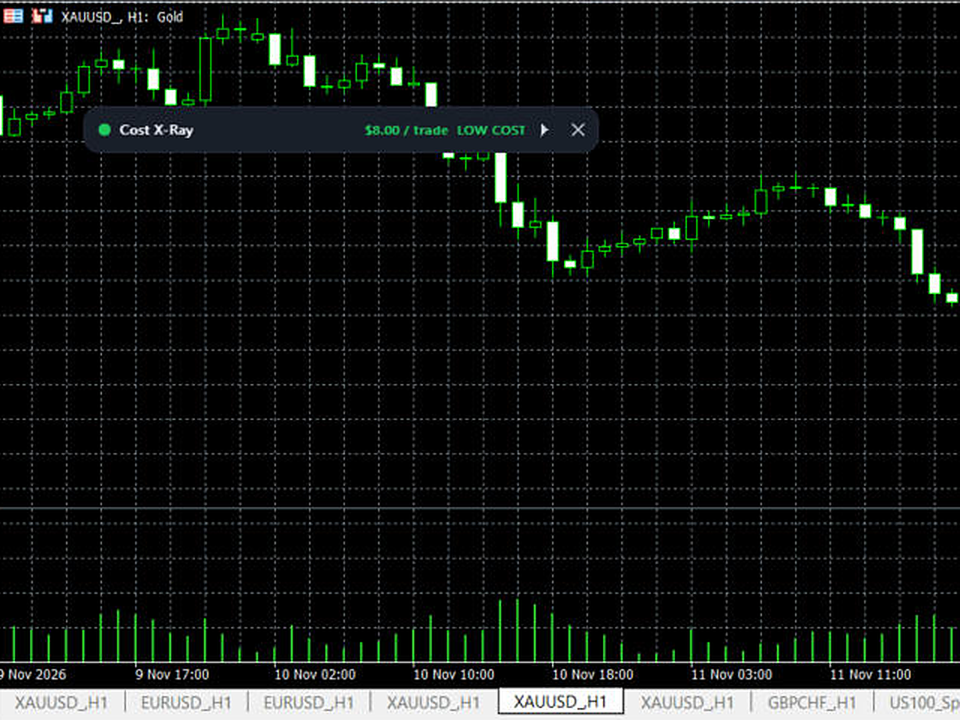
Drag the header to move it. Click the arrow to collapse it to one line. Click the x twice to remove it. Dark and light theme, size in percent. The position is remembered per chart.
Notes
- Works on any symbol and any broker, hedging and netting accounts.
- Margin is an estimate from the broker's own calculation for a 1-lot buy.
- Pairs well with the free Spread Siren from Nobody Tools.