Advanced harmonic chart pattern scanner
- Göstergeler
- Sürüm: 3.20
- Etkinleştirmeler: 20

Advanced Harmonic Chart Pattern
Harmonic trading works, but spotting the patterns by hand is slow. You measure the swings, check the Fibonacci ratios, and by the time you’re sure, the move has often happened. Advanced Harmonic Chart Pattern does that scanning for you and puts the result on your chart.
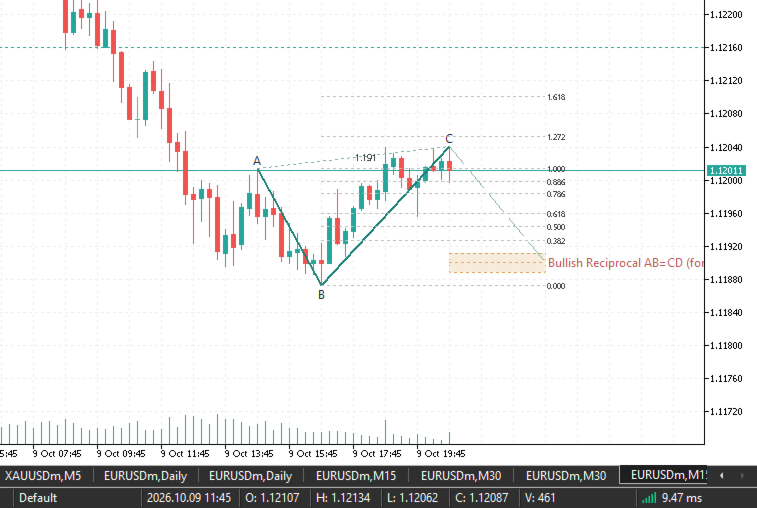
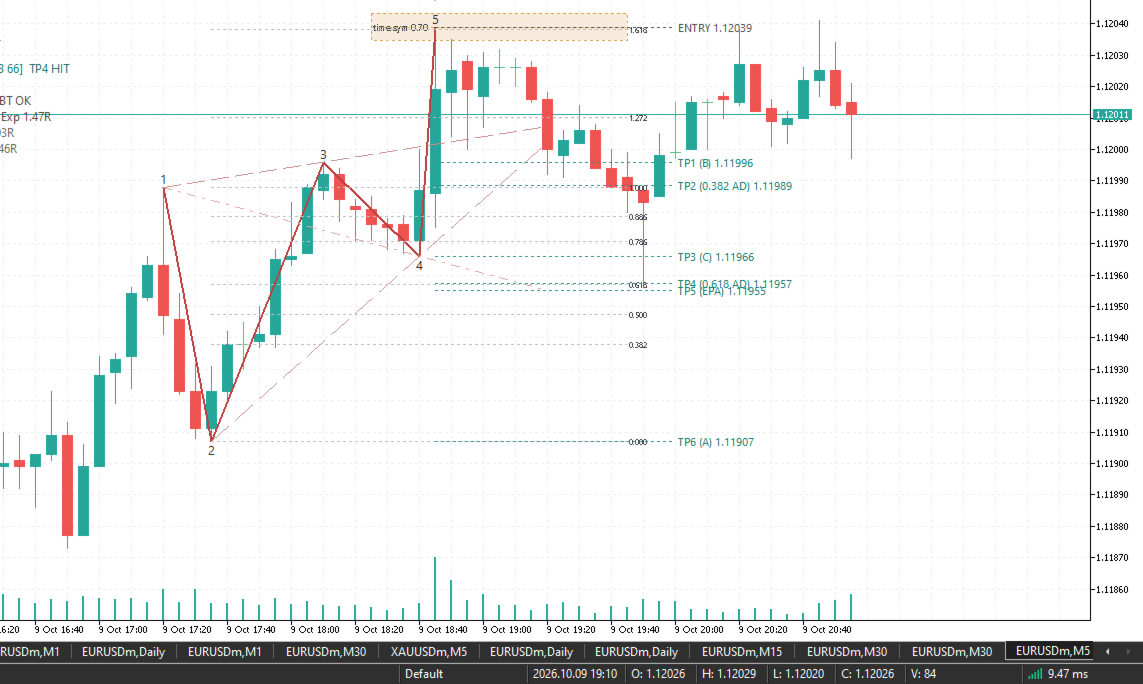
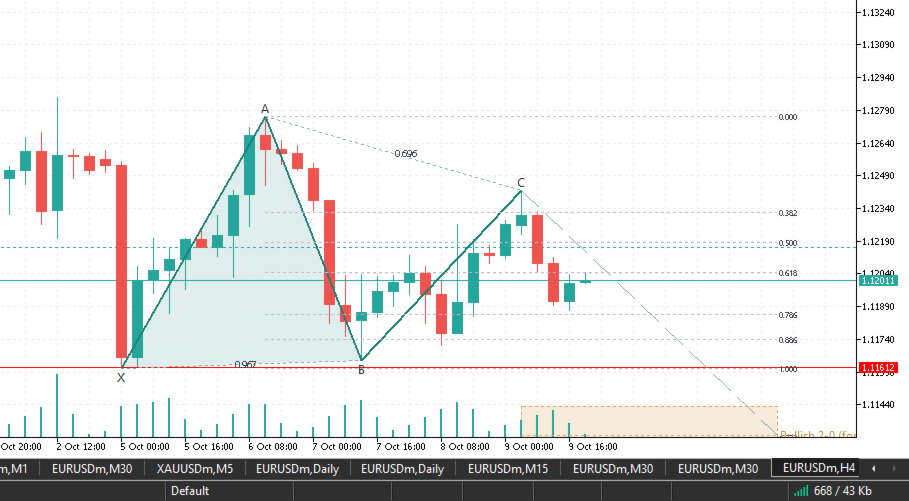
It looks for 30 harmonic and geometric patterns, including Gartley, Bat, Alt Bat, Max Bat, Butterfly, Crab, Deep Crab, Cypher, Shark, 5-0, Leonardo, Nen Star, Three Drives, AB=CD and Wolfe Wave. It then draws the one that matters right now.
Only the current pattern, so your chart stays clean
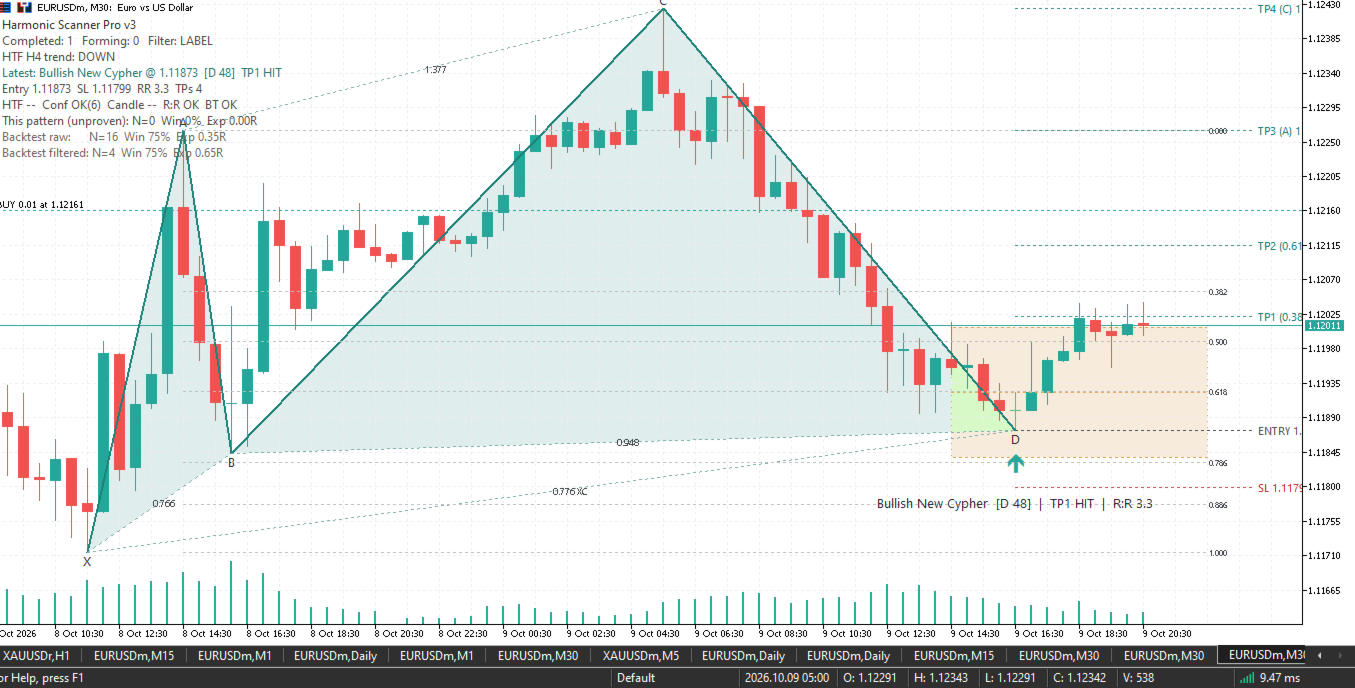
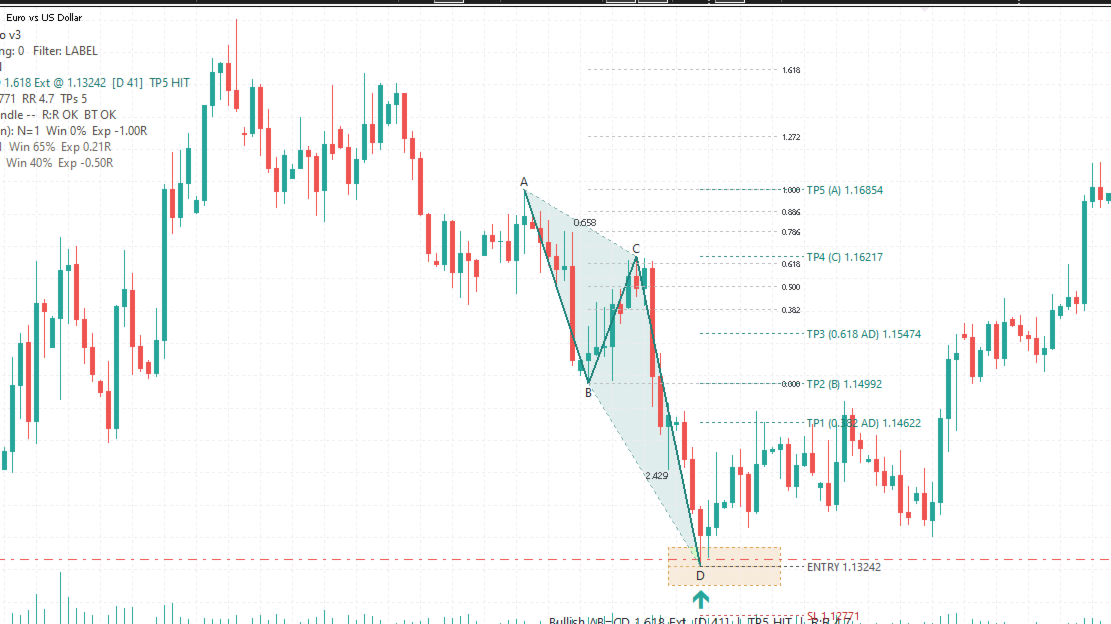
Most pattern indicators bury the chart under old setups. This one shows only the pattern that is live or forming at the moment. You see the legs, the ratios, the Potential Reversal Zone (PRZ) and a ready-made trade plan, with nothing else cluttering the screen.
What you get with every setup
- Bullish and bearish patterns, both completed and still forming
- A projected PRZ for forming patterns, with a live “% to PRZ” or “IN PRZ” status
- Entry, stop loss and up to five take-profit levels based on the pattern’s own structure
- Risk-to-reward calculated for you, with a minimum R:R filter
- A grade (A to D) and score for each setup, so you can tell strong ones from marginal ones
- A built-in backtest on your own symbol and timeframe, showing win rate and expectancy for each pattern type
Filters that cut out weak setups
- Higher-timeframe trend alignment
- Confluence checks with Fibonacci clusters and past support and resistance
- Candlestick confirmation at the completion point (hammer, engulfing, morning/evening star and more)
- Choose how strict you want it: show everything, grade everything, or show only setups that pass every filter
Built to be comfortable to use
- Automatically adapts to light and dark chart backgrounds
- Alerts by popup, sound, push notification and email
- Signal buffers for reading entry, stop, targets and score from an EA
- Clean info panel with current trend, trade levels and statistics
- Every pattern can be switched on or off, and the ratio tolerance is adjustable
How to get the best results: use W1 for direction, lower timeframes for entries
For the highest quality trades, find the main signal on the W1 chart. A weekly pattern shows the dominant direction and the most meaningful zones. Then drop to a lower timeframe such as H4, H1 or M30 and take the entry there when the signal lines up with the weekly one. Trading in the direction of the main higher-timeframe signal and using the lower timeframe for precise timing gives tighter stops and tends to produce more take-profit hits than trading either timeframe in isolation.
Good to know
- Forming patterns can adjust as price moves. A pattern is confirmed once the final swing point is set.
- The built-in backtest is based on historical data and is meant as a guide, not a prediction.
- Always use a stop loss and size your positions to your own risk tolerance.
Trading involves risk, and no indicator wins every trade. Past performance does not guarantee future results.